


Phteven
Members
-
Joined
-
Last visited
-
I found this on Sat night, best of luck dude and appreciate the hard work put into this. ❤️
-
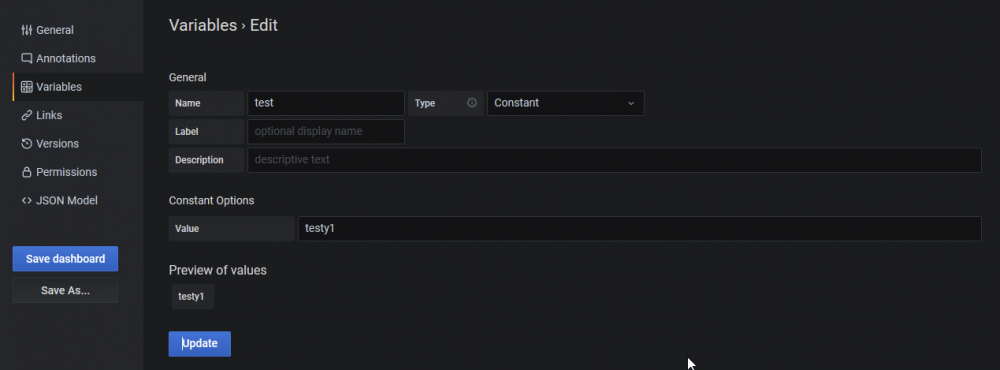
Dashboard settings >> Variables >> Set "Type" to "Constant" and give it a value then update. I dunno if it works tho. Your 3rd question, is covered by the "regular" variables (type "query") - I'm using influxdb v2 so it just shows me a big text box but on mine it might let you build a query. Then you could query the serial number for a specific disk and save it in a variable.
-
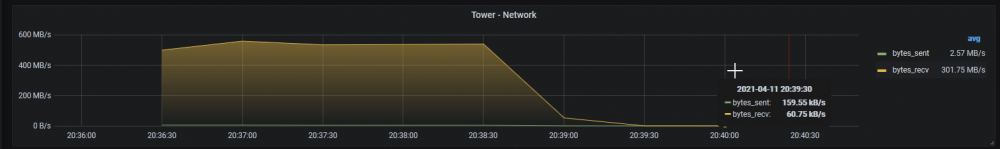
Okay, that was a bit more straightforward than I thought it would be. This appears to set it up nicely and along with the labelling set to kb/s appears to show reasonably well what the overall speed is. from(bucket: "telegraf") |> range(start: v.timeRangeStart, stop: v.timeRangeStop) |> filter(fn: (r) => r["_measurement"] == "net" and r["_field"] == "bytes_sent" and r["host"] == "Tower") |> pivot(rowKey: ["_time"], columnKey: ["_field"], valueColumn: "_value") |> difference(columns: ["bytes_sent"]) difference() takes the table of data and creates a new table, with each row now containing the difference between each selected value, from the bottom up.
-
One of the things I'm trying to wrap my head around, is correct bandwidth utilization on a particular interface. bytes_sent and bytes_recv only list the total traffic on each interface. Thinking about it, you'd need the last 2 results, subtract oldest from newest which I think should get you how much the network interface is being utilized at that point in time. I found this which uses the formula: bps = ((poll2 -poll1)*8)/time_in_seconds_between_polls Which apparently will give a % utilization. Would you then add IN + OUT utilization to get a total utilization of the interface? Or is it better to leave them separate.
-
If it helps, it was a lot easier than I thought it would be. Only minor adjustments to telegraf.conf and Grafana dashboard settings required. The query language is not very intuitive, but InfluxDB has a nice query builder which helps a little. Now that I have some of the basics out of the way the other panels are a bit easier.
-
Phteven joined the community
-
Is anyone interested in some of the settings to get this working using flux (influxdb v2.0 language / API). Have gotten about half of the queries re-written for it atm.


