


Wirman
Members
-
Joined
-
Last visited
Everything posted by Wirman
-
Ja mist, wenn die .img Datei beschädigt ist und ich nicht mehr drauf zugreifen kann. Lessons learnt, jetzt muss ich es wohl versuchen aus den .imgs wiederherzustellen. Die wichtigste VM, die von HomeAssistant, müsste dann vermutlich auch kaputt sein. edit: habs hinbekommen, die HomeAssistant VM startet und läuft soweit. Generelle Frage: Das VM Backup Plugin (Beta das richtige?) kann die VMs im laufenden Betrieb backupen?
-
Okay, das mit den Dockern hat geklappt. laut sind die configs in system/libvirt/libvirt.img gespeichert. Dort liegt bei mir eine Datei mit 1,07GB. Es zeigt mir aber nichts unter VM an. Kann ich irgendwie die configs aus der Datei wiederherstellen? Okay, wenn ich die libvirt.img auf Windows kopiere und dort versuche zu öffnen, sagt es mir, dass die Datei beschädigt sei. Gibts eine Möglichkeit auf die Dateien innerhalb der libvirt zugreifen zu können, dass ich eventuell die configs wiederherstellen kann? Falls das nicht geht, was würde passieren, wenn ich die die VMs neu konfiguriere mit den .imgs und etwas an den Parametern anders einstelle?
-
Hab jetzt den Pool entfernt, die defekte Platte entfernt und den Pool neu angelegt und den Mover gestartet. Ein Großteil der Daten (unter anderem 2 der VMs) sind komplett, jetzt hab ich aber das Problem, dass die zwar in den richtigen Ordnern sind, aber die Konfigurationen dazu weg sind, Unter VM und Docker im Dashboard ist alles leer. Wo speichert Unraid denn die Konfigurationen? In den Apps zeigt es die Docker nicht mehr als installiert an.
-
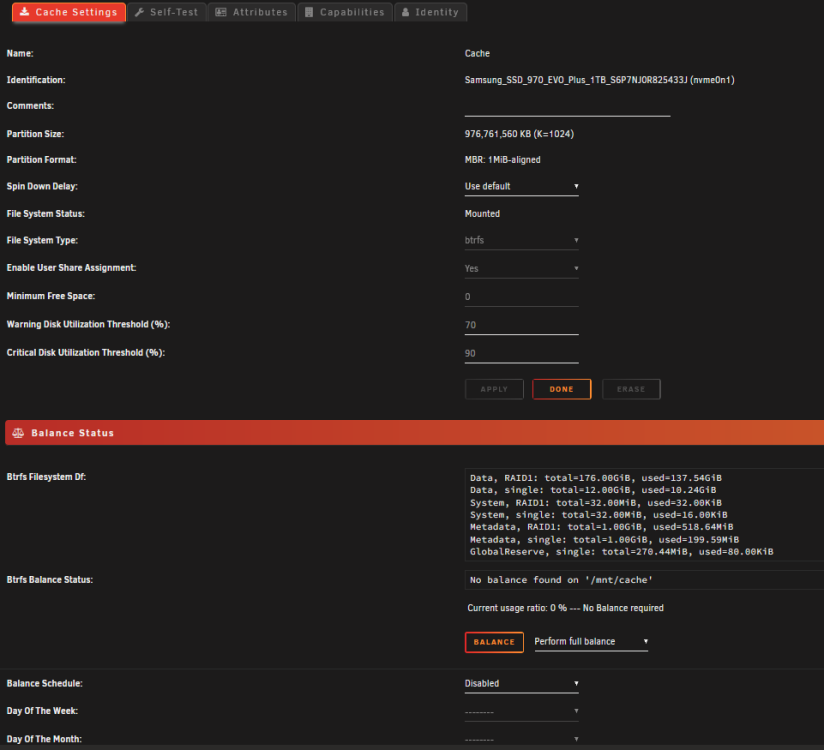
Nach dem Move sind immer noch diverse Ordner in appdata, domains und system in zwei locations. Im Log bekomme ich Fehler a la: Mar 29 15:33:32 jarvis move: error: move, 392: Input/output error (5): lstat: /mnt/cache/system/docker/installed/btrfs/subvolumes/2183f70ef0121783280a0cf06ad8037911981ec3822749e87398e1358370ec45 und Mar 29 15:34:01 jarvis kernel: BTRFS error (device nvme0n1p1): bad tree block start, want 2211463168 have 0 Wenn ich auf Cache klicke im Dashboard, komme ich auf die Cache Settings Seite, die ich im vorigen Post als Bild im Spoiler angehängt habe.
-
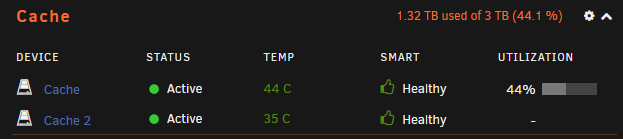
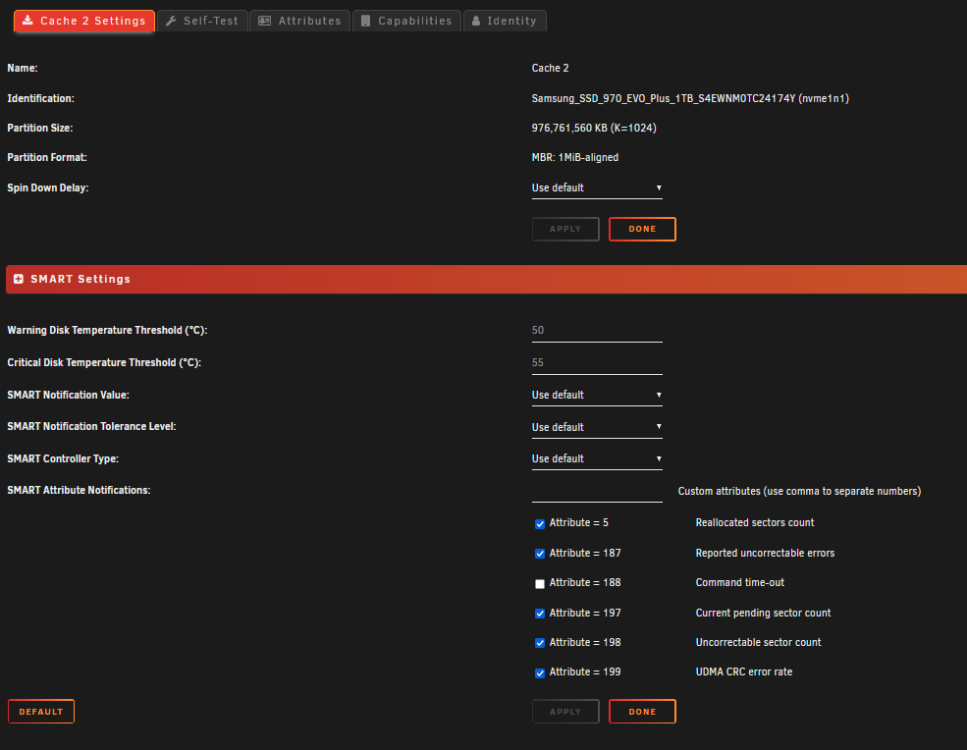
Ja, ich hab Docker und VMs in den Settings deaktiviert, dann erst den Mover gestartet. Erst nachdem der Mover fertig war, ich die neue SSD eingebaut habe, die SSD dem Pool zugewiesen habe und die Shares wieder anders eingestellt habe, habe ich den Mover erneut gestartet und nachdem er wieder fertig war, dann habe ich erst wieder die VM und Docker in den Settings enabled. Yes:Cache ist auch die richtige Einstellung oder? Bei No kopiert er ja nichts vom Cache aufs Array, wenn ich das richtig verstehe. Wo sehe ich das RAID Level? Im Dashboard sehe ich es nicht, wenn ich die Platten anklicke und in die Setttings gehe, dann sieht es jedoch anders aus für beide Platten. Dashboard: Cache 1 (kaputte Platte) Cache 2 (neue Platte): Ich stell jetzt nochmal appdata, domains und system auf Yes:Cache und lass den Mover nochmal laufen.
-
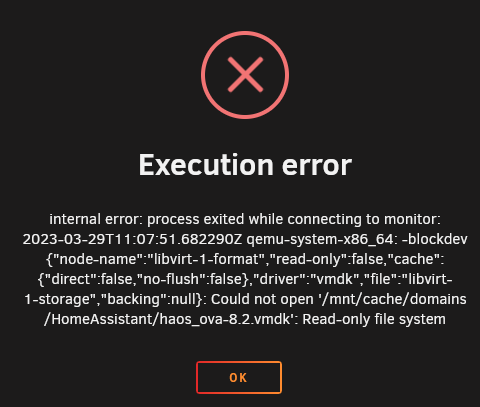
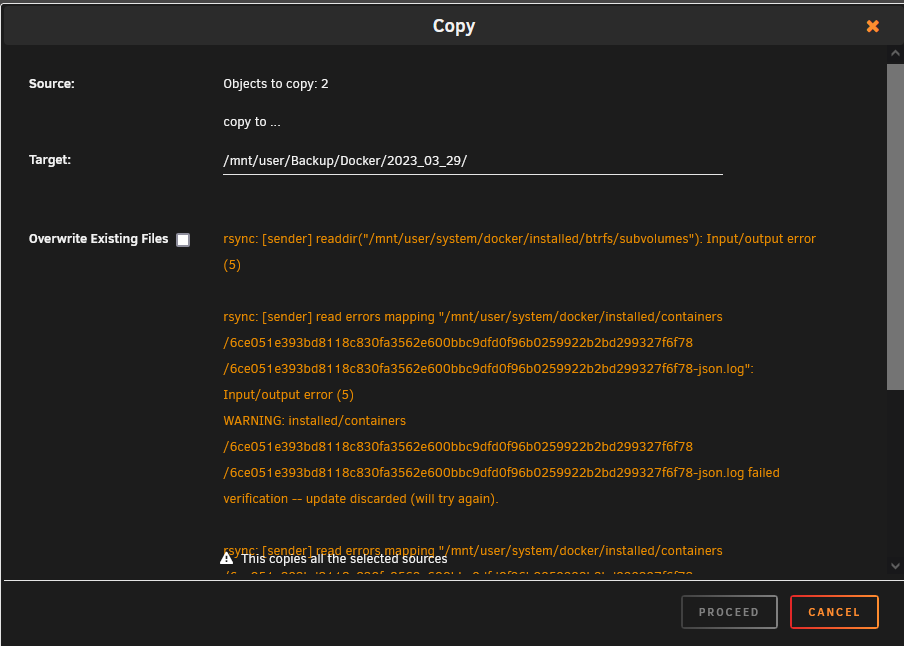
Danke für die Klarstellung. Ich habe das jetzt so gemacht, wie ihr gesagt habt, Shares von Prefer:Cache auf Yes:Cache gestellt, den Mover gestartet und schlussendlich war dann wieder alles auf grün bei den Shares. Jetzt habe ich die neue von der RMA gekommene Festplatte eingebaut und wollte jetzt beide im RAID betreiben, bis die alte mit dem selben Fehler auch kaputt geht. Ich hab die Shares wieder umgestellt auf Prefer:Cache und den Mover gestartet. Mehrere Dinge sind mir jetzt unklar oder es klappt etwas nicht. 1. Warum zeigt es mir 3TB Size im Cachepool an? Erstens hab ich doch nur 1TB SSDs die ja im RAID1 laufen sollten, und ja auch nur 2 Stück. Ist die Standardkonfiguration nicht RAID1 im Cache? Ich bin mir nicht mehr sicher, die Einrichtung war schon zu lange her. Aber es zeigt ja keine Reads/Writes auf der zweiten Platte an, das spricht ja dafür, dass da nichts passiert. 2. Ich kann nun meine VMs nicht mehr starten, bei HomeAssistant kommt z.B. folgender Fehler: Docker zeigt es gar nicht mehr an, wenn ich auf Docker klicke, kommt. "Docker Service failed to start." 3. Nach der Mover Aktion ist die zweite SSD von 25% Available Spare auf 0% runter. Ich wollte nun meine VMs und Docker manuell vom Cache auf einen Backup Ordner per File Manager kopieren, dann wird alles kopiert bis 100%, dann läuft die anzeige aber über 100% hinaus und dann kommt folgender Fehler: Ich weiß jetzt nicht ob meine Daten geschützt sind oder nicht. Ich denke wenn ich einen Neustart mache oder das Array stoppe, nach dem Neustart könnte die kaputte Cache platte nicht mehr erkannt werden (so war es zumindest bei der ersten). Der Fehler ist denke ich am ehesten ein Schreibfehler, sprich Lesen geht noch solange die Platte jetzt noch erkannt ist. Im FileManager steht bei Location, dass appdata, system und domains sowohl auf der cache disk, als auch auf disk2 (vom array) liegt. Müsste das nicht von disk2 wieder runter sein, nachdem ich den Mover nach einstellen der Shares auf Prefer wieder gestartet habe? Danke für eure Hilfe

-
Okay, dann würde ich es mit der 970 Evo Plus aus der RMA nochmal versuchen und die SMART Werte regelmäßig checken.
-
Okay, dann mach ich das wohl so mit dem Array. Die AData Legend 960 ist PCIe 4.0, mein Board hat nur 3.0.Da lohnt sich der Aufpreis für PCIe 4.0 nicht so. Kennt jemand diese hier? https://geizhals.de/apacer-as2280p4u-pro-1tb-ap1tbas2280p4upro-1-a2625758.html?hloc=at&hloc=de
-
Hi, ich hatte hier schon mein Problem mit meinen Cache Disks beschrieben: Jetzt wollte ich hier mal weiter machen. Ich schicke die erste der Evo 970 Plus zur RMA. Die zweite wird auf kurz oder lang auch kaputt gehen. Anscheinend wird ein Firmware Update die Probleme lösen. Habt ihr noch andere Ideen oder Erfahrungen, welche Festplatten für den Cache gut sind? Angenommen ich würde einen Tausch machen, kann ich jetzt z.B. 2x WesternDigital NVMes kaufen, mit 1TB und dann erst eine einbauen, dem CachePool hinzufügen, warten bis das Raid sich synchronisiert hat und dann die bereits vorhandene Festplatte mit der zweiten neuen Festplatte tauschen? Oder gibt es eine andere Möglichkeit, die vielleicht eher empfohlen wird? Danke für eure Hilfe und vg Wirman
-
okay, then i will try the new nvme from rma process with the firmware update.
-
Thanks. Do you recommend any other NVMe or brand?
-
Okay, but it is not a specific problem of the Evo 970 Plus? Maybe only a bad batch? I will send the nvme through RMA and hope the next one will be better.
-
Yeah i know. But the spare value starts with value 100. My NVMe in my Laptop which is 7 years old has still a spare value of 100. I am just wondering why the spare value of the EVO 970 Plus is so bad in combination with unraid. The NVMes are only about a year old. One of them is apparently dead, and with the other one it is probably only a question of time. So i am wondering if i can do something to prevent the disk of getting bad available spares.
-
Hi, i have two Samsung Evo 970 Plus as cache drives. After a reboot the second disk could not be found and assigned to a pool. I have taken the disk out of the server and put it in an nvme adapter and have run crystal info on it. There it says Critical warning 9 and available spare 0. (Threshold 10) I have run the smart test with the diskSpeed docker in unraid on the first cache disk and there it also says only 30 available spare. Why is this value there also so bad? Here are the other values: SMART Data as of Mar 9, 2023 1:13 AM Temperature 42 Celsius Warning Comp. Temperature Time 0 Critical Comp. Temperature Time 0 Temperature Sensor 1 42 Celsius Temperature Sensor 2 40 Celsius Critical Warning 0x00 Available Spare 30% Available Spare Threshold 10% Percentage Used 2% Data Units Read 7,002,678 [3.58 TB] Data Units Written 55,581,189 [28.4 TB] Host Read Commands 68,939,664 Host Write Commands 1,155,659,216 Controller Busy Time 20,175 Power Cycles 144 Power On Hours 6,125 Unsafe Shutdowns 70 What can i do to prevent this? Or is it a problem with the disks? (but it contains both disks, is that probable?) Thanks in advance for your help Wirman
-
Hm, that sounds a bit impractical. The second to last time, it took 15 days for the error to occur. Is safe mode only without docker and VMs? Or are there other features disabled?
-
and again i had to shutdown the system. Attached ist the log since the relevant errors. Unfortunately i don't understand these errors, i have no idea about the kernel. It starts with this warning: Oct 17 00:27:59 jarvis kernel: WARNING: CPU: 4 PID: 27239 at arch/x86/kvm/mmu/mmu.c:3835 kvm_mmu_page_fault+0x1e8/0x4b5 [kvm] after that, the system was still working 13 hours, but then the following appears: Oct 17 13:32:38 jarvis kernel: Invalid SPTE change: cannot replace a present leaf Oct 17 13:32:38 jarvis kernel: SPTE with another present leaf SPTE mapping a Oct 17 13:32:38 jarvis kernel: different PFN! Oct 17 13:32:38 jarvis kernel: as_id: 0 gfn: 127644 old_spte: ffff8881057ddd58 new_spte: 6000003f6e44b77 level: 1 Oct 17 13:32:38 jarvis kernel: ------------[ cut here ]------------ Oct 17 13:32:38 jarvis kernel: kernel BUG at arch/x86/kvm/mmu/tdp_mmu.c:446! Oct 17 13:32:38 jarvis kernel: invalid opcode: 0000 [#1] SMP NOPTI Oct 17 13:32:38 jarvis kernel: CPU: 8 PID: 29233 Comm: CPU 0/KVM Tainted: G W O 5.15.46-Unraid #1 Oct 17 13:32:38 jarvis kernel: Hardware name: Gigabyte Technology Co., Ltd. W480M VISION W/W480M VISION W, BIOS F21 11/23/2021 Oct 17 13:32:38 jarvis kernel: RIP: 0010:__handle_changed_spte+0x113/0x42d [kvm] ... there it says something of a kernel bug. But what can i do now with this information? After that, the cpu is again on stall Oct 17 13:33:38 jarvis kernel: rcu: INFO: rcu_sched self-detected stall on CPU That's really annoying and i am really lost. In the kernel code i found this: /** * __handle_changed_spte - handle bookkeeping associated with an SPTE change * @kvm: kvm instance * @as_id: the address space of the paging structure the SPTE was a part of * @gfn: the base GFN that was mapped by the SPTE * @old_spte: The value of the SPTE before the change * @new_spte: The value of the SPTE after the change * @level: the level of the PT the SPTE is part of in the paging structure * @shared: This operation may not be running under the exclusive use of * the MMU lock and the operation must synchronize with other * threads that might be modifying SPTEs. * * Handle bookkeeping that might result from the modification of a SPTE. * This function must be called for all TDP SPTE modifications. */ static void __handle_changed_spte(struct kvm *kvm, int as_id, gfn_t gfn, u64 old_spte, u64 new_spte, int level, bool shared) { bool was_present = is_shadow_present_pte(old_spte); bool is_present = is_shadow_present_pte(new_spte); bool was_leaf = was_present && is_last_spte(old_spte, level); bool is_leaf = is_present && is_last_spte(new_spte, level); bool pfn_changed = spte_to_pfn(old_spte) != spte_to_pfn(new_spte); WARN_ON(level > PT64_ROOT_MAX_LEVEL); WARN_ON(level < PG_LEVEL_4K); WARN_ON(gfn & (KVM_PAGES_PER_HPAGE(level) - 1)); /* * If this warning were to trigger it would indicate that there was a * missing MMU notifier or a race with some notifier handler. * A present, leaf SPTE should never be directly replaced with another * present leaf SPTE pointing to a different PFN. A notifier handler * should be zapping the SPTE before the main MM's page table is * changed, or the SPTE should be zeroed, and the TLBs flushed by the * thread before replacement. */ if (was_leaf && is_leaf && pfn_changed) { pr_err("Invalid SPTE change: cannot replace a present leaf\n" "SPTE with another present leaf SPTE mapping a\n" "different PFN!\n" "as_id: %d gfn: %llx old_spte: %llx new_spte: %llx level: %d", as_id, gfn, old_spte, new_spte, level); /* * Crash the host to prevent error propagation and guest data * corruption. */ BUG(); } What is the SPTE? Line 446 is the BUG(); line of course. What could cause this problem? Is it a hardware thing? Is it a software setting? Is it in the software itself? Is it meaningful to upgrade to the new Unraid version, when in the new kernel version the __handle_changed_spte function hasn't changed until the point, where BUG() occurs? syslog
-
okay, so you think, the switch to ipvlan will resolve the error, why the cpu is stalling? Oct 10 21:43:39 jarvis kernel: rcu: INFO: rcu_sched self-detected stall on CPU Oct 10 21:43:39 jarvis kernel: rcu: 12-....: (60000 ticks this GP) idle=03f/1/0x4000000000000000 softirq=10533211/10533211 fqs=14583 Oct 10 21:43:39 jarvis kernel: (t=60000 jiffies g=36180177 q=58701) Oct 10 21:43:39 jarvis kernel: NMI backtrace for cpu 12 Oct 10 21:43:39 jarvis kernel: CPU: 12 PID: 16137 Comm: kworker/u40:6 Tainted: G W O 5.15.46-Unraid #1 Oct 10 21:43:39 jarvis kernel: Hardware name: Gigabyte Technology Co., Ltd. W480M VISION W/W480M VISION W, BIOS F21 11/23/2021 Oct 10 21:43:39 jarvis kernel: Workqueue: events_power_efficient gc_worker [nf_conntrack] Oct 10 21:43:39 jarvis kernel: Call Trace: Oct 10 21:43:39 jarvis kernel: <IRQ> Oct 10 21:43:39 jarvis kernel: dump_stack_lvl+0x46/0x5a Oct 10 21:43:39 jarvis kernel: nmi_cpu_backtrace+0xae/0xd2 Oct 10 21:43:39 jarvis kernel: ? lapic_can_unplug_cpu+0x93/0x93 Oct 10 21:43:39 jarvis kernel: nmi_trigger_cpumask_backtrace+0x56/0xd3 Oct 10 21:43:39 jarvis kernel: rcu_dump_cpu_stacks+0xc3/0xea Oct 10 21:43:39 jarvis kernel: rcu_sched_clock_irq+0x22d/0x631 Oct 10 21:43:39 jarvis kernel: ? trigger_load_balance+0x7a/0x292 Oct 10 21:43:39 jarvis kernel: ? tick_sched_do_timer+0x3e/0x3e Oct 10 21:43:39 jarvis kernel: update_process_times+0x8c/0xab Oct 10 21:43:39 jarvis kernel: tick_sched_timer+0x38/0x65 Oct 10 21:43:39 jarvis kernel: __hrtimer_run_queues+0xf8/0x18a Oct 10 21:43:39 jarvis kernel: hrtimer_interrupt+0x92/0x160 Oct 10 21:43:39 jarvis kernel: __sysvec_apic_timer_interrupt+0x96/0xdb Oct 10 21:43:39 jarvis kernel: sysvec_apic_timer_interrupt+0x61/0x7d Oct 10 21:43:39 jarvis kernel: </IRQ> Oct 10 21:43:39 jarvis kernel: <TASK> Oct 10 21:43:39 jarvis kernel: asm_sysvec_apic_timer_interrupt+0x12/0x20 Oct 10 21:43:39 jarvis kernel: RIP: 0010:gc_worker+0x140/0x30b [nf_conntrack] Oct 10 21:43:39 jarvis kernel: Code: 00 0f 9e c1 e9 83 01 00 00 41 8b 45 08 48 8b 15 b1 04 eb e1 29 d0 85 c0 7f 10 4c 89 ef 41 ff c6 e8 57 fb ff ff e9 d8 00 00 00 <41> 8b 45 08 48 8b 15 90 04 eb e1 29 d0 ba 00 00 00 00 0f 48 c2 ba Oct 10 21:43:39 jarvis kernel: RSP: 0018:ffffc9000293fe48 EFLAGS: 00000202 Oct 10 21:43:39 jarvis kernel: RAX: 000000000ed17370 RBX: 00000000000493df RCX: ffff8881ad600000 Oct 10 21:43:39 jarvis kernel: RDX: 000000010ed39b66 RSI: ffffc9000293fe54 RDI: ffff8885c23d6a48 Oct 10 21:43:39 jarvis kernel: RBP: 0000000000015b2d R08: 0000000000000000 R09: 0000000080190017 Oct 10 21:43:39 jarvis kernel: R10: ffff88810319e3c0 R11: ffff88810319e3c0 R12: ffffffffa036d620 Oct 10 21:43:39 jarvis kernel: R13: ffff8885c23d6a00 R14: 0000000000000030 R15: ffff8885c23d6a48 Oct 10 21:43:39 jarvis kernel: ? gc_worker+0xb2/0x30b [nf_conntrack] Oct 10 21:43:39 jarvis kernel: process_one_work+0x195/0x27a Oct 10 21:43:39 jarvis kernel: worker_thread+0x19c/0x240 Oct 10 21:43:39 jarvis kernel: ? rescuer_thread+0x28b/0x28b Oct 10 21:43:39 jarvis kernel: kthread+0xdc/0xe3 Oct 10 21:43:39 jarvis kernel: ? set_kthread_struct+0x32/0x32 Oct 10 21:43:39 jarvis kernel: ret_from_fork+0x1f/0x30 Oct 10 21:43:39 jarvis kernel: </TASK>
-
i did this, but these renewing ip messages are still showing up. syslog
-
Okay, the syslog was appended, i don't know, why i haven't seen this before. Attached is the syslog. I restarted the server on Oct 11 00:26:13. Before i have a self detected stall on cpu and the interface cannot find the router. These messages started to show on Oct 10 21:43:39. In the log before there is always a renewing of adresses on the interfaces, is this normal behavior? syslog
-
Okay, now i had the freeze again, with Mirror syslog to flash enabled. But where can i find the logs now? This thread: says, that they are in the /logs folder, but i do not have such folder on the usb drive. A "find -name logs" in root directory only shows me some log folders in docker and the boot/logs, but there are only the previous diagnostics i made in there. and the syslog file (/boot/logs/syslog) starts also with the time after reboot, so this is not the appended file. Am i missing something? Thanks in advance

-
Thanks for the advice, i have done that, now i am waiting for the next freeze. I think only way for me is to write the log to the usb, because the server is running after the freeze, but the networks are down, so a remote syslog would not work.
-
Hi, i have a problem, every once in a while (about 3-4 times a month), my Unraid System freezes. Freeze means: I am not able to remotely connect to the WebGUI, and the VMs and Dockers are also not reachable. If i put on the monitor connected to the server, it does not recognize the source. If i replug the monitor, i see the terminal log in screen, but it does not respond to keyboard inputs. The fans are working normally, the computer is still on. All i can do, is a hard shutdown by long pressing the power button. I have attached my log file. I have no idea what triggers that behavior, sometimes I notice that the system is frozen only after several hours. Can someone read out of the diagnostics file, why the server freezes? Or what kind of freeze that is? Is there a way to do a clean shutdown with a short press of the power button? Is there a setting for that? Thanks in advance Wirman jarvis-diagnostics-20220917-2139.zip
-
The solution was: OPNSense has a setting under Firewal: Firewall Optimization. This should be set to "conservative". Then everything works fine.
-
Okay, i have found the problem, but not the solution. i have 3 vlans, 10.0.10.xx (Home), 10.0.20.xx (IoT) and 10.0.100.xx (Guest). The unraid server is together with the router, switch and access points in the 10.0.0.xx If i put my device from where i access the server into the 10.0.0.xx subnet, then everything works fine. But if i put my device in one of my vlans, the remote connection to my services fail again everytime after about 30 seconds. I have a OPNsense firewall and i tried to set a Outbound NAT rule from i.e. the Home VLAN to the server and check the box STATIC PORT. But that does not work either, or i do something wrong. Did anybody encounter a similar problem or can anyone tell me, which firewall settings i have to use? Is the port remapping the problem? Thanks in advance
-
Hi all, i hope there is a easy solution for my problem or i have a bad setting somewhere. I have problems using the VNC remote over the WebUI. The WebUI of Unraid itself is stable, but if i start a docker, a vm or something else over the WebUI, the UI of the service will freeze after around 30-40 seconds. If i restart the UI, the same behavior occurs. This affects also the ssh connection, the connection via smb shares or the terminal application. Does anyone have an idea what is wrong? The problem was not there from the beginning, but i don't know exactly when it first occured. Thanks in advance


