


bluetwo12
Members
-
Joined
-
Last visited
-
I do not have a back up. However; It worked in the morning after the pool was fixed. And then suddenly didnt. There were 0 changes to the system. Not sure how the vdisk could have been corrupted then. Anyway to investigate if the vdisk image is actually damaged
-
Here ya go: still cant get my VM to boot up from my vdisk1 image
-
lyoton-diagnostics-20240124-0624.zip
-
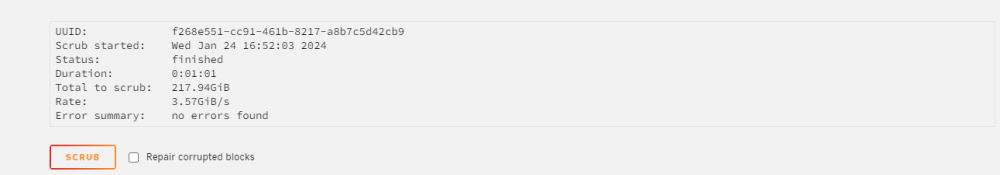
Alright long story short. Had a crab ton of errors (87% full error log) looked that one of my cache drives in the cache pool was out of sync. I rebooted my server, scrubbed and rebalanced and that fixed my problem. Went to to start my VM's and my libvirt appeared to be corrupted. I deleted that image, restarted VM services. Remade my VM pointing to the original vdisk1. Wouldnt load using vitrio (only showed the skip startup.nsh message) but would load with IDE selected. Honestly no idea what those two differences are and that could have screwed me. Anyways, shut down the VM and went to work incase that was the original cause of my errors, I didnt want them blasting all day. Came home, loaded up the VM and got the skip startup.nsh on both setting again. I attempted to re delete my libvirt with no success. I also attempted to add a boot from file via OMVF. At that point I would just getting a solid blue screen that would eventually shutdown the VM. Did I lose all my data somehow? any advice? lyoton-syslog-20240123-0345.zip
-
Here is my short test. I am pending the long test but wanted to get a jump start on some deciphering. I have also deleted stuff on unraid (movies) through windows. I assume this wouldnt cause these errors..right? It showed 400 errors on the unraid array page Edit: Added full extended test at end smartctl 7.3 2022-02-28 r5338 [x86_64-linux-5.19.17-Unraid] (local build) Copyright (C) 2002-22, Bruce Allen, Christian Franke, www.smartmontools.org === START OF INFORMATION SECTION === Model Family: Western Digital Red Device Model: WDC WD4 Serial Number: WD-WCC LU WWN Device Id: 5 0014ee 20d3c70d2 Firmware Version: 82.00A82 User Capacity: 4,000,787,030,016 bytes [4.00 TB] Sector Sizes: 512 bytes logical, 4096 bytes physical Rotation Rate: 5400 rpm Device is: In smartctl database 7.3/5417 ATA Version is: ACS-2 (minor revision not indicated) SATA Version is: SATA 3.0, 6.0 Gb/s (current: 6.0 Gb/s) Local Time is: Thu Oct 26 19:14:58 2023 PDT SMART support is: Available - device has SMART capability. SMART support is: Enabled AAM feature is: Unavailable APM feature is: Unavailable Rd look-ahead is: Enabled Write cache is: Enabled DSN feature is: Unavailable ATA Security is: Disabled, frozen [SEC2] Wt Cache Reorder: Enabled === START OF READ SMART DATA SECTION === SMART overall-health self-assessment test result: PASSED General SMART Values: Offline data collection status: (0x00) Offline data collection activity was never started. Auto Offline Data Collection: Disabled. Self-test execution status: ( 0) The previous self-test routine completed without error or no self-test has ever been run. Total time to complete Offline data collection: (51360) seconds. Offline data collection capabilities: (0x7b) SMART execute Offline immediate. Auto Offline data collection on/off support. Suspend Offline collection upon new command. Offline surface scan supported. Self-test supported. Conveyance Self-test supported. Selective Self-test supported. SMART capabilities: (0x0003) Saves SMART data before entering power-saving mode. Supports SMART auto save timer. Error logging capability: (0x01) Error logging supported. General Purpose Logging supported. Short self-test routine recommended polling time: ( 2) minutes. Extended self-test routine recommended polling time: ( 513) minutes. Conveyance self-test routine recommended polling time: ( 5) minutes. SCT capabilities: (0x703d) SCT Status supported. SCT Error Recovery Control supported. SCT Feature Control supported. SCT Data Table supported. SMART Attributes Data Structure revision number: 16 Vendor Specific SMART Attributes with Thresholds: ID# ATTRIBUTE_NAME FLAGS VALUE WORST THRESH FAIL RAW_VALUE 1 Raw_Read_Error_Rate POSR-K 200 200 051 - 892 3 Spin_Up_Time POS--K 203 178 021 - 6816 4 Start_Stop_Count -O--CK 100 100 000 - 70 5 Reallocated_Sector_Ct PO--CK 200 200 140 - 0 7 Seek_Error_Rate -OSR-K 200 200 000 - 0 9 Power_On_Hours -O--CK 092 092 000 - 6165 10 Spin_Retry_Count -O--CK 100 253 000 - 0 11 Calibration_Retry_Count -O--CK 100 253 000 - 0 12 Power_Cycle_Count -O--CK 100 100 000 - 70 192 Power-Off_Retract_Count -O--CK 200 200 000 - 44 193 Load_Cycle_Count -O--CK 200 200 000 - 37 194 Temperature_Celsius -O---K 113 108 000 - 39 196 Reallocated_Event_Count -O--CK 200 200 000 - 0 197 Current_Pending_Sector -O--CK 200 200 000 - 0 198 Offline_Uncorrectable ----CK 100 253 000 - 0 199 UDMA_CRC_Error_Count -O--CK 200 200 000 - 0 200 Multi_Zone_Error_Rate ---R-- 100 253 000 - 0 ||||||_ K auto-keep |||||__ C event count ||||___ R error rate |||____ S speed/performance ||_____ O updated online |______ P prefailure warning General Purpose Log Directory Version 1 SMART Log Directory Version 1 [multi-sector log support] Address Access R/W Size Description 0x00 GPL,SL R/O 1 Log Directory 0x01 SL R/O 1 Summary SMART error log 0x02 SL R/O 5 Comprehensive SMART error log 0x03 GPL R/O 6 Ext. Comprehensive SMART error log 0x06 SL R/O 1 SMART self-test log 0x07 GPL R/O 1 Extended self-test log 0x09 SL R/W 1 Selective self-test log 0x10 GPL R/O 1 NCQ Command Error log 0x11 GPL R/O 1 SATA Phy Event Counters log 0x21 GPL R/O 1 Write stream error log 0x22 GPL R/O 1 Read stream error log 0x80-0x9f GPL,SL R/W 16 Host vendor specific log 0xa0-0xa7 GPL,SL VS 16 Device vendor specific log 0xa8-0xb6 GPL,SL VS 1 Device vendor specific log 0xb7 GPL,SL VS 39 Device vendor specific log 0xbd GPL,SL VS 1 Device vendor specific log 0xc0 GPL,SL VS 1 Device vendor specific log 0xc1 GPL VS 93 Device vendor specific log 0xe0 GPL,SL R/W 1 SCT Command/Status 0xe1 GPL,SL R/W 1 SCT Data Transfer SMART Extended Comprehensive Error Log Version: 1 (6 sectors) Device Error Count: 5 CR = Command Register FEATR = Features Register COUNT = Count (was: Sector Count) Register LBA_48 = Upper bytes of LBA High/Mid/Low Registers ] ATA-8 LH = LBA High (was: Cylinder High) Register ] LBA LM = LBA Mid (was: Cylinder Low) Register ] Register LL = LBA Low (was: Sector Number) Register ] DV = Device (was: Device/Head) Register DC = Device Control Register ER = Error register ST = Status register Powered_Up_Time is measured from power on, and printed as DDd+hh:mm:SS.sss where DD=days, hh=hours, mm=minutes, SS=sec, and sss=millisec. It "wraps" after 49.710 days. Error 5 [4] occurred at disk power-on lifetime: 6165 hours (256 days + 21 hours) When the command that caused the error occurred, the device was active or idle. After command completion occurred, registers were: ER -- ST COUNT LBA_48 LH LM LL DV DC -- -- -- == -- == == == -- -- -- -- -- 40 -- 51 00 00 00 00 08 37 fe 58 40 00 Error: UNC at LBA = 0x0837fe58 = 137887320 Commands leading to the command that caused the error were: CR FEATR COUNT LBA_48 LH LM LL DV DC Powered_Up_Time Command/Feature_Name -- == -- == -- == == == -- -- -- -- -- --------------- -------------------- 60 00 08 00 88 00 01 00 e6 02 40 40 08 2d+19:24:17.769 READ FPDMA QUEUED 60 00 08 00 80 00 01 00 e6 02 00 40 08 2d+19:24:17.769 READ FPDMA QUEUED 60 00 08 00 78 00 01 00 e6 01 c0 40 08 2d+19:24:17.769 READ FPDMA QUEUED 60 00 08 00 70 00 01 00 e6 01 78 40 08 2d+19:24:17.769 READ FPDMA QUEUED 60 00 08 00 68 00 01 00 e5 fe 20 40 08 2d+19:24:17.769 READ FPDMA QUEUED Error 4 [3] occurred at disk power-on lifetime: 6165 hours (256 days + 21 hours) When the command that caused the error occurred, the device was active or idle. After command completion occurred, registers were: ER -- ST COUNT LBA_48 LH LM LL DV DC -- -- -- == -- == == == -- -- -- -- -- 40 -- 51 00 00 00 00 08 37 f0 80 40 00 Error: UNC at LBA = 0x0837f080 = 137883776 Commands leading to the command that caused the error were: CR FEATR COUNT LBA_48 LH LM LL DV DC Powered_Up_Time Command/Feature_Name -- == -- == -- == == == -- -- -- -- -- --------------- -------------------- 60 03 00 00 c8 00 00 08 37 f9 50 40 08 2d+19:24:13.042 READ FPDMA QUEUED 60 01 00 00 c0 00 00 08 37 fc 50 40 08 2d+19:24:13.042 READ FPDMA QUEUED 60 00 10 00 b8 00 00 08 37 f9 40 40 08 2d+19:24:13.042 READ FPDMA QUEUED 60 04 00 00 a8 00 00 08 37 f5 40 40 08 2d+19:24:13.042 READ FPDMA QUEUED 60 04 00 00 a0 00 00 08 37 fd 50 40 08 2d+19:24:13.042 READ FPDMA QUEUED Error 3 [2] occurred at disk power-on lifetime: 6165 hours (256 days + 21 hours) When the command that caused the error occurred, the device was active or idle. After command completion occurred, registers were: ER -- ST COUNT LBA_48 LH LM LL DV DC -- -- -- == -- == == == -- -- -- -- -- 40 -- 51 00 00 00 00 08 37 e3 80 40 00 Error: WP at LBA = 0x0837e380 = 137880448 Commands leading to the command that caused the error were: CR FEATR COUNT LBA_48 LH LM LL DV DC Powered_Up_Time Command/Feature_Name -- == -- == -- == == == -- -- -- -- -- --------------- -------------------- 61 03 f0 00 f8 00 00 08 37 f1 50 40 08 2d+19:24:09.631 WRITE FPDMA QUEUED 60 04 00 00 50 00 00 08 37 ed 40 40 08 2d+19:24:09.631 READ FPDMA QUEUED 60 04 00 00 48 00 00 08 37 e9 40 40 08 2d+19:24:09.631 READ FPDMA QUEUED 60 04 00 00 40 00 00 08 37 e5 40 40 08 2d+19:24:09.630 READ FPDMA QUEUED 60 04 00 00 38 00 00 08 37 e1 40 40 08 2d+19:24:09.630 READ FPDMA QUEUED Error 2 [1] occurred at disk power-on lifetime: 6165 hours (256 days + 21 hours) When the command that caused the error occurred, the device was active or idle. After command completion occurred, registers were: ER -- ST COUNT LBA_48 LH LM LL DV DC -- -- -- == -- == == == -- -- -- -- -- 40 -- 51 00 00 00 00 08 37 f1 50 40 00 Error: WP at LBA = 0x0837f150 = 137883984 Commands leading to the command that caused the error were: CR FEATR COUNT LBA_48 LH LM LL DV DC Powered_Up_Time Command/Feature_Name -- == -- == -- == == == -- -- -- -- -- --------------- -------------------- 61 03 18 00 08 00 00 08 37 d6 28 40 08 2d+19:24:05.594 WRITE FPDMA QUEUED 60 04 00 00 a8 00 00 08 37 f1 40 40 08 2d+19:24:05.594 READ FPDMA QUEUED 60 03 00 00 a0 00 00 08 37 d9 40 40 08 2d+19:24:05.594 READ FPDMA QUEUED 60 01 00 00 98 00 00 08 37 dc 40 40 08 2d+19:24:05.594 READ FPDMA QUEUED 60 04 00 00 90 00 00 08 37 dd 40 40 08 2d+19:24:05.594 READ FPDMA QUEUED Error 1 [0] occurred at disk power-on lifetime: 6165 hours (256 days + 21 hours) When the command that caused the error occurred, the device was active or idle. After command completion occurred, registers were: ER -- ST COUNT LBA_48 LH LM LL DV DC -- -- -- == -- == == == -- -- -- -- -- 40 -- 51 00 00 00 00 08 37 d6 28 40 00 Error: UNC at LBA = 0x0837d628 = 137877032 Commands leading to the command that caused the error were: CR FEATR COUNT LBA_48 LH LM LL DV DC Powered_Up_Time Command/Feature_Name -- == -- == -- == == == -- -- -- -- -- --------------- -------------------- 60 04 00 00 f8 00 00 08 37 ed 40 40 08 2d+19:24:02.222 READ FPDMA QUEUED 60 04 00 00 b8 00 00 08 37 e9 40 40 08 2d+19:24:02.219 READ FPDMA QUEUED 60 04 00 00 b0 00 00 08 37 e5 40 40 08 2d+19:24:02.216 READ FPDMA QUEUED 60 04 00 00 a8 00 00 08 37 e1 40 40 08 2d+19:24:01.758 READ FPDMA QUEUED 60 04 00 00 a0 00 00 08 37 dd 40 40 08 2d+19:24:01.757 READ FPDMA QUEUED SMART Extended Self-test Log Version: 1 (1 sectors) Num Test_Description Status Remaining LifeTime(hours) LBA_of_first_error # 1 Short offline Completed without error 00% 6165 - # 2 Short offline Aborted by host 70% 6165 - SMART Selective self-test log data structure revision number 1 SPAN MIN_LBA MAX_LBA CURRENT_TEST_STATUS 1 0 0 Not_testing 2 0 0 Not_testing 3 0 0 Not_testing 4 0 0 Not_testing 5 0 0 Not_testing Selective self-test flags (0x0): After scanning selected spans, do NOT read-scan remainder of disk. If Selective self-test is pending on power-up, resume after 0 minute delay. SCT Status Version: 3 SCT Version (vendor specific): 258 (0x0102) Device State: Active (0) Current Temperature: 39 Celsius Power Cycle Min/Max Temperature: 31/39 Celsius Lifetime Min/Max Temperature: 3/43 Celsius Under/Over Temperature Limit Count: 0/0 Vendor specific: 01 00 00 00 00 00 00 00 00 00 00 00 00 00 00 00 00 00 00 00 00 00 00 00 00 00 00 00 00 00 00 00 SCT Temperature History Version: 2 Temperature Sampling Period: 1 minute Temperature Logging Interval: 1 minute Min/Max recommended Temperature: 0/60 Celsius Min/Max Temperature Limit: -41/85 Celsius Temperature History Size (Index): 478 (275) Index Estimated Time Temperature Celsius 276 2023-10-26 11:17 37 ****************** ... ..(224 skipped). .. ****************** 23 2023-10-26 15:02 37 ****************** 24 2023-10-26 15:03 38 ******************* ... ..( 6 skipped). .. ******************* 31 2023-10-26 15:10 38 ******************* 32 2023-10-26 15:11 39 ******************** ... ..( 14 skipped). .. ******************** 47 2023-10-26 15:26 39 ******************** 48 2023-10-26 15:27 35 **************** ... ..( 69 skipped). .. **************** 118 2023-10-26 16:37 35 **************** 119 2023-10-26 16:38 36 ***************** ... ..( 76 skipped). .. ***************** 196 2023-10-26 17:55 36 ***************** 197 2023-10-26 17:56 37 ****************** ... ..( 77 skipped). .. ****************** 275 2023-10-26 19:14 37 ****************** SCT Error Recovery Control: Read: 70 (7.0 seconds) Write: 70 (7.0 seconds) Device Statistics (GP/SMART Log 0x04) not supported Pending Defects log (GP Log 0x0c) not supported SATA Phy Event Counters (GP Log 0x11) ID Size Value Description 0x0001 2 0 Command failed due to ICRC error 0x0002 2 0 R_ERR response for data FIS 0x0003 2 0 R_ERR response for device-to-host data FIS 0x0004 2 0 R_ERR response for host-to-device data FIS 0x0005 2 0 R_ERR response for non-data FIS 0x0006 2 0 R_ERR response for device-to-host non-data FIS 0x0007 2 0 R_ERR response for host-to-device non-data FIS 0x0008 2 0 Device-to-host non-data FIS retries 0x0009 2 2 Transition from drive PhyRdy to drive PhyNRdy 0x000a 2 3 Device-to-host register FISes sent due to a COMRESET 0x000b 2 0 CRC errors within host-to-device FIS 0x000f 2 0 R_ERR response for host-to-device data FIS, CRC 0x0012 2 0 R_ERR response for host-to-device non-data FIS, CRC 0x8000 4 8834066 Vendor specific ------------------------------------------------------------------------------------------------------------------------------------------------------------------------------------------------------------------------------------------------- smartctl 7.3 2022-02-28 r5338 [x86_64-linux-5.19.17-Unraid] (local build) Copyright (C) 2002-22, Bruce Allen, Christian Franke, www.smartmontools.org === START OF INFORMATION SECTION === Model Family: Western Digital Red Device Model: WDC WD40 Serial Number: WD-WCC LU WWN Device Id: 5 0014ee 20d3c70d2 Firmware Version: 82.00A82 User Capacity: 4,000,787,030,016 bytes [4.00 TB] Sector Sizes: 512 bytes logical, 4096 bytes physical Rotation Rate: 5400 rpm Device is: In smartctl database 7.3/5417 ATA Version is: ACS-2 (minor revision not indicated) SATA Version is: SATA 3.0, 6.0 Gb/s (current: 6.0 Gb/s) Local Time is: Thu Oct 26 19:35:51 2023 PDT SMART support is: Available - device has SMART capability. SMART support is: Enabled AAM feature is: Unavailable APM feature is: Unavailable Rd look-ahead is: Enabled Write cache is: Enabled DSN feature is: Unavailable ATA Security is: Disabled, frozen [SEC2] Wt Cache Reorder: Enabled === START OF READ SMART DATA SECTION === SMART overall-health self-assessment test result: PASSED General SMART Values: Offline data collection status: (0x00) Offline data collection activity was never started. Auto Offline Data Collection: Disabled. Self-test execution status: ( 121) The previous self-test completed having the read element of the test failed. Total time to complete Offline data collection: (51360) seconds. Offline data collection capabilities: (0x7b) SMART execute Offline immediate. Auto Offline data collection on/off support. Suspend Offline collection upon new command. Offline surface scan supported. Self-test supported. Conveyance Self-test supported. Selective Self-test supported. SMART capabilities: (0x0003) Saves SMART data before entering power-saving mode. Supports SMART auto save timer. Error logging capability: (0x01) Error logging supported. General Purpose Logging supported. Short self-test routine recommended polling time: ( 2) minutes. Extended self-test routine recommended polling time: ( 513) minutes. Conveyance self-test routine recommended polling time: ( 5) minutes. SCT capabilities: (0x703d) SCT Status supported. SCT Error Recovery Control supported. SCT Feature Control supported. SCT Data Table supported. SMART Attributes Data Structure revision number: 16 Vendor Specific SMART Attributes with Thresholds: ID# ATTRIBUTE_NAME FLAGS VALUE WORST THRESH FAIL RAW_VALUE 1 Raw_Read_Error_Rate POSR-K 200 200 051 - 892 3 Spin_Up_Time POS--K 203 178 021 - 6816 4 Start_Stop_Count -O--CK 100 100 000 - 70 5 Reallocated_Sector_Ct PO--CK 200 200 140 - 0 7 Seek_Error_Rate -OSR-K 200 200 000 - 0 9 Power_On_Hours -O--CK 092 092 000 - 6165 10 Spin_Retry_Count -O--CK 100 253 000 - 0 11 Calibration_Retry_Count -O--CK 100 253 000 - 0 12 Power_Cycle_Count -O--CK 100 100 000 - 70 192 Power-Off_Retract_Count -O--CK 200 200 000 - 44 193 Load_Cycle_Count -O--CK 200 200 000 - 37 194 Temperature_Celsius -O---K 114 108 000 - 38 196 Reallocated_Event_Count -O--CK 200 200 000 - 0 197 Current_Pending_Sector -O--CK 200 200 000 - 0 198 Offline_Uncorrectable ----CK 100 253 000 - 0 199 UDMA_CRC_Error_Count -O--CK 200 200 000 - 0 200 Multi_Zone_Error_Rate ---R-- 200 200 000 - 5 ||||||_ K auto-keep |||||__ C event count ||||___ R error rate |||____ S speed/performance ||_____ O updated online |______ P prefailure warning General Purpose Log Directory Version 1 SMART Log Directory Version 1 [multi-sector log support] Address Access R/W Size Description 0x00 GPL,SL R/O 1 Log Directory 0x01 SL R/O 1 Summary SMART error log 0x02 SL R/O 5 Comprehensive SMART error log 0x03 GPL R/O 6 Ext. Comprehensive SMART error log 0x06 SL R/O 1 SMART self-test log 0x07 GPL R/O 1 Extended self-test log 0x09 SL R/W 1 Selective self-test log 0x10 GPL R/O 1 NCQ Command Error log 0x11 GPL R/O 1 SATA Phy Event Counters log 0x21 GPL R/O 1 Write stream error log 0x22 GPL R/O 1 Read stream error log 0x80-0x9f GPL,SL R/W 16 Host vendor specific log 0xa0-0xa7 GPL,SL VS 16 Device vendor specific log 0xa8-0xb6 GPL,SL VS 1 Device vendor specific log 0xb7 GPL,SL VS 39 Device vendor specific log 0xbd GPL,SL VS 1 Device vendor specific log 0xc0 GPL,SL VS 1 Device vendor specific log 0xc1 GPL VS 93 Device vendor specific log 0xe0 GPL,SL R/W 1 SCT Command/Status 0xe1 GPL,SL R/W 1 SCT Data Transfer SMART Extended Comprehensive Error Log Version: 1 (6 sectors) Device Error Count: 5 CR = Command Register FEATR = Features Register COUNT = Count (was: Sector Count) Register LBA_48 = Upper bytes of LBA High/Mid/Low Registers ] ATA-8 LH = LBA High (was: Cylinder High) Register ] LBA LM = LBA Mid (was: Cylinder Low) Register ] Register LL = LBA Low (was: Sector Number) Register ] DV = Device (was: Device/Head) Register DC = Device Control Register ER = Error register ST = Status register Powered_Up_Time is measured from power on, and printed as DDd+hh:mm:SS.sss where DD=days, hh=hours, mm=minutes, SS=sec, and sss=millisec. It "wraps" after 49.710 days. Error 5 [4] occurred at disk power-on lifetime: 6165 hours (256 days + 21 hours) When the command that caused the error occurred, the device was active or idle. After command completion occurred, registers were: ER -- ST COUNT LBA_48 LH LM LL DV DC -- -- -- == -- == == == -- -- -- -- -- 40 -- 51 00 00 00 00 08 37 fe 58 40 00 Error: UNC at LBA = 0x0837fe58 = 137887320 Commands leading to the command that caused the error were: CR FEATR COUNT LBA_48 LH LM LL DV DC Powered_Up_Time Command/Feature_Name -- == -- == -- == == == -- -- -- -- -- --------------- -------------------- 60 00 08 00 88 00 01 00 e6 02 40 40 08 2d+19:24:17.769 READ FPDMA QUEUED 60 00 08 00 80 00 01 00 e6 02 00 40 08 2d+19:24:17.769 READ FPDMA QUEUED 60 00 08 00 78 00 01 00 e6 01 c0 40 08 2d+19:24:17.769 READ FPDMA QUEUED 60 00 08 00 70 00 01 00 e6 01 78 40 08 2d+19:24:17.769 READ FPDMA QUEUED 60 00 08 00 68 00 01 00 e5 fe 20 40 08 2d+19:24:17.769 READ FPDMA QUEUED Error 4 [3] occurred at disk power-on lifetime: 6165 hours (256 days + 21 hours) When the command that caused the error occurred, the device was active or idle. After command completion occurred, registers were: ER -- ST COUNT LBA_48 LH LM LL DV DC -- -- -- == -- == == == -- -- -- -- -- 40 -- 51 00 00 00 00 08 37 f0 80 40 00 Error: UNC at LBA = 0x0837f080 = 137883776 Commands leading to the command that caused the error were: CR FEATR COUNT LBA_48 LH LM LL DV DC Powered_Up_Time Command/Feature_Name -- == -- == -- == == == -- -- -- -- -- --------------- -------------------- 60 03 00 00 c8 00 00 08 37 f9 50 40 08 2d+19:24:13.042 READ FPDMA QUEUED 60 01 00 00 c0 00 00 08 37 fc 50 40 08 2d+19:24:13.042 READ FPDMA QUEUED 60 00 10 00 b8 00 00 08 37 f9 40 40 08 2d+19:24:13.042 READ FPDMA QUEUED 60 04 00 00 a8 00 00 08 37 f5 40 40 08 2d+19:24:13.042 READ FPDMA QUEUED 60 04 00 00 a0 00 00 08 37 fd 50 40 08 2d+19:24:13.042 READ FPDMA QUEUED Error 3 [2] occurred at disk power-on lifetime: 6165 hours (256 days + 21 hours) When the command that caused the error occurred, the device was active or idle. After command completion occurred, registers were: ER -- ST COUNT LBA_48 LH LM LL DV DC -- -- -- == -- == == == -- -- -- -- -- 40 -- 51 00 00 00 00 08 37 e3 80 40 00 Error: WP at LBA = 0x0837e380 = 137880448 Commands leading to the command that caused the error were: CR FEATR COUNT LBA_48 LH LM LL DV DC Powered_Up_Time Command/Feature_Name -- == -- == -- == == == -- -- -- -- -- --------------- -------------------- 61 03 f0 00 f8 00 00 08 37 f1 50 40 08 2d+19:24:09.631 WRITE FPDMA QUEUED 60 04 00 00 50 00 00 08 37 ed 40 40 08 2d+19:24:09.631 READ FPDMA QUEUED 60 04 00 00 48 00 00 08 37 e9 40 40 08 2d+19:24:09.631 READ FPDMA QUEUED 60 04 00 00 40 00 00 08 37 e5 40 40 08 2d+19:24:09.630 READ FPDMA QUEUED 60 04 00 00 38 00 00 08 37 e1 40 40 08 2d+19:24:09.630 READ FPDMA QUEUED Error 2 [1] occurred at disk power-on lifetime: 6165 hours (256 days + 21 hours) When the command that caused the error occurred, the device was active or idle. After command completion occurred, registers were: ER -- ST COUNT LBA_48 LH LM LL DV DC -- -- -- == -- == == == -- -- -- -- -- 40 -- 51 00 00 00 00 08 37 f1 50 40 00 Error: WP at LBA = 0x0837f150 = 137883984 Commands leading to the command that caused the error were: CR FEATR COUNT LBA_48 LH LM LL DV DC Powered_Up_Time Command/Feature_Name -- == -- == -- == == == -- -- -- -- -- --------------- -------------------- 61 03 18 00 08 00 00 08 37 d6 28 40 08 2d+19:24:05.594 WRITE FPDMA QUEUED 60 04 00 00 a8 00 00 08 37 f1 40 40 08 2d+19:24:05.594 READ FPDMA QUEUED 60 03 00 00 a0 00 00 08 37 d9 40 40 08 2d+19:24:05.594 READ FPDMA QUEUED 60 01 00 00 98 00 00 08 37 dc 40 40 08 2d+19:24:05.594 READ FPDMA QUEUED 60 04 00 00 90 00 00 08 37 dd 40 40 08 2d+19:24:05.594 READ FPDMA QUEUED Error 1 [0] occurred at disk power-on lifetime: 6165 hours (256 days + 21 hours) When the command that caused the error occurred, the device was active or idle. After command completion occurred, registers were: ER -- ST COUNT LBA_48 LH LM LL DV DC -- -- -- == -- == == == -- -- -- -- -- 40 -- 51 00 00 00 00 08 37 d6 28 40 00 Error: UNC at LBA = 0x0837d628 = 137877032 Commands leading to the command that caused the error were: CR FEATR COUNT LBA_48 LH LM LL DV DC Powered_Up_Time Command/Feature_Name -- == -- == -- == == == -- -- -- -- -- --------------- -------------------- 60 04 00 00 f8 00 00 08 37 ed 40 40 08 2d+19:24:02.222 READ FPDMA QUEUED 60 04 00 00 b8 00 00 08 37 e9 40 40 08 2d+19:24:02.219 READ FPDMA QUEUED 60 04 00 00 b0 00 00 08 37 e5 40 40 08 2d+19:24:02.216 READ FPDMA QUEUED 60 04 00 00 a8 00 00 08 37 e1 40 40 08 2d+19:24:01.758 READ FPDMA QUEUED 60 04 00 00 a0 00 00 08 37 dd 40 40 08 2d+19:24:01.757 READ FPDMA QUEUED SMART Extended Self-test Log Version: 1 (1 sectors) Num Test_Description Status Remaining LifeTime(hours) LBA_of_first_error # 1 Extended offline Completed: read failure 90% 6165 137877104 # 2 Short offline Completed without error 00% 6165 - # 3 Short offline Aborted by host 70% 6165 - SMART Selective self-test log data structure revision number 1 SPAN MIN_LBA MAX_LBA CURRENT_TEST_STATUS 1 0 0 Not_testing 2 0 0 Not_testing 3 0 0 Not_testing 4 0 0 Not_testing 5 0 0 Not_testing Selective self-test flags (0x0): After scanning selected spans, do NOT read-scan remainder of disk. If Selective self-test is pending on power-up, resume after 0 minute delay. SCT Status Version: 3 SCT Version (vendor specific): 258 (0x0102) Device State: Active (0) Current Temperature: 38 Celsius Power Cycle Min/Max Temperature: 31/39 Celsius Lifetime Min/Max Temperature: 3/43 Celsius Under/Over Temperature Limit Count: 0/0 Vendor specific: 01 00 00 00 00 00 00 00 00 00 00 00 00 00 00 00 00 00 00 00 00 00 00 00 00 00 00 00 00 00 00 00 SCT Temperature History Version: 2 Temperature Sampling Period: 1 minute Temperature Logging Interval: 1 minute Min/Max recommended Temperature: 0/60 Celsius Min/Max Temperature Limit: -41/85 Celsius Temperature History Size (Index): 478 (296) Index Estimated Time Temperature Celsius 297 2023-10-26 11:38 37 ****************** ... ..(203 skipped). .. ****************** 23 2023-10-26 15:02 37 ****************** 24 2023-10-26 15:03 38 ******************* ... ..( 6 skipped). .. ******************* 31 2023-10-26 15:10 38 ******************* 32 2023-10-26 15:11 39 ******************** ... ..( 15 skipped). .. ******************** 48 2023-10-26 15:27 39 ******************** 49 2023-10-26 15:28 38 ******************* ... ..( 6 skipped). .. ******************* 56 2023-10-26 15:35 38 ******************* 57 2023-10-26 15:36 39 ******************** ... ..( 3 skipped). .. ******************** 61 2023-10-26 15:40 39 ******************** 62 2023-10-26 15:41 38 ******************* ... ..( 5 skipped). .. ******************* 68 2023-10-26 15:47 38 ******************* 69 2023-10-26 15:48 35 **************** ... ..( 48 skipped). .. **************** 118 2023-10-26 16:37 35 **************** 119 2023-10-26 16:38 36 ***************** ... ..( 76 skipped). .. ***************** 196 2023-10-26 17:55 36 ***************** 197 2023-10-26 17:56 37 ****************** ... ..( 98 skipped). .. ****************** 296 2023-10-26 19:35 37 ****************** SCT Error Recovery Control: Read: 70 (7.0 seconds) Write: 70 (7.0 seconds) Device Statistics (GP/SMART Log 0x04) not supported Pending Defects log (GP Log 0x0c) not supported SATA Phy Event Counters (GP Log 0x11) ID Size Value Description 0x0001 2 0 Command failed due to ICRC error 0x0002 2 0 R_ERR response for data FIS 0x0003 2 0 R_ERR response for device-to-host data FIS 0x0004 2 0 R_ERR response for host-to-device data FIS 0x0005 2 0 R_ERR response for non-data FIS 0x0006 2 0 R_ERR response for device-to-host non-data FIS 0x0007 2 0 R_ERR response for host-to-device non-data FIS 0x0008 2 0 Device-to-host non-data FIS retries 0x0009 2 2 Transition from drive PhyRdy to drive PhyNRdy 0x000a 2 3 Device-to-host register FISes sent due to a COMRESET 0x000b 2 0 CRC errors within host-to-device FIS 0x000f 2 0 R_ERR response for host-to-device data FIS, CRC 0x0012 2 0 R_ERR response for host-to-device non-data FIS, CRC 0x8000 4 8835317 Vendor specific
-
FFS. I figured out the problem. I will leave this here incase it helps anyone else. I had to redo more ports for some reason. Everything was forwarded right but I had to delete them and re-enter them. I had to do the same when I port forwarded my download server. I guess something is wrong with my router?
-
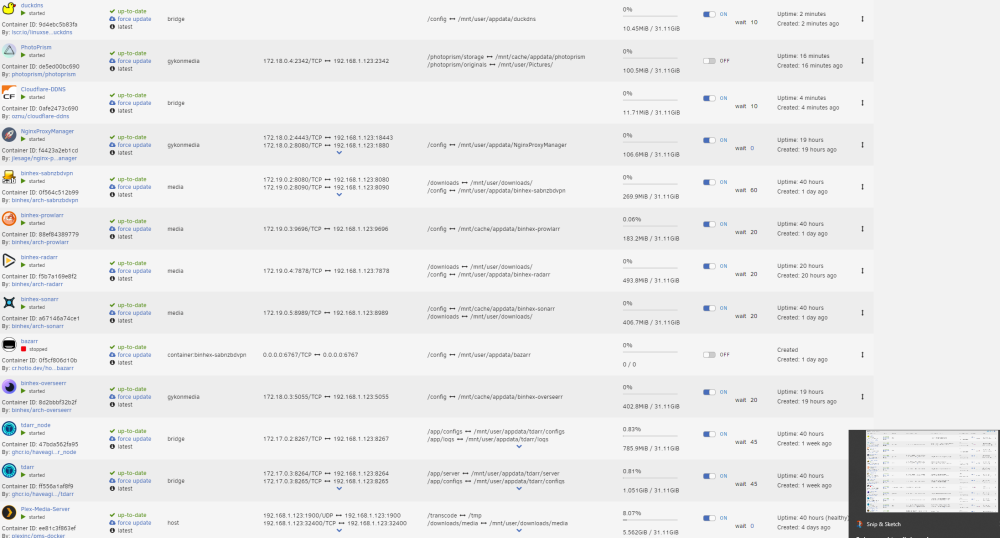
Alright Peoples, I cannot for the life of me to get my reverse proxies to work correctly. When I first step up the server, everything was fine. I was able to get to access some dockers via reverse proxy. Suddenly it stopped and I have 0 idea why. I tried to change the network settings on the docker themselves, but alas to no avail Here are my current network paths. I have the ports forwarded on my router. I have cloudfare CNAMEs made for all of the subdomains I want (plex, overseer, and photoprism) I have the A name with my personal IP. Side note, can you only get two SSL certs from lets encrypt? Wont let me cert my most recent sub domain. I have to believe cloudfare is configured correctly, as I have been able to access my minecraft server via the domain name. Please let me know what other info you need to help be diagnose this problem lyoton-diagnostics-20230116-1345.zip
-
Hello, First. Sorry for all the forum questions. This involves a few dockers but a more general inquiry first. First. For someone reason. I can connect the GUI through my router. However, I cannot see the device under attached devices in the router anymore. I feel like this may be causing a few other problems such as: Sabnzbd's download has plummeted from 50 MB/s to 3. I can no longer connect to my public domain plex server at plex.domain.io. this domain is reverse proxied but I can still connect to my overseer.domain.ip that is also reverse proxied. I can still connect through the plex app but I was under the impression that was router through the public domain. Could be very wrong there The two may be unrelated to my server not showing up in my router but I figured I would start there. Any thoughts? lyoton-diagnostics-20230111-1849.zip
-
One more question. Since the RMA process is likely going to take awhile. Which option is better. Move all data from the dying disk to the healthy disk? Then insert a new hdd? Or just confirm parity, shut down array, insert new hdd (do the pre clear) and rebuild parity? Im going to purchase another hdd as it is so either option is fine by me. Just dont know which is best.
-
Yeah. I ran one and attached to to the original post and everything came out clean
-
Aka. Needs replaced?
-
-
Maybe it is set up then. Parity check still has a bit to go but I woke up with 19 errors on the same disk. I swapped both the power and sata cables between disk 1 and 2. So either the physical connector on the hdd is bad. Or I am guessing something else is bad. Im leaning towards trying to get it replaced. I attached the new diagnostics lyoton-diagnostics-20230110-0712.zip
-
Not that many.... lol
-
Thanks! Running parity check. I swapped the sata cables on disk1/2 so ill know if something is up with that at least. All the connections seemed solid. Ill get back to you tomorrow with parity check results/ if there are any errors tomrrow.


