




-
I just noticed that you hardcoded it to a older version, is there a plan to update it soon?
-
ok, thanks for the clarification
-
And why can't i see this in for example htop?
-
What is the reason for this slowdown?
-
I think i found the problem. I moved the docker directory to a dedicated pool drive. Now this is not part of the array anymore and it runs fine
-
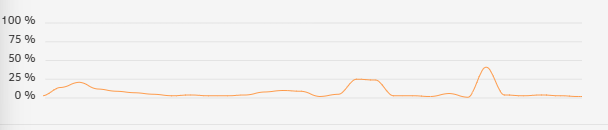
Okay, all containers are now stopped and i've started one of the smallest containers i have (homarr) The Usage immediately jumps up to 50%. Just for a short time but multiply this by 18 and it makes sense that there is such a high usage. But why is it like this? Under Proxmox with all containers enabled there were no performance issues at all. Even when i open the webpage of homarr in my browser i can see that there is a significant increase in usage in this graph.
-
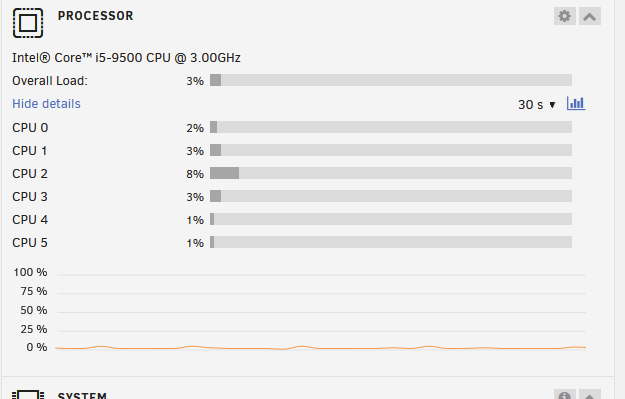
Seems like it does. I've deactivated docker now in Settings -> Docker. After that the usage pretty much goes to zero. What could cause this?
-
tower-syslog-20231012-1857.zip tower-diagnostics-20231012-2057.zip
-
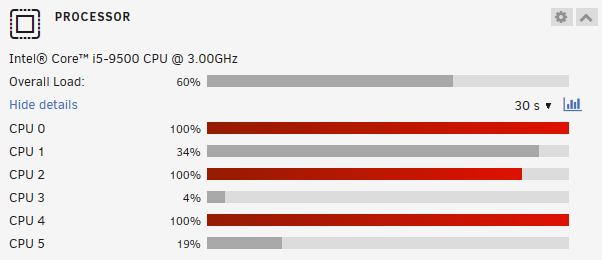
Hi, i have the problem that my unraid server becomes really unresponsive from time to time. The Processor view often shows all cores to be used by nearly 100%: But when i look into htop everything seems to be fine: I've ran Proxmox before on this server where i had no performance issues at all. Does anyone know what could cause this? Is it just caused by parity calculations? If thats the case, why can't i see them in htop or somewhere else? My system currently: OptiPlex 7070 Intel(R) Core(TM) i5-9500 32GB Ram DDR4 WD Blue SN570 2TB (Parity) Crucial BX500 2 TB (Disk) 18 Docker containers 2 Users Thank you


View in the app
A better way to browse. Learn more.
