





dhomas
Members
-
Joined
-
Last visited
Everything posted by dhomas
-
I've now passed 50% of the parity check and uptime of 17 hours. I think this is the longest it's gone since I started experiencing the issue. Maybe one of my docker containers (pihole was the only one active, but many others installed but not running) was causing the issue? I don't know how I would prove this, though. For now, I will let the parity check complete, then start reinstalling containers one at a time. Since I am quite new to unraid, I don't fully understand the repercussions of corrections during parity checks. So far, I have 13 corrections that show up in syslog like this: Feb 21 13:08:03 unDOM kernel: md: recovery thread: P corrected, sector=21475951712 Should I be concerned? I assume this is due to the forced shutdowns causing this?
-
CPU usage is normal right now. I might set up a crontab to export the results of the temp sensors every 5 minutes or so. Maybe pair it with a ps command to get CPU usage alongside it to cross-reference. I'd rather not install any additional plugins to do this right now, as I want to rule out that a plugin is causing the issue. But I'm open to suggestions.
-
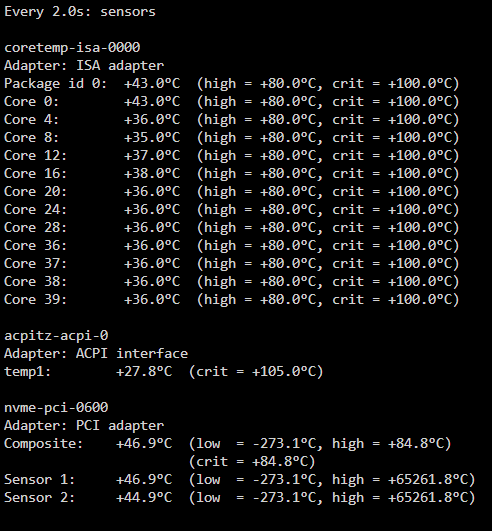
I don't think the temperatures are high, but I've removed the temperature plugin as a troubleshooting step so I cannot see it easily in the WebGUI. I can check via CLI the next time the issue occurs. Right now, they seem to be ok (see attached). I live in Montreal, Canada, where it is currently minus 13 degrees celsius and my NAS is in the basement where it doesn't get very hot. My larger (22TB, 16TB) disks do tend to get a little warm (about 50 degrees), but this generally only happens during high activity periods, like the parity check. Also, the system ran fine for quite some time. Two things have changed prior to me experiencing this issue: 1) I added a 14TB drive to the array, which is the first connected to the second banks of my HBA card; 2) I updated the motherboard BIOS to the most current version. When the CPU spikes, ahead of the issue occurring, the temps do indeed rise (I saw this in the BIOS upon a reboot), but I think this is due to the load. There is a possibility that I've got it backwards and that the load is high because the CPU is being throttled due to heat. I will monitor this the next time the issue occurs. For the time being, after deleting all docker instances and performing a clean reboot, the system is running correctly for over 13 hours. The parity check has gotten further than it has previously, too, at 40%. Is there anything I should be looking for in the logs? I realize I dumped a lot of info in my previous messages, but I was trying to give a play-by-play of what was happening, if even for my own benefit. Thanks again for your help!
-
So, I let the system sit unpowered for some time. Then, I booted it. I let it start, stopped and uninstalled all docker images. Rebooted. Ran diagnostics. Started parity check again. Hopefully it completes this time. The previous parity checks had found a few errors, due to the multiple unclean shutdowns I suppose. undom-diagnostics-20240220-2002.zip
-
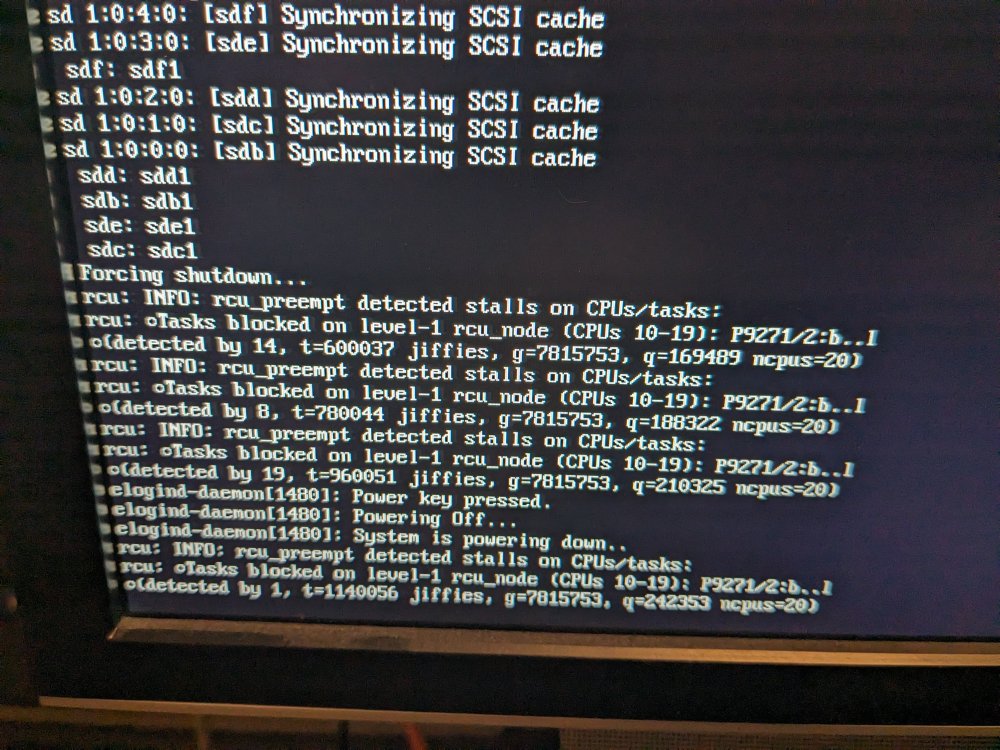
So, I pressed the power button without long-pressing it. The screen I had attached sprung to life, despite not responding to keyboard presses earlier. I attached a photo. The system is now off. I'm going to let it cool down then turn it back on and send diagnostics.
-
I tried to run the shutdown command: powerdown -r, which might be deprecated, so then just poweroff. It seems to be having trouble even turning off. I do have an updated syslog file, though. The system has not shut down, now about 10 minutes after sending the command via CLI. The shares are still accessible. Parity-check had already stalled when I noticed the CPU spike. I'm just about to long-press the power button. When I boot back up, I will send a proper diagnostics file. Regards, Dom syslog-192.168.50.42-final.log
-
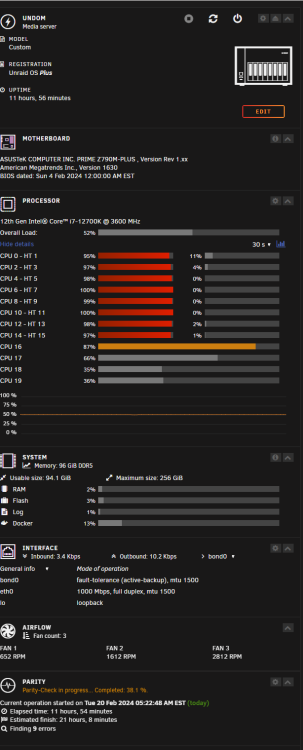
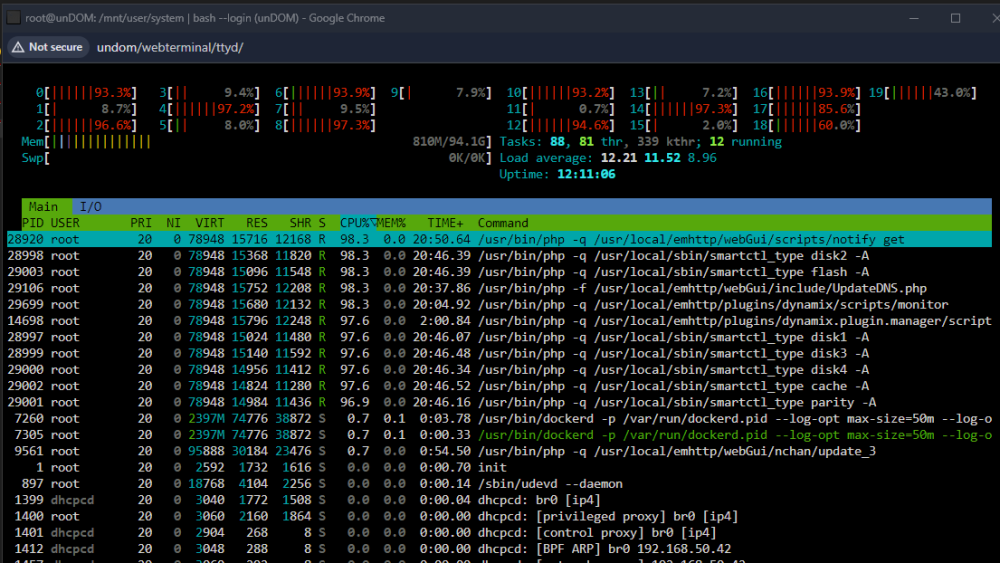
So it looks like it's about to happen again. I'm trying to see what is causing the issue, as it happens. All of a sudden, my unraid server just goes nuts using CPU. It's not doing anything other than a parity check. No one is reading files from it and I am not transfering anything to the server. Syslog says nothing at all. But I ran a ps command and it looks like notify, smartctl_type, php, and monitor are taking a lot of CPU. I will wait and see if it recovers, though it hasn't every other time. Eventually, it becomes inaccessible. I have no idea what changed. Edit: adding syslog for good measure. I tried to run Diagnostics from the WebGUI and via CLI, but both hung. I've also included a screenshot of htop (I opened a terminal session before the WebGUI became unresponsive). Thanks for any help! Dom pscpu.log syslog-192.168.50.42.log
-
Ah, got it. Thanks for that! I now see a syslog-<IP>.log appearing in the folder. Like I said, I'm still relatively new to unraid, so I appreciate the guidance.
-
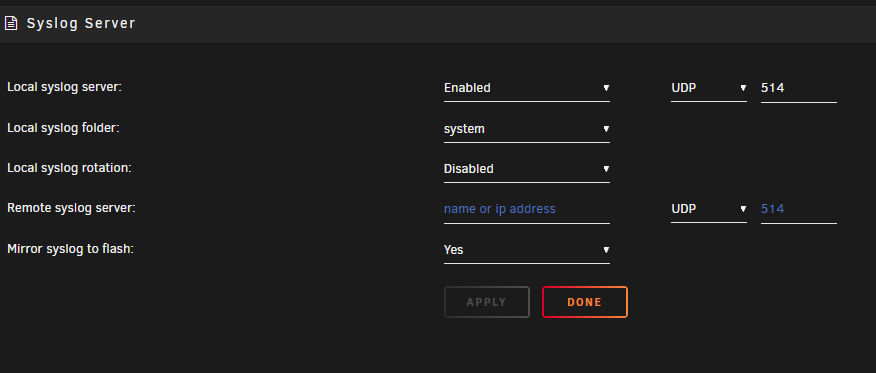
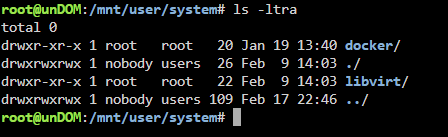
Thanks! I thought syslog was already logging, but I see now that it needs to be setup in the settings. I've now enabled it and will report back on the next crash. Edit: I set my syslog server to write to system/, but when I check the share, no new files or folders are created. Should I see something there? Cheers! Dom
-
Hello there! I am still relatively new to unraid. I've built a machine that has worked quite well up until recently. I've been moving terabytes of data to it from a different NAS solution (Drobo 5N2), and everything was going quite well. Then this past week, unraid has started to lock up. First the GUI would be inaccessible, but SSH would still work. Finally, it would eventually crash completely and I would need to perform a hard shutdown from the power button. Here are some troubleshooting steps I've taken: I shut down all docker containers. I performed a 4 pass memtest86 from a standalone USB stick, which has passed. I also ran my BIOS NVMe disk test, which also passed. I read in another thread that another user was having issues with Dynamix System Temp plugin, so I removed it from my system (I don't think I had the right drivers for it anyway, as I could show my CPU temp but not my motherboard temp). I'm not sure what to do next. It doesn't even stay on long enough to complete a Parity Check due to repeated unclean shutdowns, so I'm concerned about my data integrity. The last time it crashed, it stayed on for about 24 hours, I think. I've included diagnostics here. Thanks for any advice! Regards, Dom undom-diagnostics-20240220-0529.zip
-
I'm new to unRAID. I'm migrating away from a Drobo 5N2 NAS. I guess I was looking for something Drobo's Capacity Calculator, as seen here: https://www.drobo.com/storage-products/capacity-calculator/ Looks like I won't need it, though. Thanks for the advice!
-
The site in the solution, https://unraidcalculator.com/, seems to no longer be functional.



