WannabeMKII
Members-
Posts
204 -
Joined
Converted
-
Gender
Undisclosed
Recent Profile Visitors
The recent visitors block is disabled and is not being shown to other users.
WannabeMKII's Achievements
Explorer (4/14)
2
Reputation
-
Fix Common Problems - Parity has read errors
WannabeMKII replied to WannabeMKII's topic in General Support
Perfect, many thanks! 👍 -
Fix Common Problems - Parity has read errors
WannabeMKII replied to WannabeMKII's topic in General Support
OK, I've added '1,200' under SMART attribute notifications. I assume I'll get a message if the numbers change? Is that how it works? -
Fix Common Problems - Parity has read errors
WannabeMKII replied to WannabeMKII's topic in General Support
Many thanks for the info. I'll keep an eye on the raw value. Is there a way to set an alert if this number is to increase? -
Fix Common Problems - Parity has read errors
WannabeMKII replied to WannabeMKII's topic in General Support
Extended test report attached. Does this help diagnose? WDC_WD40EFRX-68WT0N0_WD-WCC4E2ND35EL-20201202-1141.txt -
Fix Common Problems - Parity has read errors
WannabeMKII replied to WannabeMKII's topic in General Support
Thanks for the steer. I’ve started the extended test and will post the results when it’s finished. Assume it’s the same log file? -
Fix common problems is reporting that my parity drive is reporting read errors - Drive log attached. I've been an UNRAID user for 4 years now and love it, but this is the first time I've had a potential disk error. Would someone be able to check the log file for the drive please? If more info is needed, please let me know. If it is a potential drive failure, what are the correct steps to take to resolve? Many thanks. WDC_WD40EFRX-68WT0N0_WD-WCC4E2ND35EL-20201201-1729 parity (sdd).txt
-
[Support] for atribe's repo Docker images
WannabeMKII replied to atribe's topic in Docker Containers
Just a quick update from my side, but totally out of the blue, the graphs have all updated? A few dockers have updated over the last few days and I hadn't checked before now, but great to see all the data populating! -
[Support] for atribe's repo Docker images
WannabeMKII replied to atribe's topic in Docker Containers
Ouch, that sounds complicated. I'm hoping there's a more 'straightforward' solution... -
[Support] for atribe's repo Docker images
WannabeMKII replied to atribe's topic in Docker Containers
The old one I did, but this one I don't. If I add it, it now lets the docker start, but the charts don't update and I still see this in the logs; -
Sorry, didn't think to post across there. I've done that now, so please feel to delete this thread. Many thanks.
-
[Support] for atribe's repo Docker images
WannabeMKII replied to atribe's topic in Docker Containers
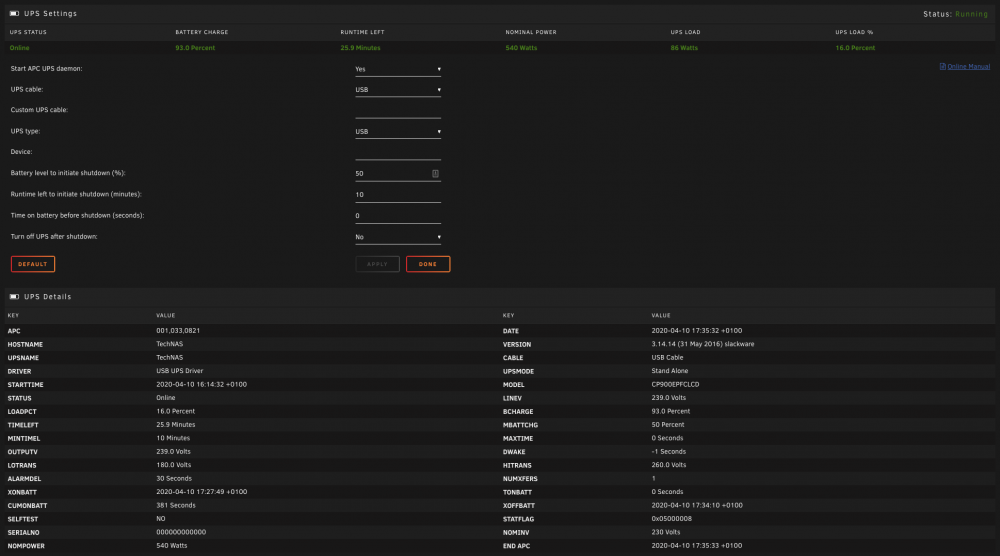
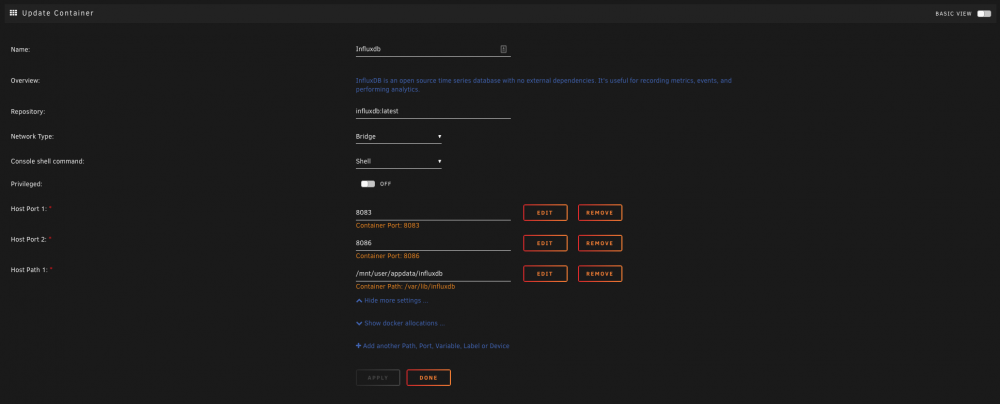
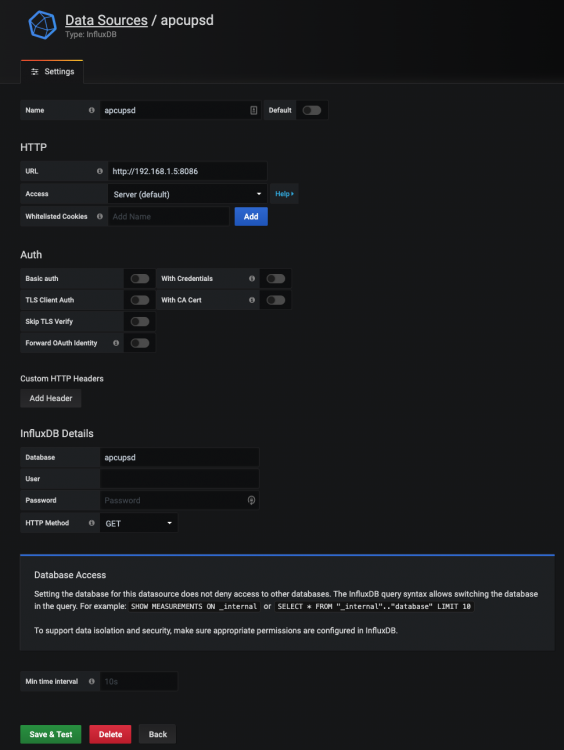
I've just replaced my UPS and the new UPS provides information that the old one didn't so Grafana should be more accurate. For example, nompower, loadpct, timeleft etc. However, something isn't quite right, as Grafana is actually reporting less and I'm thinking it's something to do with apcupsd still reporting the old information from the old UPS and not updating Influx with the new information? I've added a number of screenshots from what apcupsd shows, Grafana, Influx set up, Influx data sources and if I remove the nompower from the apcupsd-influx-exporter (this UPS reports nompower, the old on didn't), the log file. Can anyone assist please? Many thanks and stay safe! -
I've just replaced my UPS and the new UPS provides information that the old one didn't so Grafana should be more accurate. For example, nompower, loadpct, timeleft etc. However, something isn't quite right, as Grafana is actually reporting less and I'm thinking it's something to do with apcupsd still reporting the old information from the old UPS and not updating Influx with the new information? I've added a number of screenshots from what apcupsd shows, Grafana, Influx set up, Influx data sources and if I remove the nompower from the apcupsd-influx-exporter (this UPS reports nompower, the old on didn't), the log file. Can anyone assist please? Many thanks and stay safe!
-
Quick update as I've managed to get it back up and running. Basically, I removed the container along with the appdata folder and started again. On starting again from scratch, everything is now back up and running! Many thanks for the help offered, appreciated!
-
Thanks for coming back. I've just deleted one of the SSL certificates and tried to re-create it and it came back with an 'internal error'? What else can I try?
-
Alternatively, is there a way I can create a new one?


