ssh
Members
-
Joined
-
Last visited
-
I recently bought a new WD Red Pro - same model as before - and this one also didn't show up on the H310 PERC. Then I tried a different SATA connector (same breakout cable, same RAID card) and the drive did show up. The older 3TB drives I have do show up fine, even on the connector/port that doesn't work for the new WD Red Pro. I'm suspecting a faulty cable (maybe the 3TB drives are more forgiving than the more performant 8TB Pros), so I've ordered a new breakout cable (which I have yet to receive). I've connected the WD 8TB Red Plus again which 1 year ago was showing current pending sectors of 72 and which I then replaced. A pre-clear cycle on the drive reset the current pending sectors to 0, while leaving the reallocation events and reallocated sectors both at 0. Could a faulty cable have caused the pending sectors and would the drive maybe not be dying yet?
-
Correct. I've left the SATA power plugged in and the harddrive in the same "tray". Only switched the cables. I did notice that the firmware of my H310 is from 2015, so I wonder if it's an incompatibility with the newer "advanced" firmware on the WD Red Pro drives.
-
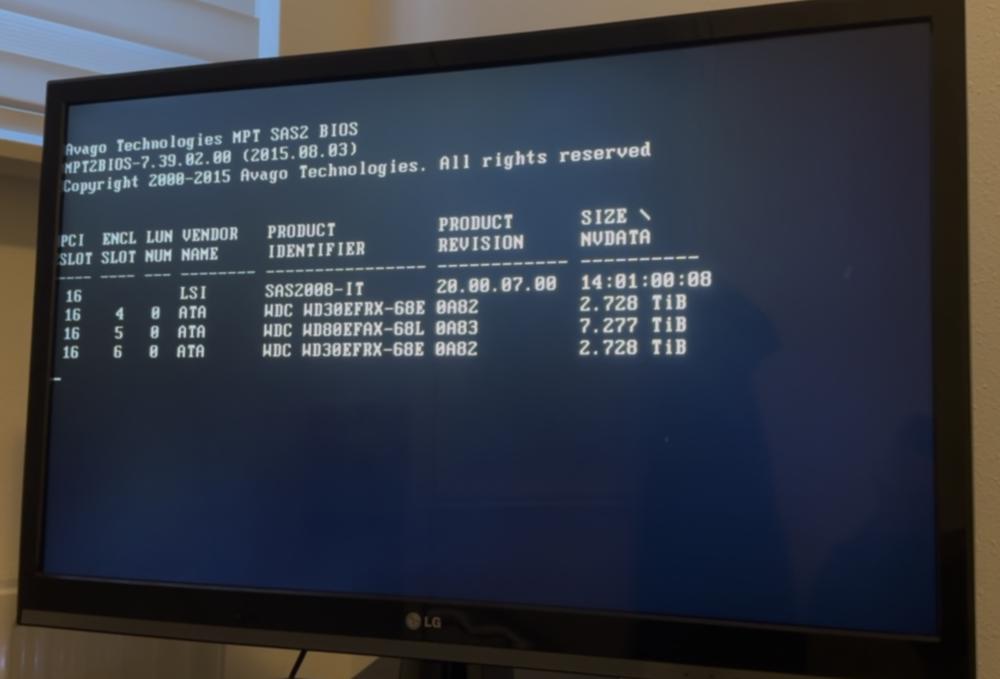
I've just tried again, still no luck. Hooked up a monitor to the server during the boot process and the HDD isn't listed in the list of devices when the SAS controller initializes. The other WD Red drives (2x WD30EFRX, 1x WD80EFAX) initialize just fine.
-
Thanks for your answers. I've installed the newly ordered WD Red Pro drive in the system and I'm rebuilding parity on it. I'll try a preclear on the drive that is showing pending sectors just for science really. Interestingly at first the WD Red Pro didn't show up in Unraid as unassigned drive when I connected it to the port where the old drive was previously. When I connected it to a different port it did show up. The first port is on a H310 Dell Perc HBA (IT mode) where as the 2nd port I tried is a SATA port on the motherboard. Is there a chance that the H310 doesn't support (newer) WD Red Pro drives?
-
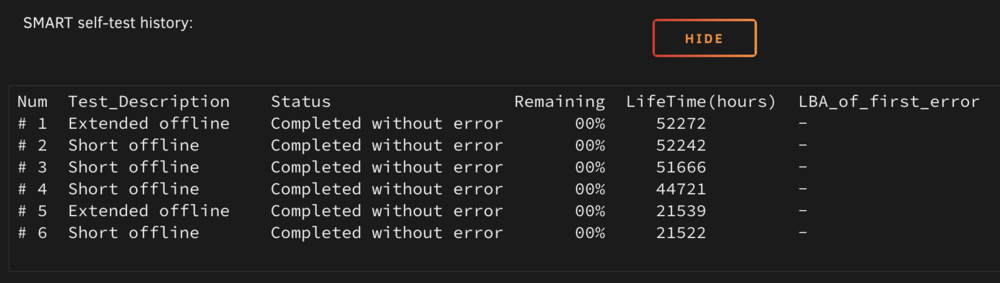
I've ran a SMART extended self-test which completed fine. The "current pending sector" count didn't reset and is still at 72, but the "raw read error rate" is back at 0. Would it be recommended to still replace this disk? shadow-diagnostics-20250103-1423.zip
-
On December 31st (during a parity check) I got an email from my Unraid server that the parity drive threw errors. The "current pending sector" increased in steps from 0 to 72. The Unraid "main" page shows 853 errors with the disk. The "CRC error rate" is 1, but it has been for a long time (I think this was due to a bad SATA cable which has since then been replaced). The "raw read error rate" went up to 7 million, but is now back to 0. To me these values of the SMART attributes sound like the drive is on its way out. I've already bought a new harddrive which should arrive in the next two days and I'll replace this drive with errors (the parity drive) with the new one. I'm wondering how the parity check itself finished with 0 errors if there are pending sectors on the drive and lots of read errors? Also, what would be the best way of replacing this drive. Turning off the machine, swapping hdd with the new one, turning it back on and recalculating the parity? shadow-smart-20250102-1421.zip
-
I have basically been getting the following error log message in my syslog for I can't remember how long. Just wondering if there is anything I can (or should) do about it? The error always occurs during the scheduled maintenance I've configured for Plex (4AM-8AM daily). Jun 17 04:38:25 Shadow kernel: Plex Media Scan[4616]: segfault at 0 ip 00001494512fc4fd sp 00007ffd50e675f0 error 4 in libavcodec.so.58[1494512ca000+292000] Jun 17 04:38:25 Shadow kernel: Code: 41 56 41 54 53 0f 57 c0 0f 11 46 20 0f 11 46 10 0f 11 06 48 c7 46 30 00 00 00 00 8b 6f 10 48 8b 17 89 e9 48 89 e8 48 c1 e8 03 <8b> 04 02 0f c8 80 e1 07 d3 e0 8d 4d 10 8b 57 18 c1 e8 f0 39 ca 0f Jun 18 05:57:44 Shadow kernel: Plex Media Scan[29552]: segfault at 0 ip 0000145664ffd4fd sp 00007ffc26983900 error 4 in libavcodec.so.58[145664fcb000+292000] Jun 18 05:57:44 Shadow kernel: Code: 41 56 41 54 53 0f 57 c0 0f 11 46 20 0f 11 46 10 0f 11 06 48 c7 46 30 00 00 00 00 8b 6f 10 48 8b 17 89 e9 48 89 e8 48 c1 e8 03 <8b> 04 02 0f c8 80 e1 07 d3 e0 8d 4d 10 8b 57 18 c1 e8 f0 39 ca 0f Jun 19 04:08:04 Shadow kernel: Plex Media Scan[28061]: segfault at 0 ip 0000153f40b7b4fd sp 00007fff647c3320 error 4 in libavcodec.so.58[153f40b49000+292000] Jun 19 04:08:04 Shadow kernel: Code: 41 56 41 54 53 0f 57 c0 0f 11 46 20 0f 11 46 10 0f 11 06 48 c7 46 30 00 00 00 00 8b 6f 10 48 8b 17 89 e9 48 89 e8 48 c1 e8 03 <8b> 04 02 0f c8 80 e1 07 d3 e0 8d 4d 10 8b 57 18 c1 e8 f0 39 ca 0f Jun 20 04:08:08 Shadow kernel: Plex Media Scan[20383]: segfault at 0 ip 0000152cd7f444fd sp 00007ffc886db4b0 error 4 in libavcodec.so.58[152cd7f12000+292000] Jun 20 04:08:08 Shadow kernel: Code: 41 56 41 54 53 0f 57 c0 0f 11 46 20 0f 11 46 10 0f 11 06 48 c7 46 30 00 00 00 00 8b 6f 10 48 8b 17 89 e9 48 89 e8 48 c1 e8 03 <8b> 04 02 0f c8 80 e1 07 d3 e0 8d 4d 10 8b 57 18 c1 e8 f0 39 ca 0f Jun 21 04:11:38 Shadow kernel: Plex Media Scan[17870]: segfault at 0 ip 0000148fc03224fd sp 00007fff2f9837c0 error 4 in libavcodec.so.58[148fc02f0000+292000] Jun 21 04:11:38 Shadow kernel: Code: 41 56 41 54 53 0f 57 c0 0f 11 46 20 0f 11 46 10 0f 11 06 48 c7 46 30 00 00 00 00 8b 6f 10 48 8b 17 89 e9 48 89 e8 48 c1 e8 03 <8b> 04 02 0f c8 80 e1 07 d3 e0 8d 4d 10 8b 57 18 c1 e8 f0 39 ca 0f Jun 22 04:08:02 Shadow kernel: Plex Media Scan[3855]: segfault at 0 ip 0000148c070174fd sp 00007ffca8d24060 error 4 in libavcodec.so.58[148c06fe5000+292000] Jun 22 04:08:02 Shadow kernel: Code: 41 56 41 54 53 0f 57 c0 0f 11 46 20 0f 11 46 10 0f 11 06 48 c7 46 30 00 00 00 00 8b 6f 10 48 8b 17 89 e9 48 89 e8 48 c1 e8 03 <8b> 04 02 0f c8 80 e1 07 d3 e0 8d 4d 10 8b 57 18 c1 e8 f0 39 ca 0f Jun 23 04:12:40 Shadow kernel: Plex Media Scan[21991]: segfault at 0 ip 00001537100214fd sp 00007ffc70a78cf0 error 4 in libavcodec.so.58[15370ffef000+292000] Jun 23 04:12:40 Shadow kernel: Code: 41 56 41 54 53 0f 57 c0 0f 11 46 20 0f 11 46 10 0f 11 06 48 c7 46 30 00 00 00 00 8b 6f 10 48 8b 17 89 e9 48 89 e8 48 c1 e8 03 <8b> 04 02 0f c8 80 e1 07 d3 e0 8d 4d 10 8b 57 18 c1 e8 f0 39 ca 0f Jun 24 04:15:51 Shadow kernel: Plex Media Scan[22382]: segfault at 0 ip 000014dbd254b4fd sp 00007fff70a65340 error 4 in libavcodec.so.58[14dbd2519000+292000] Jun 24 04:15:51 Shadow kernel: Code: 41 56 41 54 53 0f 57 c0 0f 11 46 20 0f 11 46 10 0f 11 06 48 c7 46 30 00 00 00 00 8b 6f 10 48 8b 17 89 e9 48 89 e8 48 c1 e8 03 <8b> 04 02 0f c8 80 e1 07 d3 e0 8d 4d 10 8b 57 18 c1 e8 f0 39 ca 0f
-
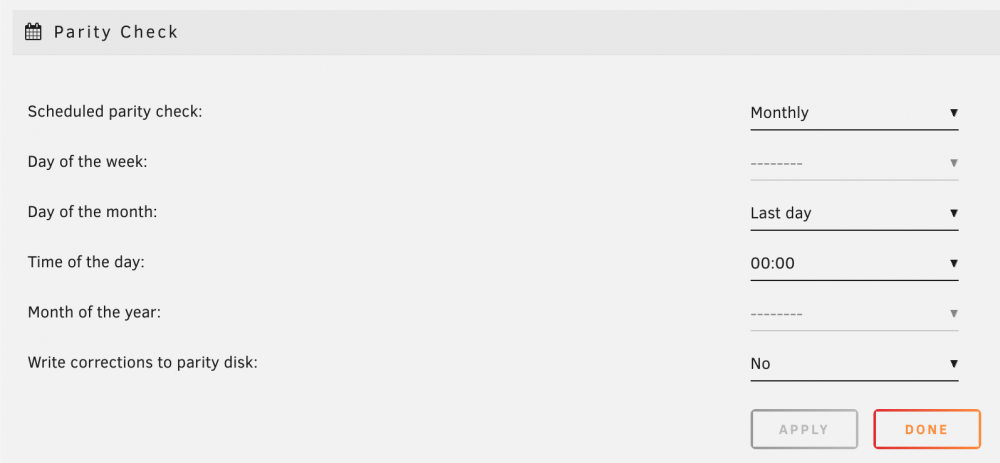
I have my parity check scheduled to run on the last day of each month at 0:00. This always ran fine (for multiple years), except for today when it suddenly did not. It didn't start at 0:00. I've waited till 01:05, but it never started. Looking at the root file in /etc/cron.d it shows that "the last day of the month" is calculated as follows: [[ $(date +%e -d +1day) -eq 1 ]]. I suspect this to be an issue with the fact that today is the day when daylight saving time ends, as 31st 0:00 + 1 day will probably result in 31st 23:00, getting just the day value of that is 31 which is not equal to 1, so the cron job results in false and won't run.
-
Okay, thanks Just for my curiosity; does that scale with the total disk size?
-
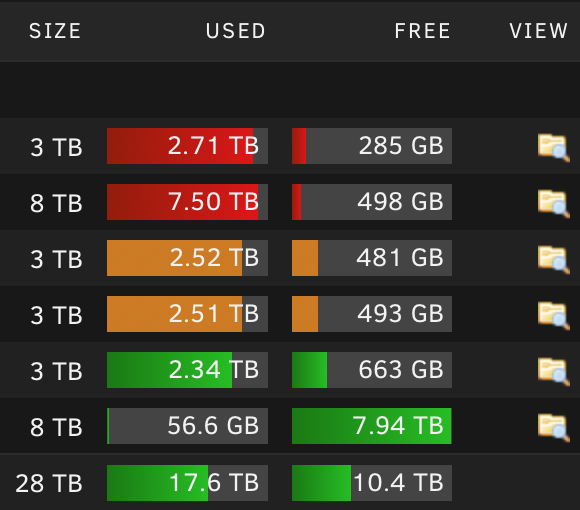
Just installed a new WD 8TB RED WD80EFAX hdd in my system. Ran a preclear (zeroing) with the preclear plugin. Stopped the array, added the new disk to the array, started the array, formatted the new disk (as xfs). The overview now shows that 56GB of the 8TB of that new disk is used. Investigating the disk with the terminal shows it contains 1 folder with 16 small files (between 1 and 250KB in size). I know there always is some os overhead, sure. But 56GB? What could be going on here?