


CJW
Members
-
Joined
-
Last visited
-
Just for an extra bit of fun, the debugging output in gitlab-rails/application_json.log grew to 250G overnight and maxed my cache drive.
-
I used to have GitLab-CE running fine. Then the big update that changed the storage backend broke things. I spent a while fiddling with that but eventually decided to say screw it and start fresh. All my repos are copied to github, as well, so I didn't lose any data. So, starting with a completely fresh install of the GitLab-CE docker v16.7.0, things seemed to work. Got it installed, got root set up, added a regular user, had the user add a blank repo and an SSH key that I validated with a simple ssh command to connect. I just can't push or clone anything. Every attempt to interact with the GitLab instance fails with "remote: Internal API unreachable" on the command line. I don't know jack about how this software works. It's too complicated. But poking around in the logs I see things that make no sense on a clean install that shows no health issues in the Monitoring tab. The following line shows up multiple times whenever I do a push/clone operation: [puma/puma_stderr.log] 2023-12-27 23:17:46 +0000 Rack app ("GET /api/v4/internal/allowed" - (127.0.0.1)): #<ThreadError: deadlock; recursive locking> Error reached top of thread-pool: stack level too deep (SystemStackError) Anybody got any ideas? I've about had it with the "improvements" to this container. Something that used to "just work" has now become an aggravating time suck. Thanks.
-
CJW changed their profile photo
-
SOLVED: Got some help from phobos on Discord. I am using SQLIte3 and somehow the sync database (/data/owncloud.db-shm) got chown'ed to root, so the nextcloud user couldn't perform db transactions. A simple 'chown abc:abc' on the offending file fixed it. -------------------- I am suddenly having problems with my NextCloud container v27.0.2. The GUI keeps throwing Internal Server Errors, and the log is filled with variations on the following error: PDOException: SQLSTATE[HY000]: General error: 8 attempt to write a readonly database in /app/www/public/3rdparty/doctrine/dbal/src/Driver/PDO/Statement.php:101 Stack trace: #0 /app/www/public/3rdparty/doctrine/dbal/src/Driver/PDO/Statement.php(101): PDOStatement->execute() #1 /app/www/public/3rdparty/doctrine/dbal/src/Connection.php(1155): Doctrine\DBAL\Driver\PDO\Statement->execute() #2 /app/www/public/lib/private/DB/Connection.php(295): Doctrine\DBAL\Connection->executeStatement() #3 /app/www/public/3rdparty/doctrine/dbal/src/Query/QueryBuilder.php(354): OC\DB\Connection->executeStatement() #4 /app/www/public/lib/private/DB/QueryBuilder/QueryBuilder.php(280): Doctrine\DBAL\Query\QueryBuilder->execute() #5 /app/www/public/lib/private/AppConfig.php(332): OC\DB\QueryBuilder\QueryBuilder->execute() #6 /app/www/public/lib/private/AllConfig.php(227): OC\AppConfig->deleteKey() #7 /app/www/public/lib/base.php(751): OC\AllConfig->deleteAppValue() #8 /app/www/public/lib/base.php(1180): OC::init() #9 /app/www/public/cron.php(43): require_once('...') #10 {main} The variations are different PHP source files hitting the readonly database, but the error is always the same. Can anybody tell me what I need to do to fix this? Thanks.
-
I realize this may not exactly be an Unraid question, but I am asking it in case other Unraid users have dealt with something similar. I have about 8 docker containers on a custom network with static IPs on my local LAN. The Unraid server and some of the containers are reachable (web browser, netcat, ping, &c.). Others, though, are timing out in the browser and showing "Destination host unreachable" to netcat or lost packets to ping. All of the containers are visible to a VM running on the unraid server, so the routing only seems to be a problem from elsewhere on the LAN. Any ideas? Thanks.
-
I just installed :latest today on 6.8.0-rc5 (WireGuard installed but not configured or running) and am having problems similar to above---no Web UI, and my Unifi Android App can't see the controller. I have tried both Bridge and br0 with a dedicated IP address. Same issues with :LTS. I tried netcat on the exposed ports. There's something listening on 8080 and 8880, but it doesn't respond to HTTP. Connection is refused on 8081, 8443, 8843, and 10001. The log has a couple of errors in it. The first appears to to be logging related, but the second is an IO error that might be more relevant.
-
Did a scrub and didn't find any errors. I do have a few orphaned containers (different versions of nextcloud and pihole that I have played with), but since they aren't running they shouldn't be growing either, correct? I am growing the image about 1% per day.
-
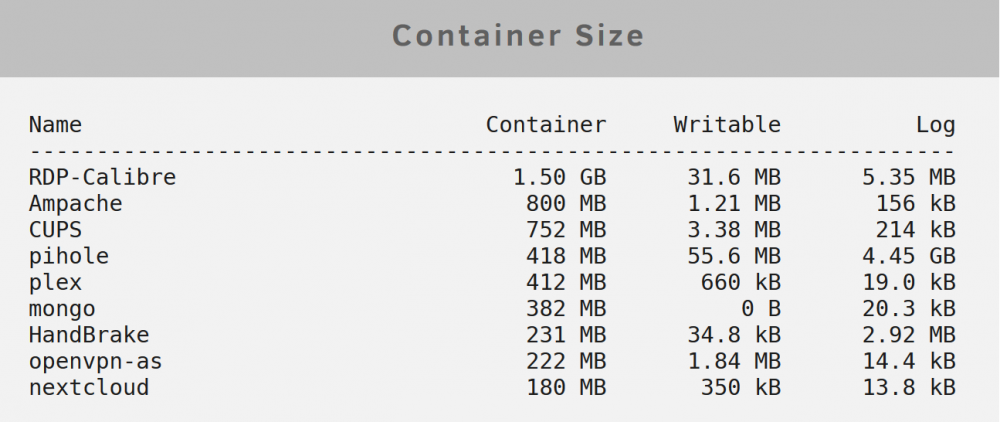
Just ran it, and got similar results (this is several days newer than the previous screenshot): Ampache Size: 1.4G Logs: 78.0kB CUPS Size: 732M Logs: 367.0B HandBrake Size: 252.7M Logs: 112.6kB mongo Size: 355M Logs: 20.7kB nextcloud Size: 186M Logs: 2.7kB openvpn-as Size: 209M Logs: 13.0kB pihole Size: 483M Logs: 2.7GB plex Size: 400M Logs: 4.1kB RDP-Calibre Size: 1.4G Logs: 3.1MB Now, the script did take quite a while to churn out the pihole entry...but that could just be counting log size. I really suspect that pihole is the culprit, but I have no idea where the extra storage usage could be.
-
I am still looking at the same problem. I have a 40GB docker.img, and I am getting high usage warnings. As of a couple of days ago, I was getting usage warnings of 33GB and I took the attached screenshot. This adds up to no more than 10GB, even with nearly 5GB log usage on pihole. None of my writables are big. There is no diagnostic information I have yet found that comes close to identifying 30+GB of docker usage, so I have no idea what to fix. I have repeatedly verified all my path mappings, I have run in-container disk usage analytics, and I have run docker container usage analytics. I still have over 20GB of reported usage that is completely unaccounted for by any method available to me.
-
I asked this earlier in this thread, but I will ask again: How can one determine which container is causing the excessive usage? I have used the "docker images" command and all the images together add up to less than 6GB, while unRAID is telling me that I am at 83% usage (33GB) of my 40GB docker image. I have bashed into each and every container I use and run "du -shx /" to get a usage report on the root (meaning docker.img loop) partition, and the sizes agree with the "docker images" output. So how exactly am I supposed to troubleshoot this 33GB image usage when all the diagnostics available to me are telling me that I am only using 6GB? Thanks.
-
Sometime in the last day or two, my NextCloud instance has stopped working. Desktop clients can't connect and the web UI comes up with a blank page. The only feedback I am seeing is "500 Internal Server Error" through the desktop clients or when manually mounting the share via DAVFS to a linux box (even with verbose turned on). Nothing shows up in the main docker container log, and when I shell into the container I am finding nothing in the nginx error log and nothing in the php logs. I use NextCloud a lot and this is quite troublesome. I appreciate any help or any suggestion on where to look for additional error information. Thanks!
-
Well, better too much answer than not enough. Good luck!
-
Was that question to me? You can change the target version in the "Edit" page (where you set up all your parameters). The default container is "diginc/pi-hole:latest" (I think—I am not looking at the unraid screen right now—but the ':latest' part is the tag we want to change). To find the available tags, you go to the docker bug page for the container. That's in an earlier post in this thread, and can be found off the Community Applications listing for any given container. In this case, it is https://hub.docker.com/r/diginc/pi-hole/. So, go to that page and click the "Tags" nav link at the top. Based on the change dates, I figured out that ':latest' must refer to ':debian_v3.3.1' (or newer) and that the version I was running prior to the last update had to be ':debian_v3.3'. Last step is to edit the container, change the ':latest' tag to the ':debian_v3.3' tag and click Apply. The container will reinstall based on the older version. I guess I will follow newer releases and try them every once in while to see if the problem is solved. In the meantime, v3.3 seems to work well enough for me.
-
I have manually downgraded to the debian_v3.3 tag and I no longer have sudden crashes. I don't know what the problem is with later versions, but I have had the same problem (crashing after only a couple of minutes) with v3.3.1, v3.3.1-1, and prerelease,
-
Also having problems after the last update, with pihole docker quitting shortly after startup. ETA: During the brief period it is up, I have thrown several dig queries at it ('dig google.com @pihole') and the resolve just fine, so I am not sure what the "DNS resolution is currently unavailable" error means. Here are the logs:
-
Based on the earlier info in this thread, I did read the FAQ and look into those issues. None of my dockers should be downloading anything that I am aware of (no torrent or TV clients or the like); I have not transcoded anything in Plex and I have my /transcode directory mapped from the array, anyway; and the reason I bashed into each running container was to look at the virtual filesystems for any signs of excess logging. My understanding—and, please, correct me if I am wrong—is that those logs would show up in the container filesystem. So, if the container logs are not stored in "[CONTAINER]%/var/log", how do I find out what may be doing excessive logging?


