Scythe
Members
-
Joined
-
Last visited
Everything posted by Scythe
-
Been trying to use DelugeVPN for the first time on my Unraid box but I'm running into issues. Upon first trying to load the container I kept getting the error: Options error: --status fails with '/tmp/openvpn/openvpn-status.log': No such file or directory (errno=2) Options error: Please correct these errors. I resolved this by jumping in via terminal and manually creating the above log file. Now it appears like the launch sequence completes successfully but I can't seem to access the web UI. Here's my supervisor log for the launch after creating the openvpn-status.log file. To confirm I'm trying to load the admin UI (10.1.1.142:8112) from a computer within the network (10.1.1.14) and I'm getting a connection refused error.
-
It's only an i3 CPU (Just running a NAS box with some docker containers for managing content/smart home). Every time I've had this 100% CPU issue it seems to take up to 2-3 hours to clear out and return to normal. Ram wise I know I only have 4GB and I do plan on upping this to 8GB but from what I was seeing in the UI I didn't think I was actually hitting on the RAM limit just yet with what was running. I've included my diagnostics below if that helps. tower-diagnostics-20181110-0041.zip
-
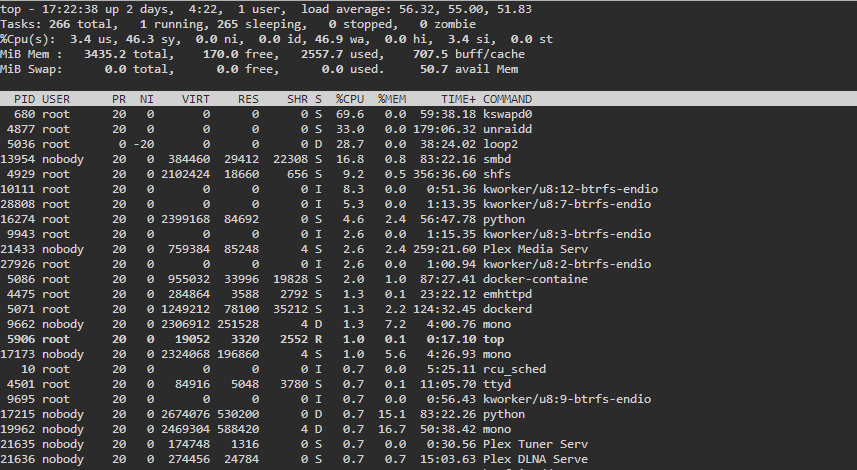
I'm trying to get to the bottom of an issue where unraid seems to get stuck at 100% CPU usage semi-regularly. What's odd is that the unraid main screen shows 100% CPU usage across all cores while the Dynamix System Stats plugin only seems to show 50% usage. Opening a terminal and running top shows that the CPU usage seems to be coming from 3 main processes: kswapd0, unraidd & loop2. What are the kswapd0 and loop2 processes? Should they be using this much CPU? Can they be safely killed/restarted?