


cmeyer86
Members
-
Joined
-
Last visited
-
Confirmed fixed on Unraid with v2.38.1. Version: version=2.38.1 gitHash=7c0f01a4 committedAtCET=25.06.26, 11:41:13 Env: WATCH_POLL_INTERVAL_MS=60000 UV_THREADPOOL_SIZE=4 Diagnostics: Horror: effectiveIntervalMs=60000, intervalSource=env, computedStatsPerSec=12 Serien_Kinder: effectiveIntervalMs=60000, intervalSource=env, computedStatsPerSec=191 Serien: effectiveIntervalMs=60000, intervalSource=env, computedStatsPerSec=147 So diagnostics estimates about: ~350 stats/sec 10s strace after v2.38.1: % time seconds usecs/call calls errors syscall ------ ----------- ----------- --------- --------- ---------------- 43.57 1.037159 97 10610 statx 33.56 0.798994 43 18397 3770 futex 7.26 0.172810 13 13211 epoll_pwait 1.82 0.043368 6 6467 read 1.62 0.038540 5 6468 write That is: 10,610 statx / 10s ~1,061 statx/sec Before v2.38.1 with the same WATCH_POLL_INTERVAL_MS=60000, this was: 591,930 statx / 10s ~59,193 statx/sec So the statx rate dropped by roughly 56x. The remaining rate is still above the diagnostics estimate, but the original binaryInterval poll storm is clearly gone.
-
WATCH_POLL_INTERVAL_MS=60000 is now definitely active and diagnostics confirms it. Env: WATCH_POLL_INTERVAL_MS=60000 UV_THREADPOOL_SIZE=16 Diagnostics: Horror effectiveIntervalMs=60000 intervalSource=env computedStatsPerSec=12 Serien_Kinder effectiveIntervalMs=60000 intervalSource=env computedStatsPerSec=191 Serien effectiveIntervalMs=60000 intervalSource=env computedStatsPerSec=147 So diagnostics now expects roughly: ~350 stats/sec But the real 10s strace sample is still essentially unchanged: % time seconds usecs/call calls errors syscall ------ ----------- ----------- --------- --------- ---------------- 70.71 300.249783 507 591930 statx 26.19 111.215596 243 456980 94509 futex 1.38 5.865397 34 170438 epoll_pwait 0.90 3.837793 35 107325 read That is still around: 591,930 statx calls / 10s ~59,000 statx/sec So the actual syscall rate is about 169x higher than the diagnostics estimate. The earlier path trace showed these statx calls are still coming from /media/..., including video and artwork/metadata files across all watched shares: /media/Horror/...fanart.jpg /media/Horror/...clearart.png /media/Horror/...poster.jpg /media/Serien/..._hevc.mkv /media/Serien/...thumb.jpg /media/Serien/...season-poster.jpg /media/Serien_Kinder/..._hevc.mkv /media/Serien_Kinder/...poster.jpg So the remaining stat storm appears to come from a second filesystem/stat path that is not represented by pollingShares, or from additional watcher/scanner instances not controlled by WATCH_POLL_INTERVAL_MS.
-
Confirmed. I attached strace from a temporary debug container to the host PID of the actual next-server process while 2 QSV encodes were running and the Web UI was sluggish. Command used: pid=$(docker top x265-butler -eo pid,comm,args | awk '$2=="next-server"{print $1; exit}') docker run --rm -it \ --pid=host \ --cap-add SYS_PTRACE \ --security-opt seccomp=unconfined \ alpine sh -c "apk add --no-cache strace >/dev/null && timeout 10 strace -f -c -p $pid 2>&1 | head -30"Output strace: Process 970844 attached with 23 threads strace: Process 970844 detached ... % time seconds usecs/call calls errors syscall ------ ----------- ----------- --------- --------- ---------------- 87.90 307.585941 495 620684 statx 8.28 28.979974 61 474333 97810 futex 1.71 5.997531 32 182512 epoll_pwait 1.11 3.883501 34 113574 read So yes, this strongly confirms that the bottleneck is massive filesystem stat work. During the 10s sample, next-server made about 620k statx calls, roughly 62k/sec, and statx accounted for ~88% of traced syscall time. This matches the previous thread samples where all libuv workers were busy and explains why increasing UV_THREADPOOL_SIZE improves responsiveness somewhat but does not fix the root cause.
-
Thanks — I captured another process/thread snapshot during the slow UI state with two active QSV encodes on v2.36.0. The important finding is that ENCODE_NICE is working correctly: ffmpeg NI 19 ffmpeg NI 19Both active encodes are using QSV: -c:v hevc_qsvHowever, the Web UI is still sluggish while the two encodes are running. docker top shows next-server around 100% CPU: next-server ~100% ffmpeg ~68–70% ffmpeg ~68–70%But the host thread view shows that this is not a single hot JS main thread. The CPU is split across the Node/libuv worker pool: 3698425 3698456 ... 20.1 libuv-worker next-server 3698425 3698455 ... 20.0 libuv-worker next-server 3698425 3698454 ... 20.0 libuv-worker next-server 3698425 3698453 ... 20.0 libuv-worker next-server 3698425 3698425 ... 18.8 next-serverSo the ~100% next-server CPU appears to be real process CPU, but mostly from libuv worker threads, not from one hot V8/JS main thread. That also explains why the previous .cpuprofile was mostly idle / did not show a clear JS hot loop: the expensive work seems to happen outside the JS main thread, likely in native/libuv worker activity. My current interpretation: ffmpeg priority handling works QSV is being used this does not look like a pure JS/V8 hot loop the remaining bottleneck seems to be libuv/native worker activity inside the Next server process while encodes are active Possible suspects: frequent fs stat / access / readdir / watch activity progress or queue polling triggering filesystem or DB work native DB/filesystem work in the libuv pool something scaling with active encodes and/or library size Would it make sense to add diagnostics around libuv-heavy paths, filesystem checks, watcher activity, progress update persistence, and queue polling while encodes are active? I attached the process/thread samples and the previous diagnostics/profile material. debug-capture-20260624-090916.zip process-samples.txt x265-node-cpuprofile.tar.gz I tested different UV_THREADPOOL_SIZE values during the same general scenario: two active QSV encodes on x265-butler v2.36.0. ### Summary The Web UI gets noticeably worse with UV_THREADPOOL_SIZE=8. With 16 and 32 it is better, but still not really fast/snappy. ### Observations #### Default / small pool behavior With the smaller/default-ish pool, next-server was around ~100% CPU, but the visible libuv workers were already heavily loaded: - next-server: ~100% - 4 libuv workers: ~20% each - UI felt sluggish This suggests the libuv pool is already saturated even before increasing it. :contentReference[oaicite:0]{index=0} #### UV_THREADPOOL_SIZE=8 With UV8, the UI became noticeably sluggish again. The sample shows: - next-server: ~204% - main thread: ~34% - 8 libuv workers: ~20.8–20.9% each So all 8 libuv workers appear busy/saturated. This matches the bad UI responsiveness. :contentReference[oaicite:1]{index=1} #### UV_THREADPOOL_SIZE=16 With UV16, the UI was better, but still not fast. The sample shows: - next-server: ~206–210% - main thread: ~34–42% - 16 libuv workers: ~10.2–10.6% each So the same type of work is spread over more workers. This reduces perceived blocking, but does not reduce the underlying workload. :contentReference[oaicite:2]{index=2} :contentReference[oaicite:3]{index=3} #### UV_THREADPOOL_SIZE=32 With UV32, the UI felt slightly better than UV16, but still not really snappy. The sample shows: - next-server: ~192% - main thread: ~38.5% - 32 libuv workers: ~4.6–4.7% each This again suggests the larger pool reduces starvation/queueing, but the server is still doing a lot of libuv-backed work during active encodes. :contentReference[oaicite:4]{index=4} ### Current interpretation Increasing UV_THREADPOOL_SIZE helps responsiveness somewhat, but it looks like a workaround rather than a real fix. The key pattern is: ```text UV8 -> workers saturated, UI clearly sluggish UV16 -> better, but still not fast UV32 -> slightly better again, but next-server still burns ~190–200% CPU So it looks like the app is producing a significant amount of libuv/native/filesystem-style work while encodes are running. The threadpool size changes how badly this blocks the UI, but the actual work remains. Likely areas to inspect Possible suspects: repeated fs.stat / fs.access / path checks during active jobs progress handling queue polling filesystem scans/watchers SQLite or persistence work triggered too frequently per-progress-update DB/file operations request handlers doing filesystem work while encodes are active Additional note The ffmpeg children are already nice 19, so encode priority itself seems applied correctly. The remaining bottleneck appears to be inside the next-server process / libuv workload, not just ffmpeg CPU priority. process-samples-uv4(default).txt process-samples-uv8.txt process-samples-uv16.txt process-samples-uv32.txt
-
Hi, v2.35.0 improves ffmpeg scheduling correctly, but the Web UI is still very sluggish for me during two concurrent QSV encodes. What works: - x265-butler 2.35.0 - qsv detected and functional - last test encode uses hevc_qsv successfully - active encode commands use -c:v hevc_qsv - ffmpeg processes are correctly reniced to NI 19 - no DRI permission issues - no slow queries/requests in diagnostics Observed during two active QSV encodes: The UI is sluggish even though ffmpeg is already at nice 19. Closing the browser tab does not noticeably reduce next-server CPU usage. This looks like the remaining bottleneck is inside the single-process Next.js server, possibly queue/progress/SSE/SQLite/job-state handling.
-
So - every thing works fine now from my side. Thanks for this nice work. Just one thing... The system is very sluggish when encoding is in progress. The pages take a very long time to load, and sometimes the loading process even crashes (though in that case, I had three encodes running simultaneously). But the encodes are still running in the background.
-
Hello, as already mentioned, the queue - progressbar disapears like already mentioned in this post. And if you set the encoding parallelism to 2 or higher, a corresponding progress bar would be useful... :)
-
Hi @x265-butler, my queue keeps filling up with files that have already been encoded. I have the sidecar files stored centrally. They're also stored centrally. But the files still end up back in the queue. And it would be very nice to have the garbage in a seperate path... As we transcode on the cache drive (nvme/ssd) would it be really great to store the garbagefiles somewhere where the can life the 30 days... (on the array as example) It would be nice when we could adjust this path by our self Greetings Chris
-
Hello, i'm on a Gigabyte Z790 AORUS ELITE AX , Version 1.1... It seems that i'm not able to control the fans... In the BIOS i have set everything like you already written... i have the Dynamix Temp plugin installed, the IT87 Plugin and all set up... Can someone help here?! I have made an issue on github... GitHubGigabyte Z790 AORUS ELITE AX , Version 1.1 no Fan Control...Hello i have a Gigabyte Z790 AORUS ELITE AX , Version 1.1 i have set in the Bios the settings like you described in the issue #34 The SYS_FAN Mode has just the options "slope" or "stairs" I'm using...
-
Hello @itimpi, can you reupload your script? When i hit the download button it gives me an error. And yes i'm logged in. thanks
-
Hello, I have checked my cable management, but found nothing unusual. After the last major parity check went through without any errors, no errors have occurred so far. Mit freundlichen Grüßen Chris
-
Ok Thanks, so i will have a look into the case and look over my cable management. Or do you mean it would be because the power supply unit has to less power? it's a be quiet! Pure Power 12M 750W. And my other hardware components are I7 14700k, 4 NVME's, 5 HDDS (Array), and a LSI 9207-8i. But i think that should fit. Mit freundlichen Grüßen Chris
-
Hello, I have a disc in the array with read errors. I don't know exactly what to do. Replace the disc? Rebuild the file system? Maybe you can help me decide. Please find attached the diagnostic log and the short smart test. Extended smart test is still running. Thanks in advise. Chris unraidserver-smart-20240704-0900.zip unraidserver-diagnostics-20240704-0904.zip
-
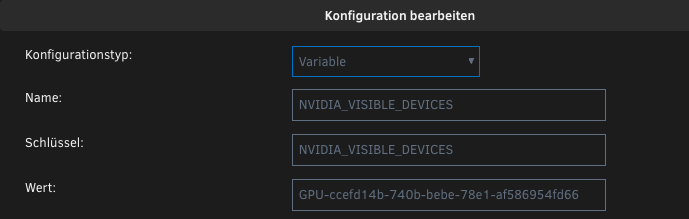
Hello, i was searching a while but didn't find the answer for my question... I have a multi gpu setup. And wan't frigate to use the second gpu. but it always uses the first one. i have fount the part in the documentation but i don't know how to get this in unraid to work... https://docs.frigate.video/configuration/hardware_acceleration/#docker-compose---nvidia-gpu can someone point me in the right direction, to get this working? edit: of course i have set up all other setting in the docker section and the nvidia-plugin running... This is the id of the second gpu... Mit freundlichen Grüßen Chris

-
You are right - just tried it right now... So after Update or Editing of the container... for example too, if the container is automatically updated (by the plugin CA Auto Update Applications) so can we turn this behavior off? mfg Chris


