


razierklinge
Members
-
Joined
-
Last visited
Everything posted by razierklinge
-
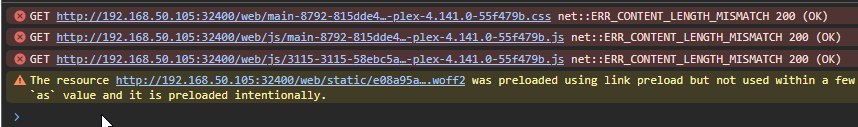
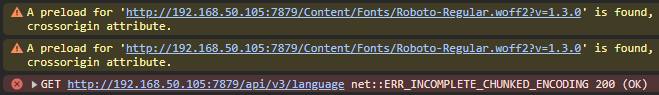
It seems that after updating to v7 I'm getting a strange issue that is specific to Chrome. Sometimes the container WebUI will simply not load and I have to refresh many times until it suddenly works. This happens with pretty much every container I've tried, but it is worse with specific ones. For example, Sonarr/Radarr I may only have to reload a couple times, but Plex almost never loads correctly. If I try in Edge instead, they load first try. I've attempted disabling all extensions and it had no effect. My Chrome version is 134.0.6998.3. I noticed in DevTools that I'm getting errors when the pages don't load correctly. Screenshot below is from trying to load the Plex UI, and all I get is a white page. This is when trying to load Radarr, but it happens maybe 1 in 20 reloads. The page itself says "Failed to load languages from API." I suppose it's possible a Chrome update caused this, since it updates pretty frequently. Unsure if this could have any impact here but I also generated an SSL cert under Management Access just after updating to v7. I attempted to search around for this issue but I couldn't find anyone describing something intermittent like this.
-
Sorry but this isn't accurate. Like the other person mentioned, I would login to iMessage and get kicked out after a few seconds, no popup would ever happen. But if you run iMessage through the terminal you WILL get a customer code in the log. I called, gave them the info, and on the 2nd call the lady said, "Oh I see where I need to put that code. Try logging in now." And it suddenly worked. So a popup may or may not happen to indicate your account needs to be authorized.
-
I had this exact issue. Triple checked that I followed every step correctly and got nowhere. Ended up having to call Apple to "authorize" my account. If you run iMessage through terminal using: sudo /System/Applications/Messages.app/Contents/MacOS/Messages You'll get an ID number that you give the customer service rep and they'll basically unlock your account and iMessage will magically work. It took me multiple calls to get someone who knew where to put that number. I mentioned a few times that I believed my account was locked and finally the person figured it out. Edit: Also, they'll try to get you to let them remote into your Mac. Just say you arent in front of it at the moment or aren't able to for whatever reason. Them remoting in to troubleshoot will get you nowhere.
-
I forgot to update this thread with what I did to resolve my particular problem. Strangely it was my qBittorrent docker itself that was incapable of downloading any faster than around 30MB/s. I switched my torrent client to Deluge, and then installed the 'ItConfig' plugin and loaded the "performance" settings. With this new setup I am easily able to hit gigabit speeds with torrents. So unfortunately I don't think I can give you any tips for how to fix your rclone speeds.
-
My apologies, all my comments are referring to megabytes per second, not megabits. It's not my ISP or VPN causing the problem as far as I can tell. My torrent speeds are what tipped me off to this problem, but I'm using "curl" in the terminal to download an iso file to specific locations to test my speeds now. When I direct the file to be saved at /mnt/cache I'm hitting 108MB/s, but when I save it to a folder in /mnt/user I get 30MB/s max. And I've verified the file is going to my cache drive when saving to the folder in the user directory. I know there is overhead involved by using the fuse filesystem, but a ~70% decrease in speed seems excessive. And I'm sure I was able to get at least 100MB/s on my torrents a few months ago. So something along the way has changed, and I've not really touched my unraid settings since I set it up last year. I should mention that I was originally on v6.7.2 when I noticed this problem, and have moved to v6.8.0-rc7 to see if would make a difference. Which it didn't.
-
Tried enabling Direct I/O and saw no difference at all in the download speed to /mnt/user/*
-
Anyone have some ideas of what this could be? It's incredibly frustrating to pay for gigabit and only hit about 30% of what it can do.
-
Unfortunately that didn't seem to help. But I have been having this issue for a couple weeks now, long before I updated Preclear. Something interesting I just found... I changed my qBittorrent docker to use /mnt/cache/appdata instead of /mnt/user/appdata and I am now able to curl to the /config directory inside the docker at gigabit speed. So it's as if writing to /mnt/user directory, whether it's going to the cache or not, is slow? I'm not sure, sounds weird.
-
Attached my diag file. I really can't make sense of why the dockers are so much slower. shaun-nas-diagnostics-20191125-0255.zip
-
Tried some more dockers, all of them hit some sort of ~30mb/s limit, EXCEPT for the pihole docker. Not sure what that tells me. Can pihole somehow slow down network throughput?
-
I made sure that the downloads were going to /mnt/cache. Here's the weird thing, I swapped my ethernet cable and now I'm able to hit gigabit speeds using curl, but my torrent downloads are still having the same behavior and only getting to 20-30mb/s. So I tried doing curl to "/mnt/cache/appdata/qbittorrent" using the unRaid terminal and hit 108mb/s. I then opened up a console into the qbittorrent docker itself and went to /config, which is effectively the same path and tried doing curl, and was only able to hit 30mb/s. I tried this in other dockers and got the same result. Is there something that would limit the speed that dockers are able to download? And I've verified that my docker image is on the cache drive.
-
Recently I noticed that my download speeds are slower than usual on my server. I have gigabit internet and would regularly get upwards of 70-100mb/s downloads on large torrents. Now I'm barely able to hit 30mb/s. Some tests I ran: Speedtest/downloaded files using my Windows system - hit gigabit speeds easily Ran a file write speed test on my cache drive and was able to hit 160mb/s write speed consistently Using a mapped folder from my cache drive, I downloaded a large file to it using Windows and was able to get ~70mb/s (probably need a better server to download from) In the unRaid terminal I used curl to download a file to my cache drive and was only able to get around 25mb/s. It seemed as if it would get up to 25mb/s and then suddenly drop down to around 17mb/s and then climb again. Anyone have some ideas why this might be happening or some things I can check to figure out what's going on? Thanks.
-
I did a replace and did not start a new device. This worked on my home PC's Ubuntu. I then created a VM with my unraid server using the same Ubuntu version. Got stuck in the same place as the Crashplan docker does, while trying to re-sign in after going through the replace device prompts. The logs show the same errors that I posted earlier in the thread, with connections being dropped/closed. So there is definitely something unique about how unraid is configured that is making Crashplan break.
-
So what I ended up doing was creating an Ubuntu VM on my regular home PC and installed Crashplan there. At first it seemed like I was running into the same problem during the sign-in process, but I restarted the CrashplanEngine and then was able to login successfully and the backup started running. I suppose this means there is something going on with my Unraid server's configuration that is causing this problem of being unable to connect/backup. Looking at @Spritzup's message above, I realized I have a PiHole docker running that maps port 443. Is this potentially a commonality between those of us having issues connecting to Crashplan? It just seems strange that I've had this setup for a while now without any problems until recently.
-
This is what the support said: Output of the command: /mnt/user/appdata/CrashPlanPRO/log/app.log:OS = Linux (4.19.56, amd64) /mnt/user/appdata/CrashPlanPRO/log/service.log:[08.30.19 22:38:57.446 INFO main up42.common.config.ServiceConfig] ServiceConfig:: OS = Linux /mnt/user/appdata/CrashPlanPRO/log/service.log:[08.30.19 22:38:57.831 INFO main om.code42.utils.SystemProperties] OS=Linux (4.19.56, amd64)
-
Too late I contacted them last week and he said without any prompting from me that he could see I'm running the app in an unsupported version of Linux and that I would need to run it from a supported OS before he could provide any support.
-
So I'm seeing lots of stuff like this: [08.30.19 23:09:58.735 INFO erTimeoutWrk e42.messaging.peer.PeerConnector] PC:: Cancelling connection attempt due to timeout - pending connection=PendingConnection[timeout(ms) = 30000, startTime = Fri Aug 30 23:09:23 MST 2019, remotePeer = RemotePeer-[guid=4200, state=CONNECTING]; Session-null, pendingChannel = com.code42.messaging.network.nio.NioNetworkLayer$1@57340d4d][08.30.19 23:09:58.737 INFO erTimeoutWrk 42.messaging.network.nio.Context] Channel became inactive. closedBy=THIS_SIDE, reason='Connect cancelled', channel=Context@1942087335[channelState=0], remote=[[[email protected]:443(server)], transportPbK=X509.checksum(be4b2a71961d23dabb77ea3851a2fc8d)] [08.30.19 23:10:23.738 INFO re-event-2-4 abre.SabrePendingChannelListener] SABRE::Channel connect failed for guid 42, cause=io.netty.channel.ConnectTimeoutException: connection timed out: /162.222.41.12:443 [08.30.19 23:10:23.739 INFO re-event-2-4 .handler.ChannelLifecycleHandler] SABRE:: Channel became inactive. closedBy=THIS_SIDE, channel=[id: 0xe810da0f], sessionState=RemotePeer-[guid=42, state=CONNECTING]; Session-[localID=916848385999105934, remoteID=0, closed=false, remoteIdentity=ENDPOINT, local=null, remote=null] [08.30.19 23:11:13.740 INFO erTimeoutWrk e42.messaging.peer.PeerConnector] PC:: Cancelling connection attempt due to timeout - pending connection=PendingConnection[timeout(ms) = 30000, startTime = Fri Aug 30 23:10:38 MST 2019, remotePeer = RemotePeer-[guid=4200, state=CONNECTING]; Session-null, pendingChannel = com.code42.messaging.network.nio.NioNetworkLayer$1@2259404e][08.30.19 23:11:13.740 INFO erTimeoutWrk 42.messaging.network.nio.Context] Channel became inactive. closedBy=THIS_SIDE, reason='Connect cancelled', channel=Context@1972117142[channelState=0], remote=[[[email protected]:4282]] [08.30.19 23:12:13.743 INFO erTimeoutWrk e42.messaging.peer.PeerConnector] PC:: Cancelling connection attempt due to timeout - pending connection=PendingConnection[timeout(ms) = 30000, startTime = Fri Aug 30 23:11:43 MST 2019, remotePeer = RemotePeer-[guid=4200, state=CONNECTING]; Session-null, pendingChannel = com.code42.messaging.network.nio.NioNetworkLayer$1@2a52b0f] [08.30.19 23:12:13.743 INFO erTimeoutWrk 42.messaging.network.nio.Context] Channel became inactive. closedBy=THIS_SIDE, reason='Connect cancelled', channel=Context@2116878626[channelState=0], remote=[[[email protected]:4282]] Here's the odd thing. I wiped out my install and even recreated docker.img. When I did all that I was able to login and say I wanted to replace an existing backup. It said it would pull my settings and have me login again, and THAT is when things go to shit. It sits on "Connecting..." indefinitely and those messages above are what I see in the logs. If I kill the docker and restart it I am unable to login and get "Unable to sign in cannot connect to server" messages. The only time I can login is if I wipe out my container config and start fresh. I've gone into the container console and tried pinging the IPs it's unable to connect to and it seems to work fine. I'm very confused why this is suddenly broken.
-
My crashplan has been saying "unable to connect to destination" for weeks, and I have no clue what changed. It's been fine for months without any interaction. Any ideas what I could check? I've tried restarting my whole server, restarting the docker itself, doing "rz, restart" in the internal crashplan console window. Nothing has made a difference.


