


b3rs3rk
Members
-
Joined
-
Last visited
Everything posted by b3rs3rk
-
The 6.8.3 to 6.9.0 stable update removes the custom kernel driver. My plugin checks if you have the Nvidia or Intel GPU top utilities or driver on boot and uninstalls if you do not. You need to install the Nvidia driver or Intel GPU Top tool from @ich777 and re-install the plugin.
-
You need to re-install the plugin. It removes itself on startup if it doesn't detect the presence of the Nvidia driver or the Intel GPU top plugin. The 6.8.3 -> 6.9.0 upgrade removes the custom kernel driver in favor of @ich777's Nvidia driver plugin. But my plugin didn't see that installed on first boot and uninstalled.
-
Yeah that shows me what I needed to see. I will push a fix for it tonight or tomorrow morning and then issue a plug-in update. Thanks for your help and patience. You can uninstall/reinstall to set everything back to normal.
-
I honestly have no idea what I was thinking. You need to replace Nvidia.php in lib with that file. You can just move the current Nvidia.php to Nvidia.php.old and then move the new file from gist as Nvidia.php into lib. Then just run gpustatus.php like normal from the gpustat directory. My bad.
-
It needs to be in the same directory as gpustatus.php but you put it in lib.
-
You've removed a curly brace that you shouldn't have. Just copy the entire contents of this gist and paste it into a separate file in the same directory as gpustatus.php. You can name it gpustatus-test.php and run it then send me the result. Make sure PCI RX TX is still enabled when you run it.
-
@jamerperson At this point I need something else to determine what is wrong. nvidia-smi is returning N/A which means your card doesn't support PCI RX TX utilization reporting. So you can't use it, but it shouldn't be erroring like this. Disabling that metric in the settings should fix your plugin display issues. If you can I need you to do something for me to figure out what's happening. In the console: cd /usr/local/emhttp/plugins/gpustat/lib/ nano -c ./Nvidia.php Scroll down to Line 254 (nano -c will show you the line numbers as you go). It will look like this: if ($data->pci->rx_util !== 'N/A') { $this->pageData['rxutil'] = (string)$this->roundFloat($this->stripText(' KB/s', $data->pci->rx_util) / 1000); } if ($data->pci->tx_util !== 'N/A') { $this->pageData['txutil'] = (string)$this->roundFloat($this->stripText(' KB/s', $data->pci->tx_util) / 1000); } Replace these six lines with these: if ($data->pci->rx_util !== 'N/A') { var_dump($data->pci->rx_util); $this->pageData['rxutil'] = (string)$this->roundFloat($this->stripText(' KB/s', $data->pci->rx_util) / 1000); } if ($data->pci->tx_util !== 'N/A') { var_dump($data->pci->tx_util); $this->pageData['txutil'] = (string)$this->roundFloat($this->stripText(' KB/s', $data->pci->tx_util) / 1000); } Then run the following: cd /usr/local/emhttp/plugins/gpustat php ./gpustatus.php And send me the result. Once you've sent it, you can reinstall the plugin to set it back to normal.
-
I'm not sure I'm looking at it properly. Try disabling the PCI RX/TX utilization in the settings and see what happens with the dashboard panel. If it starts displaying, cool. You don't really need it anyways because your card doesn't show anything for it. If it doesn't work, send me the nvidia-smi -q -x -i 0 results again.
-
Something weird is going on with your setup. It's escaping "N/A" so that it shows up as "N\/A" which I don't check for. I'm only looking for "N/A" without the backslash. It also looks like it is inserting char codes for degrees Celsius, which won't be displayed properly once it starts working. Do you have some kind of special locale settings on your UnRAID install?
-
Your problem has to be different from @jamerperson's. Your PCI RX and TX util's are coming up as N/A which I specifically check for and ignore. Send me the result of: cd /usr/local/emhttp/plugins/gpustat/ php ./gpustatus.php from the UnRAID console
-
@jamerperson I'm guessing you have two graphics cards? I'll need the output from the one that is failing to be displayed properly by the plugin. Try this instead: nvidia-smi -q -x -i 1
-
The number is the total count of processes. The images display when the plugin identifies those apps as running. The next release will allow you to hover over each identified app and see how many processes there are per app and how much memory each app is using across all sessions. I will probably change the layout because so many people did not seem to understand this.
-
You seem to be having an issue that I already fixed with the last round of plugin updates. Can you send me the results of the nvidia-smi -q -x -i 0 command?
-
Sorry for the delay, I was out of town a few weeks. Open an UnRAID console and run the following: cd /usr/local/emhttp/plugins/gpustat/ php ./gpustatus.php Then paste me the result. Send me the same.
-
Obviously, you're free to do as you wish... but I have to push something that works for everyone. I did some reading of that bug and some stackoverflow posts and it seems that Chrome height percentage values are based on the parent container height. If no absolute height is set to calculate percentage against it defaults to the real height of the image (causing this issue). If we make it auto, it will calculate height based on the calculated width which should easily maintain a nice aspect ratio since all of the images I'm using are square. This will also retain responsiveness for people with larger/smaller font sizes either due to zooming or different resolution desktops.
-
Instead of height: 6%; what happens when Chrome sees: height: auto;
-
I can probably set a maximum height and width as well as a minimum. I'd hate to do that though as it ruins the dynamic responsiveness. It's a strange problem that I can't seem to replicate despite disabling ThemeEngine and reverting to the defaults.
-
What theme settings are you two using? I can't seem to get it looking the same as yours with ThemeEngine enabled or disabled.
-
See how it says Total - Apps? Like the slider bars I was hoping it would be a little more apparent that the number shown is the total number of processes using the GPU, and then the apps would display for what those total processes are. My next release will allow you to hover over the apps and see how many processes there are for each app (as well as memory usage for each app). But for now, you are seeing it as intended.
-
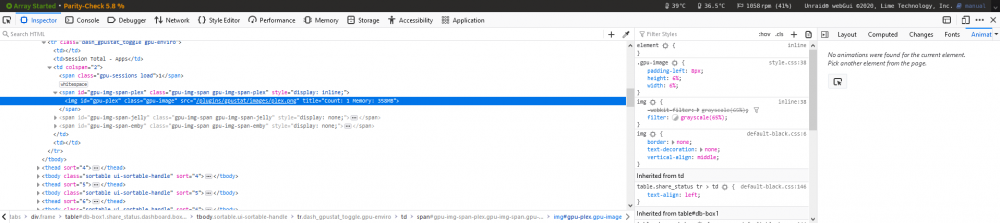
I'm sure someone else is having the issue, but I can't guess as to what is causing it. These problems are particularly difficult for me to solve since I'm not a very good front end developer. What browser are you using? Can you take a screenshot of the developer console after right clicking the image and saying Inspect element?
-
It doesn't know every app yet. I will see if I can make it a bit clearer in the next release what you're looking at.
-
Please explain. Screenshot? The number is a count of _all_ processes. The app icons will display to tell you which processes are using the GPU. You will be able to hover over each app to see how many instances each app is using, as well as the memory used for that app in the next push. Right now, I only show Plex, Jellyfin, or Emby icons. Haven't looked at Folding or any others yet.
-
Probably need some troubleshooting information from you unless you running 6.3.0 was a typo. Minimum version is 6.7.1.
-
That's very odd. What version of UnRAID are you running? Do you have any custom themes/CSS?
-
PCI Utilization. I use them to calculate bandwidth maximums for the slider bars and figured people might like to see them. Too busy?


