


idkwatimdoin
Members
-
Joined
-
No problems, thank you all for your help. So far so good. I will keep in mind regarding the cache drives and (at some point when pricing isn't through the roof) replace the lower capacity cache drive with a like size of the existing one. FWIW, the scrub completed on my cache pool overnight and no system errors were reported there either, so... it's a double-edged sword at this point (great there's no errors, but unsettling that there's no clear reason as to why this happened in the first place). I'll raise a new topic if the issue recurs and troubleshooting steps here haven't helped. Thanks again!
-
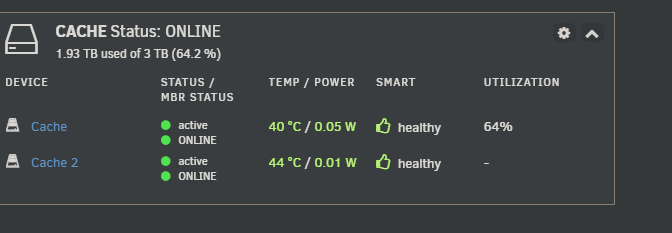
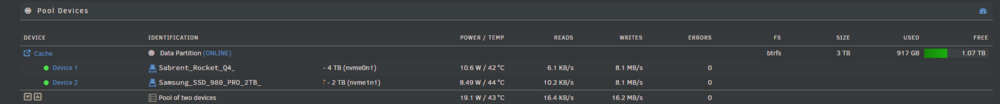
Interesting. In my use case, these two screenshots seem to report different metrics for usable space (the Main page reports correctly in that 2TB is "usable", but the math on the Dashboard reporting doesn't seem to be mathing: Dashboard: Main:
-
Understood, thanks for the info. Looks like scrubbing the cache was disabled (seems to have been that way since I set up the server many years ago) so have configured it to run once a month but away from the parity cache check timeframes. A question on the scrubbing for caches though; while I have redundancy on the cache pool, the drives are different sizes (one is 4TB, the other 2TB for a usable pool of 3TB). I understand making the cache drives the same size would be recommended but not possible for me at the moment. Will the scrubbing operation run into any problems with different sized drives? Or does it just run off the pool availability size?
-
I see. Admittedly I didn't check the caches and only the mechanical drives as that's where I thought the issue stemmed from. Why the user and user0 paths? User0 seems to contain significantly less than user (I'm assuming that's config related or by design but never gave it much thought until now). If it were the cache though, should it be expected to see some kind of error or failure in the drive before the shares disappeared from existence?
-
All drives passed xfs_repair status as no filesystem corruption detected. I've since rebooted the server and everything appears to have returned to normal. Will monitor things for now but would be great to know if the diags gave any indication of something failing that I need to address or if this was just a one off blip.
-
Hi, I recently upgraded to 7.3.0 as of 5 days ago, and found this morning my reverse proxy Docker container was throwing SqliteError: disk I/O error. Tried restarting the container, threw an error of docker: Error response from daemon: error while creating mount source path '/mnt/user/appdata/pangolin/config': mkdir /mnt/user: file exists. Have since then found that all my SMB shares have disappeared. Reviewing the logs, I'm seeing a lot of `make_connection_snum: canonicalize_connect_path failed for service appdata, path /mnt/user/appdata but for backup as well. I have several shares though and they are all coming back as unreachable in Windows and the Shares tab in Unraid is completely blank. Attached are diagnostics. I'm currently going through file system checking each disk, but any assistance would be appreciated. Thank you. notyourunraid-diagnostics-20260521-0908.zip
-
I see, thanks for the clarification. With that said, can TSDProxy support this functionality? No combination of adding the X-Forwarded-For variable to the TSDProxy Docker container is allowing any of the containers under the proxy to grab the "real" IP address. I understand the X-Forwarded-For header is just HTTP, and setting it up with NPM/SWAG/Traefik is simple enough, but none of the configuration documentation for TSDProxy that I have seen suggests this is possible with TSDProxy.
-
I've noticed over the last week or so that my HAOS VM crashes with the following error: qmu-system-x86_64: ../hw/usb/core.c:744: usb_ep_get: Assertion `pid USB_TOKEN_IN || pid USB_TOKEN_OUT' failed. 2025-06-11 04:28:17.359+0000: shutting down, reason=crashed A simple restart of the VM brings HAOS back up without error. The VM itself functions fine when operational (has 8GB RAM allocated but never seems to run over 75% of that) and there is no indication from VM performance that a crash is about to happen, it just falls over completely and without warning. The only Googling on that specific log points to https://gitlab.com/qemu-project/qemu/-/issues/2548 which seems to be more a bug fix? Any help would be appreciated. Thanks. notyourunraid-diagnostics-20250611-1458.zip
-
Is it possible to add the --snat-subnet-routes=false flag anywhere within the config or this docker container in Unraid? The only area it is currently accepted in the Unraid template is the 'Post Arguments' in Advanced View, but the container fails to start as the flag is not defined in the config. Inb4 try using the Tailscale option on the Docker containers; I have at least 3 different containers that will not run using the Tailscale plugin but run fine with TSDProxy, however for some authentication services I would like to know the real IP of where it is being connected from instead of the Docker internal IP, and from what I've read --snat-subnet-routes=false should do that, I just haven't been able to get it working with TSDProxy.
-
Closing issue; not resolved, but no longer willing to troubleshoot the screen and will replace with another that works.
-
To add, the above error was on Unraid 7.0.0. Have just updated to 7.0.1, same issue. New error and diagnostics: Mar 1 10:01:17 Tower kernel: i915 0000:00:02.0: [drm] VT-d active for gfx access Mar 1 10:01:17 Tower kernel: Console: switching to colour dummy device 80x25 Mar 1 10:01:17 Tower kernel: i915 0000:00:02.0: vgaarb: deactivate vga console Mar 1 10:01:17 Tower kernel: i915 0000:00:02.0: [drm] Using Transparent Hugepages Mar 1 10:01:17 Tower kernel: i915 0000:00:02.0: vgaarb: VGA decodes changed: olddecodes=io+mem,decodes=io+mem:owns=io+mem Mar 1 10:01:17 Tower kernel: mei_hdcp 0000:00:16.0-b638ab7e-94e2-4ea2-a552-d1c54b627f04: bound 0000:00:02.0 (ops i915_hdcp_ops [i915]) Mar 1 10:01:17 Tower kernel: i915 0000:00:02.0: [drm] Finished loading DMC firmware i915/kbl_dmc_ver1_04.bin (v1.4) Mar 1 10:01:17 Tower kernel: i915 0000:00:02.0: [drm] [ENCODER:94:DDI A/PHY A] failed to retrieve link info, disabling eDP Mar 1 10:01:17 Tower kernel: [drm] Initialized i915 1.6.0 20201103 for 0000:00:02.0 on minor 0 Mar 1 10:01:17 Tower kernel: ACPI: video: Video Device [GFX0] (multi-head: yes rom: no post: no) Mar 1 10:01:17 Tower kernel: input: Video Bus as /devices/LNXSYSTM:00/LNXSYBUS:00/PNP0A08:00/LNXVIDEO:00/input/input4 Mar 1 10:01:17 Tower kernel: fbcon: i915drmfb (fb0) is primary device Mar 1 10:01:17 Tower kernel: Console: switching to colour frame buffer device 50x80 Mar 1 10:01:17 Tower kernel: i915 0000:00:02.0: [drm] fb0: i915drmfb frame buffer device Mar 1 10:01:17 Tower kernel: i915 0000:00:02.0: pipe_off wait timed out Mar 1 10:01:17 Tower kernel: WARNING: CPU: 4 PID: 636 at drivers/gpu/drm/i915/display/intel_display.c:297 intel_disable_transcoder+0x1aa/0x1f9 [i915] Mar 1 10:01:17 Tower kernel: Modules linked in: intel_rapl_common x86_pkg_temp_thermal intel_powerclamp coretemp kvm_intel zfs(PO+) i915 kvm iosf_mbi drm_buddy ttm i2c_algo_bit drm_display_helper crct10dif_pclmul crc32_pclmul crc32c_intel ghash_clmulni_intel sha512_ssse3 sha256_ssse3 sha1_ssse3 drm_kms_helper aesni_intel crypto_simd spl(O) cryptd mei_hdcp mei_pxp wmi_bmof intel_wmi_thunderbolt rapl drm intel_cstate intel_uncore tpm_crb nvme intel_gtt e1000e mei_me i2c_i801 agpgart i2c_smbus ahci nvme_core mei i2c_core libahci video thermal fan tpm_tis wmi tpm_tis_core backlight tpm acpi_pad acpi_tad button Mar 1 10:01:17 Tower kernel: CPU: 4 PID: 636 Comm: kworker/4:2 Tainted: P O 6.6.78-Unraid #2 Mar 1 10:01:17 Tower kernel: Workqueue: events output_poll_execute [drm_kms_helper] Mar 1 10:01:17 Tower kernel: RIP: 0010:intel_disable_transcoder+0x1aa/0x1f9 [i915] Mar 1 10:01:17 Tower kernel: Code: c0 74 4e 48 8b 7b 08 48 8b 5f 50 48 85 db 75 03 48 8b 1f e8 e8 ad ec e0 48 89 da 48 c7 c7 23 b4 a3 a0 48 89 c6 e8 48 ce 82 e0 <0f> 0b eb 23 48 8b 44 24 20 65 48 2b 04 25 28 00 00 00 75 23 48 83 Mar 1 10:01:17 Tower kernel: RSP: 0018:ffffc9000105ba58 EFLAGS: 00010286 Mar 1 10:01:17 Tower kernel: RAX: 0000000000000000 RBX: ffff88810158a090 RCX: 0000000000000003 Mar 1 10:01:17 Tower kernel: RDX: 0000000006f03400 RSI: 0000000000000003 RDI: 00000000ffffffff Mar 1 10:01:17 Tower kernel: RBP: ffff888108388000 R08: 0000000000000000 R09: ffff888106f03400 Mar 1 10:01:17 Tower kernel: R10: 0000000000000001 R11: 0000000000aaaaaa R12: 0000000000070008 Mar 1 10:01:17 Tower kernel: R13: ffff888103002000 R14: 0000000000000000 R15: 0000000000000000 Mar 1 10:01:17 Tower kernel: FS: 0000000000000000(0000) GS:ffff88844c700000(0000) knlGS:0000000000000000 Mar 1 10:01:17 Tower kernel: CS: 0010 DS: 0000 ES: 0000 CR0: 0000000080050033 Mar 1 10:01:17 Tower kernel: CR2: 000014abbb43f000 CR3: 0000000005416003 CR4: 00000000003706e0 Mar 1 10:01:17 Tower kernel: DR0: 0000000000000000 DR1: 0000000000000000 DR2: 0000000000000000 Mar 1 10:01:17 Tower kernel: DR3: 0000000000000000 DR6: 00000000fffe0ff0 DR7: 0000000000000400 Mar 1 10:01:17 Tower kernel: Call Trace: Mar 1 10:01:17 Tower kernel: <TASK> Mar 1 10:01:17 Tower kernel: ? __warn+0x99/0x11a Mar 1 10:01:17 Tower kernel: ? report_bug+0xd9/0x153 Mar 1 10:01:17 Tower kernel: ? intel_disable_transcoder+0x1aa/0x1f9 [i915] Mar 1 10:01:17 Tower kernel: ? handle_bug+0x53/0x7c Mar 1 10:01:17 Tower kernel: ? exc_invalid_op+0x13/0x60 Mar 1 10:01:17 Tower kernel: ? asm_exc_invalid_op+0x16/0x20 Mar 1 10:01:17 Tower kernel: ? intel_disable_transcoder+0x1aa/0x1f9 [i915] Mar 1 10:01:17 Tower kernel: ? intel_disable_transcoder+0x1aa/0x1f9 [i915] Mar 1 10:01:17 Tower kernel: intel_ddi_post_disable+0x38/0x2b8 [i915] Mar 1 10:01:17 Tower kernel: intel_encoders_post_disable+0x5d/0x6f [i915] Mar 1 10:01:17 Tower kernel: hsw_crtc_disable+0x48/0xc6 [i915] Mar 1 10:01:17 Tower kernel: intel_old_crtc_state_disables.isra.0+0x33/0x6c [i915] Mar 1 10:01:17 Tower kernel: intel_atomic_commit_tail+0x389/0x9e2 [i915] Mar 1 10:01:17 Tower kernel: intel_atomic_commit+0x27b/0x28e [i915] Mar 1 10:01:17 Tower kernel: drm_atomic_commit+0xa8/0xcb [drm] Mar 1 10:01:17 Tower kernel: ? __pfx___drm_printfn_info+0x10/0x10 [drm] Mar 1 10:01:17 Tower kernel: ? __pfx___drm_printfn_info+0x10/0x10 [drm] Mar 1 10:01:17 Tower kernel: drm_client_modeset_commit_atomic+0x152/0x1e5 [drm] Mar 1 10:01:17 Tower kernel: drm_client_modeset_commit_locked+0x3b/0x12e [drm] Mar 1 10:01:17 Tower kernel: drm_client_modeset_commit+0x28/0x3d [drm] Mar 1 10:01:17 Tower kernel: __drm_fb_helper_restore_fbdev_mode_unlocked+0x4e/0x8c [drm_kms_helper] Mar 1 10:01:17 Tower kernel: drm_fb_helper_set_par+0x2c/0x3b [drm_kms_helper] Mar 1 10:01:17 Tower kernel: drm_fb_helper_hotplug_event+0xc4/0xd4 [drm_kms_helper] Mar 1 10:01:17 Tower kernel: drm_kms_helper_hotplug_event+0x23/0x2f [drm_kms_helper] Mar 1 10:01:17 Tower kernel: output_poll_execute+0x1a0/0x1e6 [drm_kms_helper] Mar 1 10:01:17 Tower kernel: ? __schedule+0x66f/0x6bb Mar 1 10:01:17 Tower kernel: ? add_timer_on+0x9f/0xd5 Mar 1 10:01:17 Tower kernel: process_scheduled_works+0x1a2/0x2ea Mar 1 10:01:17 Tower kernel: worker_thread+0x1c6/0x220 Mar 1 10:01:17 Tower kernel: ? __pfx_worker_thread+0x10/0x10 Mar 1 10:01:17 Tower kernel: kthread+0xf1/0xfc Mar 1 10:01:17 Tower kernel: ? __pfx_kthread+0x10/0x10 Mar 1 10:01:17 Tower kernel: ret_from_fork+0x21/0x36 Mar 1 10:01:17 Tower kernel: ? __pfx_kthread+0x10/0x10 Mar 1 10:01:17 Tower kernel: ret_from_fork_asm+0x1b/0x30 Mar 1 10:01:17 Tower kernel: </TASK> Mar 1 10:01:17 Tower kernel: ---[ end trace 0000000000000000 ]--- tower-diagnostics-20250301-1003.zip
-
idkwatimdoin changed their profile photo
-
Hello, I know this issue has been around and fixed in various ways, however I wanting to know more information on why mine is behaving as it is. Newly setup server (Lenovo Thinkcentre M920Q, i5-8500T), fresh trial of Unraid installed, CLI and GUI work loading via browser. Booting with one particular HDMI monitor connected appears to run into a issue whereas another monitor loads fine. The working monitor is a spare Raspberry Pi 7" screen I had, the non-working is a 7.84" 1280x400 IPS panel: https://www.amazon.com/dp/B0BXL2Q53Y Diagnostics from working monitor boot: tower-diagnostics-20250228-0250.zip i915 specific logs: Feb 28 02:43:53 Tower kernel: i915 0000:00:02.0: [drm] VT-d active for gfx access Feb 28 02:43:53 Tower kernel: i915 0000:00:02.0: vgaarb: deactivate vga console Feb 28 02:43:53 Tower kernel: i915 0000:00:02.0: [drm] Using Transparent Hugepages Feb 28 02:43:53 Tower kernel: i915 0000:00:02.0: vgaarb: VGA decodes changed: olddecodes=io+mem,decodes=io+mem:owns=io+mem Feb 28 02:43:53 Tower kernel: mei_hdcp 0000:00:16.0-b638ab7e-94e2-4ea2-a552-d1c54b627f04: bound 0000:00:02.0 (ops i915_hdcp_ops [i915]) Feb 28 02:43:53 Tower kernel: i915 0000:00:02.0: [drm] Finished loading DMC firmware i915/kbl_dmc_ver1_04.bin (v1.4) Feb 28 02:43:53 Tower kernel: i915 0000:00:02.0: [drm] [ENCODER:94:DDI A/PHY A] failed to retrieve link info, disabling eDP Feb 28 02:43:53 Tower kernel: [drm] Initialized i915 1.6.0 20201103 for 0000:00:02.0 on minor 0 Feb 28 02:43:53 Tower kernel: fbcon: i915drmfb (fb0) is primary device Feb 28 02:43:53 Tower kernel: i915 0000:00:02.0: [drm] fb0: i915drmfb frame buffer device Diagnostics from non-working monitor boot: tower-diagnostics-20250228-0300.zip i915 specific logs: Feb 28 02:57:01 Tower kernel: i915 0000:00:02.0: [drm] VT-d active for gfx access Feb 28 02:57:01 Tower kernel: i915 0000:00:02.0: vgaarb: deactivate vga console Feb 28 02:57:01 Tower kernel: i915 0000:00:02.0: [drm] Using Transparent Hugepages Feb 28 02:57:01 Tower kernel: i915 0000:00:02.0: vgaarb: VGA decodes changed: olddecodes=io+mem,decodes=io+mem:owns=io+mem Feb 28 02:57:01 Tower kernel: mei_hdcp 0000:00:16.0-b638ab7e-94e2-4ea2-a552-d1c54b627f04: bound 0000:00:02.0 (ops i915_hdcp_ops [i915]) Feb 28 02:57:01 Tower kernel: i915 0000:00:02.0: [drm] Finished loading DMC firmware i915/kbl_dmc_ver1_04.bin (v1.4) Feb 28 02:57:01 Tower kernel: i915 0000:00:02.0: [drm] [ENCODER:94:DDI A/PHY A] failed to retrieve link info, disabling eDP Feb 28 02:57:01 Tower kernel: [drm] Initialized i915 1.6.0 20201103 for 0000:00:02.0 on minor 0 Feb 28 02:57:01 Tower kernel: fbcon: i915drmfb (fb0) is primary device Feb 28 02:57:01 Tower kernel: i915 0000:00:02.0: [drm] fb0: i915drmfb frame buffer device Feb 28 02:57:01 Tower kernel: i915 0000:00:02.0: pipe_off wait timed out Feb 28 02:57:01 Tower kernel: WARNING: CPU: 5 PID: 202 at drivers/gpu/drm/i915/display/intel_display.c:297 intel_disable_transcoder+0x1aa/0x1f9 [i915] Feb 28 02:57:01 Tower kernel: Modules linked in: intel_rapl_common x86_pkg_temp_thermal intel_powerclamp coretemp kvm_intel i915 zfs(PO) kvm iosf_mbi drm_buddy crct10dif_pclmul crc32_pclmul ttm crc32c_intel ghash_clmulni_intel sha512_ssse3 sha256_ssse3 i2c_algo_bit sha1_ssse3 drm_display_helper aesni_intel crypto_simd spl(O) mei_hdcp mei_pxp drm_kms_helper cryptd intel_wmi_thunderbolt wmi_bmof rapl intel_cstate drm nvme intel_uncore tpm_crb e1000e intel_gtt mei_me i2c_i801 nvme_core i2c_smbus ahci mei agpgart thermal libahci i2c_core fan video tpm_tis tpm_tis_core wmi backlight tpm button acpi_tad acpi_pad Feb 28 02:57:01 Tower kernel: Workqueue: i915-unordered i915_hotplug_work_func [i915] Feb 28 02:57:01 Tower kernel: RIP: 0010:intel_disable_transcoder+0x1aa/0x1f9 [i915] Feb 28 02:57:01 Tower kernel: ? intel_disable_transcoder+0x1aa/0x1f9 [i915] Feb 28 02:57:01 Tower kernel: ? intel_disable_transcoder+0x1aa/0x1f9 [i915] Feb 28 02:57:01 Tower kernel: ? intel_disable_transcoder+0x1aa/0x1f9 [i915] Feb 28 02:57:01 Tower kernel: intel_ddi_post_disable+0x38/0x2b8 [i915] Feb 28 02:57:01 Tower kernel: intel_encoders_post_disable+0x5d/0x6f [i915] Feb 28 02:57:01 Tower kernel: hsw_crtc_disable+0x48/0xc6 [i915] Feb 28 02:57:01 Tower kernel: intel_old_crtc_state_disables.isra.0+0x33/0x6c [i915] Feb 28 02:57:01 Tower kernel: intel_atomic_commit_tail+0x389/0x9e2 [i915] Feb 28 02:57:01 Tower kernel: intel_atomic_commit+0x27b/0x28e [i915] Feb 28 02:57:01 Tower kernel: i915_hotplug_work_func+0x2c7/0x34a [i915] Both monitors load the BIOS and the Lenovo splash symbol on boot, both monitors can see the boot up sequence text scrolling past for Unraid. The RPI monitor can see the blue Unraid box to choose OS, the IPS panel cannot. I've set 'modprobe i915' in the /boot/config/go file, and also tested (rebooting each setting change) with setting 'nomodeset', 'console 0' and 'console 1' in syslinux, and configured the BIOS to use the IGD specifically and set 1024MB of shared memory (instead of Auto). This gives me a flashing cursor on the IPS panel after boot, but no graphical interface (which from what I've read is expected as it disables onboard graphics). The BIOS has not been changed between either configuration outlined above, just simply the monitor plugged in and Unraid rebooted. This may be a niche issue that is simply not supported, but am curious nonetheless on why one works and one does not. The IPS panel works with Windows as an external screen, so I'd like to know what the deal is, if possible. Thanks.
-
Happy to. Send some details across and I'll gift you a copy of the game.
-
Any chance of creating a template for Tabletop Simulator? https://store.steampowered.com/app/286160/Tabletop_Simulator/ Seems the only Docker container I can find is one from ~3 years ago, however the Steam CLI seems to be broken on that one as it is not accepting working Steam credentials. https://github.com/Benjamin-Dobell/docker-tts
-
Oh! Good to know. Thanks!


