





wickedathletes
Community Developer
-
Joined
-
Last visited
Everything posted by wickedathletes
-
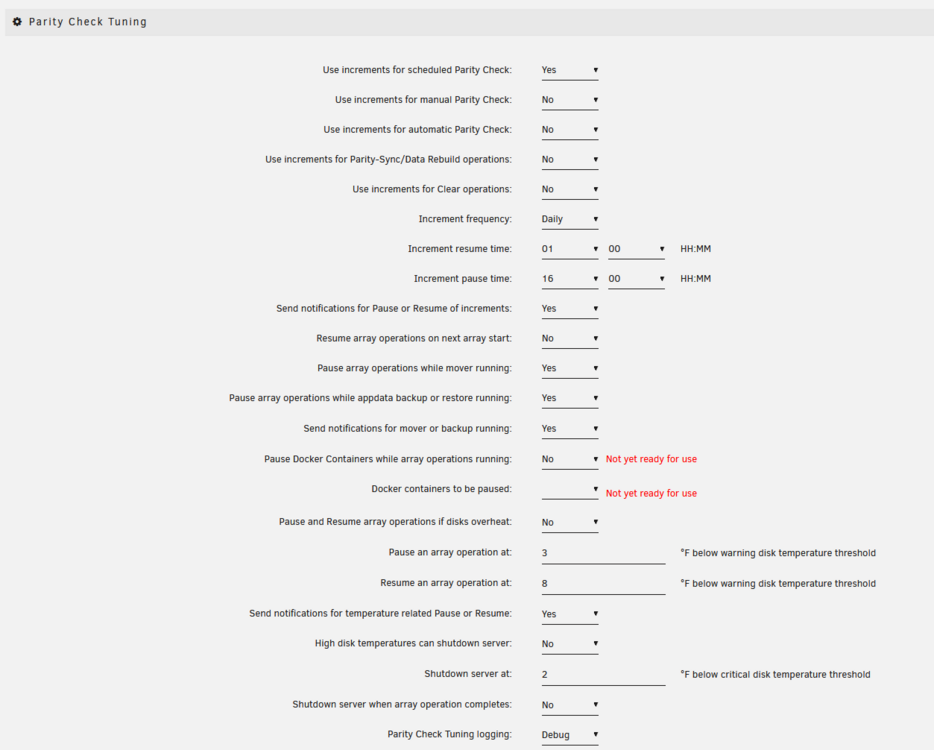
DISREGARD, I mean, definitely see if I am messing something up but I realized manual parity checks were set to no and this was a manual one since I cancelled the scheduled one when I noticed the issue initially and needed to reboot the system. also, one more thing... am I using Parity Check Tuning wrong? I just noticed its still running despite being after my time was up... Shouldnt it have paused at 4pm, its 6:15pm ET now)
-
fyi, these are my 4 drives with SMART Errors... Only Disk 3 actually ever reported errors on the main page but I have been monitoring all these drives in case its beyond just a bad connection on the cable/power failure etc etc. DISK 1 (INTERNAL BAY) ATA Error Count: 4 CR = Command Register [HEX] FR = Features Register [HEX] SC = Sector Count Register [HEX] SN = Sector Number Register [HEX] CL = Cylinder Low Register [HEX] CH = Cylinder High Register [HEX] DH = Device/Head Register [HEX] DC = Device Command Register [HEX] ER = Error register [HEX] ST = Status register [HEX] Powered_Up_Time is measured from power on, and printed as DDd+hh:mm:SS.sss where DD=days, hh=hours, mm=minutes, SS=sec, and sss=millisec. It "wraps" after 49.710 days. Error 4 occurred at disk power-on lifetime: 5817 hours (242 days + 9 hours) When the command that caused the error occurred, the device was active or idle. After command completion occurred, registers were: ER ST SC SN CL CH DH -- -- -- -- -- -- -- 40 41 00 00 00 00 00 Error: UNC at LBA = 0x00000000 = 0 Commands leading to the command that caused the error were: CR FR SC SN CL CH DH DC Powered_Up_Time Command/Feature_Name -- -- -- -- -- -- -- -- ---------------- -------------------- 60 00 00 a8 f8 df 40 00 2d+16:13:46.938 READ FPDMA QUEUED 60 00 00 a8 f4 df 40 00 2d+16:13:43.839 READ FPDMA QUEUED 2f 00 01 10 00 00 00 00 2d+16:13:43.838 READ LOG EXT 2f 00 01 10 00 00 00 00 2d+16:13:43.838 READ LOG EXT 60 00 00 a8 f0 df 40 00 2d+16:13:40.917 READ FPDMA QUEUED Error 3 occurred at disk power-on lifetime: 5817 hours (242 days + 9 hours) When the command that caused the error occurred, the device was active or idle. After command completion occurred, registers were: ER ST SC SN CL CH DH -- -- -- -- -- -- -- 40 41 00 00 00 00 00 Error: UNC at LBA = 0x00000000 = 0 Commands leading to the command that caused the error were: CR FR SC SN CL CH DH DC Powered_Up_Time Command/Feature_Name -- -- -- -- -- -- -- -- ---------------- -------------------- 60 00 00 a8 f0 df 40 00 2d+16:13:43.838 READ FPDMA QUEUED 60 00 00 a8 ec df 40 00 2d+16:13:40.916 READ FPDMA QUEUED 60 f8 00 b0 e9 df 40 00 2d+16:13:40.906 READ FPDMA QUEUED 60 08 00 a8 e8 df 40 00 2d+16:13:40.906 READ FPDMA QUEUED 60 00 00 a8 e4 df 40 00 2d+16:13:40.902 READ FPDMA QUEUED Error 2 occurred at disk power-on lifetime: 4166 hours (173 days + 14 hours) When the command that caused the error occurred, the device was doing SMART Offline or Self-test. After command completion occurred, registers were: ER ST SC SN CL CH DH -- -- -- -- -- -- -- 40 41 00 00 00 00 00 Error: UNC at LBA = 0x00000000 = 0 Commands leading to the command that caused the error were: CR FR SC SN CL CH DH DC Powered_Up_Time Command/Feature_Name -- -- -- -- -- -- -- -- ---------------- -------------------- 60 00 00 90 f7 df 40 00 3d+23:08:22.399 READ FPDMA QUEUED 60 00 00 90 f3 df 40 00 3d+23:08:19.332 READ FPDMA QUEUED 2f 00 01 10 00 00 00 00 3d+23:08:19.332 READ LOG EXT 2f 00 01 10 00 00 00 00 3d+23:08:19.332 READ LOG EXT 60 00 00 90 ef df 40 00 3d+23:08:16.585 READ FPDMA QUEUED Error 1 occurred at disk power-on lifetime: 4166 hours (173 days + 14 hours) When the command that caused the error occurred, the device was doing SMART Offline or Self-test. After command completion occurred, registers were: ER ST SC SN CL CH DH -- -- -- -- -- -- -- 40 41 00 00 00 00 00 Error: UNC at LBA = 0x00000000 = 0 Commands leading to the command that caused the error were: CR FR SC SN CL CH DH DC Powered_Up_Time Command/Feature_Name -- -- -- -- -- -- -- -- ---------------- -------------------- 60 00 00 90 ef df 40 00 3d+23:08:19.332 READ FPDMA QUEUED 60 00 00 90 eb df 40 00 3d+23:08:16.574 READ FPDMA QUEUED 60 00 00 90 e7 df 40 00 3d+23:08:16.570 READ FPDMA QUEUED 60 00 00 90 e3 df 40 00 3d+23:08:16.566 READ FPDMA QUEUED 60 00 00 90 df df 40 00 3d+23:08:16.561 READ FPDMA QUEUED DISK 3 (FRONT BAY) ATA Error Count: 3 CR = Command Register [HEX] FR = Features Register [HEX] SC = Sector Count Register [HEX] SN = Sector Number Register [HEX] CL = Cylinder Low Register [HEX] CH = Cylinder High Register [HEX] DH = Device/Head Register [HEX] DC = Device Command Register [HEX] ER = Error register [HEX] ST = Status register [HEX] Powered_Up_Time is measured from power on, and printed as DDd+hh:mm:SS.sss where DD=days, hh=hours, mm=minutes, SS=sec, and sss=millisec. It "wraps" after 49.710 days. Error 3 occurred at disk power-on lifetime: 23994 hours (999 days + 18 hours) When the command that caused the error occurred, the device was active or idle. After command completion occurred, registers were: ER ST SC SN CL CH DH -- -- -- -- -- -- -- 84 41 00 00 00 00 00 Error: ICRC, ABRT at LBA = 0x00000000 = 0 Commands leading to the command that caused the error were: CR FR SC SN CL CH DH DC Powered_Up_Time Command/Feature_Name -- -- -- -- -- -- -- -- ---------------- -------------------- 61 80 08 80 10 02 40 00 30d+11:40:19.568 WRITE FPDMA QUEUED 61 80 10 00 11 02 40 00 30d+11:40:19.567 WRITE FPDMA QUEUED 61 80 00 00 10 02 40 00 30d+11:40:19.566 WRITE FPDMA QUEUED 61 80 00 80 0f 02 40 00 30d+11:40:19.565 WRITE FPDMA QUEUED 61 80 08 00 78 f1 40 00 30d+11:40:19.561 WRITE FPDMA QUEUED Error 2 occurred at disk power-on lifetime: 13182 hours (549 days + 6 hours) When the command that caused the error occurred, the device was doing SMART Offline or Self-test. After command completion occurred, registers were: ER ST SC SN CL CH DH -- -- -- -- -- -- -- 84 41 00 00 00 00 00 Error: ICRC, ABRT at LBA = 0x00000000 = 0 Commands leading to the command that caused the error were: CR FR SC SN CL CH DH DC Powered_Up_Time Command/Feature_Name -- -- -- -- -- -- -- -- ---------------- -------------------- 61 80 08 00 13 7f 40 00 27d+09:28:58.029 WRITE FPDMA QUEUED 61 80 38 00 fa 7e 40 00 27d+09:28:58.028 WRITE FPDMA QUEUED 61 80 30 80 fd 7e 40 00 27d+09:28:58.027 WRITE FPDMA QUEUED 61 80 28 80 13 7f 40 00 27d+09:28:58.027 WRITE FPDMA QUEUED 61 80 20 80 12 7f 40 00 27d+09:28:58.027 WRITE FPDMA QUEUED Error 1 occurred at disk power-on lifetime: 4352 hours (181 days + 8 hours) When the command that caused the error occurred, the device was active or idle. After command completion occurred, registers were: ER ST SC SN CL CH DH -- -- -- -- -- -- -- 84 41 00 00 00 00 00 Error: ICRC, ABRT at LBA = 0x00000000 = 0 Commands leading to the command that caused the error were: CR FR SC SN CL CH DH DC Powered_Up_Time Command/Feature_Name -- -- -- -- -- -- -- -- ---------------- -------------------- 61 00 18 d0 aa cf 40 00 42d+03:40:30.866 WRITE FPDMA QUEUED 61 00 10 d0 a8 cf 40 00 42d+03:40:30.851 WRITE FPDMA QUEUED 61 00 08 d0 a6 cf 40 00 42d+03:40:30.851 WRITE FPDMA QUEUED 61 00 00 d0 a4 cf 40 00 42d+03:40:30.851 WRITE FPDMA QUEUED 61 08 38 58 b7 df 40 00 42d+03:40:30.850 WRITE FPDMA QUEUED DISK 12 (FAN BAY) ATA Error Count: 4 CR = Command Register [HEX] FR = Features Register [HEX] SC = Sector Count Register [HEX] SN = Sector Number Register [HEX] CL = Cylinder Low Register [HEX] CH = Cylinder High Register [HEX] DH = Device/Head Register [HEX] DC = Device Command Register [HEX] ER = Error register [HEX] ST = Status register [HEX] Powered_Up_Time is measured from power on, and printed as DDd+hh:mm:SS.sss where DD=days, hh=hours, mm=minutes, SS=sec, and sss=millisec. It "wraps" after 49.710 days. Error 4 occurred at disk power-on lifetime: 9633 hours (401 days + 9 hours) When the command that caused the error occurred, the device was active or idle. After command completion occurred, registers were: ER ST SC SN CL CH DH -- -- -- -- -- -- -- 40 41 00 00 00 00 00 Error: UNC at LBA = 0x00000000 = 0 Commands leading to the command that caused the error were: CR FR SC SN CL CH DH DC Powered_Up_Time Command/Feature_Name -- -- -- -- -- -- -- -- ---------------- -------------------- 60 00 00 f8 af 20 40 00 17:13:06.322 READ FPDMA QUEUED 60 08 00 f0 af 20 40 00 17:13:03.484 READ FPDMA QUEUED 60 00 00 f0 ab 20 40 00 17:13:03.480 READ FPDMA QUEUED 60 00 00 f0 a7 20 40 00 17:13:03.476 READ FPDMA QUEUED 60 f8 00 f8 a3 20 40 00 17:13:03.472 READ FPDMA QUEUED Error 3 occurred at disk power-on lifetime: 9633 hours (401 days + 9 hours) When the command that caused the error occurred, the device was active or idle. After command completion occurred, registers were: ER ST SC SN CL CH DH -- -- -- -- -- -- -- 40 41 00 00 00 00 00 Error: UNC at LBA = 0x00000000 = 0 Commands leading to the command that caused the error were: CR FR SC SN CL CH DH DC Powered_Up_Time Command/Feature_Name -- -- -- -- -- -- -- -- ---------------- -------------------- 60 00 00 f0 6b 20 40 00 17:13:03.147 READ FPDMA QUEUED 60 00 00 f0 67 20 40 00 17:13:00.240 READ FPDMA QUEUED 60 00 00 f0 63 20 40 00 17:12:58.043 READ FPDMA QUEUED 60 00 00 f0 5f 20 40 00 17:12:58.039 READ FPDMA QUEUED 60 00 00 f0 5b 20 40 00 17:12:58.035 READ FPDMA QUEUED Error 2 occurred at disk power-on lifetime: 9633 hours (401 days + 9 hours) When the command that caused the error occurred, the device was active or idle. After command completion occurred, registers were: ER ST SC SN CL CH DH -- -- -- -- -- -- -- 40 41 00 00 00 00 00 Error: UNC at LBA = 0x00000000 = 0 Commands leading to the command that caused the error were: CR FR SC SN CL CH DH DC Powered_Up_Time Command/Feature_Name -- -- -- -- -- -- -- -- ---------------- -------------------- 60 00 00 f8 37 20 40 00 17:12:57.939 READ FPDMA QUEUED 60 00 00 f8 33 20 40 00 17:12:55.096 READ FPDMA QUEUED 60 00 00 f8 2f 20 40 00 17:12:55.092 READ FPDMA QUEUED 60 00 00 f8 2b 20 40 00 17:12:55.088 READ FPDMA QUEUED 60 00 00 f8 27 20 40 00 17:12:55.079 READ FPDMA QUEUED Error 1 occurred at disk power-on lifetime: 9633 hours (401 days + 9 hours) When the command that caused the error occurred, the device was active or idle. After command completion occurred, registers were: ER ST SC SN CL CH DH -- -- -- -- -- -- -- 40 41 00 00 00 00 00 Error: UNC at LBA = 0x00000000 = 0 Commands leading to the command that caused the error were: CR FR SC SN CL CH DH DC Powered_Up_Time Command/Feature_Name -- -- -- -- -- -- -- -- ---------------- -------------------- 60 00 00 f0 0b 20 40 00 17:12:54.997 READ FPDMA QUEUED 60 00 00 f0 07 20 40 00 17:12:52.144 READ FPDMA QUEUED 60 00 00 f0 03 20 40 00 17:12:52.141 READ FPDMA QUEUED 60 00 00 f0 ff 1f 40 00 17:12:52.137 READ FPDMA QUEUED 60 00 00 f0 fb 1f 40 00 17:12:52.131 READ FPDMA QUEUED DISK 15 (EXTERNAL BAY) ATA Error Count: 73 (device log contains only the most recent five errors) CR = Command Register [HEX] FR = Features Register [HEX] SC = Sector Count Register [HEX] SN = Sector Number Register [HEX] CL = Cylinder Low Register [HEX] CH = Cylinder High Register [HEX] DH = Device/Head Register [HEX] DC = Device Command Register [HEX] ER = Error register [HEX] ST = Status register [HEX] Powered_Up_Time is measured from power on, and printed as DDd+hh:mm:SS.sss where DD=days, hh=hours, mm=minutes, SS=sec, and sss=millisec. It "wraps" after 49.710 days. Error 73 occurred at disk power-on lifetime: 4049 hours (168 days + 17 hours) When the command that caused the error occurred, the device was doing SMART Offline or Self-test. After command completion occurred, registers were: ER ST SC SN CL CH DH -- -- -- -- -- -- -- 84 53 70 47 57 14 40 Error: ICRC, ABRT 112 sectors at LBA = 0x00145747 = 1333063 Commands leading to the command that caused the error were: CR FR SC SN CL CH DH DC Powered_Up_Time Command/Feature_Name -- -- -- -- -- -- -- -- ---------------- -------------------- 35 00 40 78 56 14 e0 08 19d+14:10:47.052 WRITE DMA EXT 35 00 40 38 51 14 e0 08 19d+14:10:47.048 WRITE DMA EXT 25 00 08 c0 e6 68 e0 08 19d+14:10:47.048 READ DMA EXT 25 00 08 c8 97 1a e0 08 19d+14:10:47.032 READ DMA EXT 35 00 40 f8 4b 14 e0 08 19d+14:10:47.031 WRITE DMA EXT Error 72 occurred at disk power-on lifetime: 4049 hours (168 days + 17 hours) When the command that caused the error occurred, the device was doing SMART Offline or Self-test. After command completion occurred, registers were: ER ST SC SN CL CH DH -- -- -- -- -- -- -- 84 53 c1 66 d0 9f 40 Error: ICRC, ABRT 193 sectors at LBA = 0x009fd066 = 10473574 Commands leading to the command that caused the error were: CR FR SC SN CL CH DH DC Powered_Up_Time Command/Feature_Name -- -- -- -- -- -- -- -- ---------------- -------------------- 35 00 40 e8 cc 9f e0 08 19d+14:10:36.760 WRITE DMA EXT 35 00 40 a8 c7 9f e0 08 19d+14:10:36.737 WRITE DMA EXT 35 00 40 68 c2 9f e0 08 19d+14:10:36.736 WRITE DMA EXT 35 00 40 28 bd 9f e0 08 19d+14:10:36.734 WRITE DMA EXT 35 00 40 e8 b7 9f e0 08 19d+14:10:36.733 WRITE DMA EXT Error 71 occurred at disk power-on lifetime: 4049 hours (168 days + 17 hours) When the command that caused the error occurred, the device was doing SMART Offline or Self-test. After command completion occurred, registers were: ER ST SC SN CL CH DH -- -- -- -- -- -- -- 84 53 b1 fe c0 93 40 Error: ICRC, ABRT 177 sectors at LBA = 0x0093c0fe = 9683198 Commands leading to the command that caused the error were: CR FR SC SN CL CH DH DC Powered_Up_Time Command/Feature_Name -- -- -- -- -- -- -- -- ---------------- -------------------- 35 00 40 70 bf 93 e0 08 19d+14:10:25.846 WRITE DMA EXT 35 00 40 30 ba 93 e0 08 19d+14:10:25.834 WRITE DMA EXT 25 00 08 70 71 40 e0 08 19d+14:10:25.834 READ DMA EXT 35 00 40 f0 b4 93 e0 08 19d+14:10:25.833 WRITE DMA EXT 35 00 40 b0 af 93 e0 08 19d+14:10:25.805 WRITE DMA EXT Error 70 occurred at disk power-on lifetime: 4049 hours (168 days + 17 hours) When the command that caused the error occurred, the device was doing SMART Offline or Self-test. After command completion occurred, registers were: ER ST SC SN CL CH DH -- -- -- -- -- -- -- 84 53 f1 66 64 97 40 Error: ICRC, ABRT 241 sectors at LBA = 0x00976466 = 9921638 Commands leading to the command that caused the error were: CR FR SC SN CL CH DH DC Powered_Up_Time Command/Feature_Name -- -- -- -- -- -- -- -- ---------------- -------------------- 35 00 40 18 63 97 e0 08 19d+14:09:29.972 WRITE DMA EXT 35 00 40 d8 5d 97 e0 08 19d+14:09:29.957 WRITE DMA EXT 35 00 40 98 58 97 e0 08 19d+14:09:29.951 WRITE DMA EXT 35 00 40 58 53 97 e0 08 19d+14:09:29.943 WRITE DMA EXT 35 00 40 18 4e 97 e0 08 19d+14:09:29.937 WRITE DMA EXT Error 69 occurred at disk power-on lifetime: 4006 hours (166 days + 22 hours) When the command that caused the error occurred, the device was doing SMART Offline or Self-test. After command completion occurred, registers were: ER ST SC SN CL CH DH -- -- -- -- -- -- -- 84 53 30 d7 73 84 40 Error: ICRC, ABRT 48 sectors at LBA = 0x008473d7 = 8680407 Commands leading to the command that caused the error were: CR FR SC SN CL CH DH DC Powered_Up_Time Command/Feature_Name -- -- -- -- -- -- -- -- ---------------- -------------------- 35 00 40 c8 72 84 e0 08 17d+19:44:14.664 WRITE DMA EXT 25 00 08 78 bf b0 e0 08 17d+19:44:14.661 READ DMA EXT 25 00 08 70 c0 b0 e0 08 17d+19:44:14.660 READ DMA EXT 25 00 08 70 bf b0 e0 08 17d+19:44:14.660 READ DMA EXT 35 00 40 88 6d 84 e0 08 17d+19:44:14.656 WRITE DMA EXT
-
writing from what? My parity runs mainly from 1am until 5pm so I should get excellent speeds from 1am-10am when Plex isnt in use no? Nothing else should be burning up the writing.
-
I have been running a parity for about 10 days now (not sure how to check the full length because when it pauses and restarts it resets the page timer). The first 30% or so ran normal as far as I could tell (50-100MB/s, took about 1.5 days which makes sense as my normal parity runs take 4-7 days). It has been at 500KB/s-1MB/s since then. I am assuming I have a bad disk issue, however my DiskSpeed results are all where I expect them to be, maybe slightly slower... but nothing lower that 35MB/s)... nothing 600KB/s close. Any help would be much appreciated. This is the first parity I have run under unRAID 7 (don't think thats the issue but wanted to note it just in case). This is a 2 parity (14TB each), 18 drive array, all ZFS. 185TB of 210TB used. My last successful parity run was 4-5 days on 12/25/24 and averaged 35MB/s. Logs attached. Finally, I know those read/write numbers are pretty abysmal in general and would love to know if that just is what it is or if I can look into making that better at all? I guess I never really cared since it has 0 impact on Plex which is all its used for. hades-diagnostics-20250206-1745.zip
-
maybe not actually. strike that. I think my cache was full because the mover couldn't run its task since mover was already running doing this task. Still not sure. I keep the window open, its done so far: 300GB 100GB and about 1.5TB before just "stopping."
-
I wonder if there is a way to ignore a disk with the mover command? I think my issue is its loading up the cache drive, which then runs out of space. I noticed my cache drive was full last night.
-
Any guesses on why it would just stop running, didn't see anything in the system log. Oct 1 17:01:30 Hades root: move: /mnt/disk6/data/media/tv/The Witcher - Blood Origin (2022) {imdb-tt12785720}/Season 01/The Witcher Blood Origin (2022) - S01E02 - Of Dreams Defiance and Desperate Deeds [Release Sources (Streaming Service)_2_4 WEBDL-1080p][HDR10][EAC3 Atmos 5.1][HEVC]-NTb.nfo Success Oct 1 17:01:30 Hades root: move: /mnt/disk6/data/media/tv/The Witcher - Blood Origin (2022) {imdb-tt12785720}/Season 01/The Witcher Blood Origin (2022) - S01E02 - Of Dreams Defiance and Desperate Deeds [Release Sources (Streaming Service)_2_4 WEBDL-1080p][HDR10][EAC3 Atmos 5.1][HEVC]-NTb-thumb.jpg Success Oct 1 17:05:01 Hades root: move: /mnt/disk6/data/media/tv/The Witcher - Blood Origin (2022) {imdb-tt12785720}/Season 01/The Witcher Blood Origin (2022) - S01E03 - Of Warriors Wakes and Wondrous Worlds [Release Sources (Streaming Service)_2_4 WEBDL-1080p][HDR10][EAC3 Atmos 5.1][HEVC]-NTb.mkv Success Oct 1 17:05:01 Hades root: move: /mnt/disk6/data/media/tv/The Witcher - Blood Origin (2022) {imdb-tt12785720}/Season 01/The Witcher Blood Origin (2022) - S01E03 - Of Warriors Wakes and Wondrous Worlds [Release Sources (Streaming Service)_2_4 WEBDL-1080p][HDR10][EAC3 Atmos 5.1][HEVC]-NTb.nfo Success Oct 1 17:05:01 Hades root: move: /mnt/disk6/data/media/tv/The Witcher - Blood Origin (2022) {imdb-tt12785720}/Season 01/The Witcher Blood Origin (2022) - S01E03 - Of Warriors Wakes and Wondrous Worlds [Release Sources (Streaming Service)_2_4 WEBDL-1080p][HDR10][EAC3 Atmos 5.1][HEVC]-NTb-thumb.jpg Success Oct 1 17:05:06 Hades root: move: /mnt/disk6/data/media/tv/The Witcher - Blood Origin (2022) {imdb-tt12785720}/Season 01/The Witcher Blood Origin (2022) - S01E04 - Of Mages Malice and Monstrous Mayhem [Release Sources (Streaming Service)_2_4 WEBDL-1080p][HDR10][EAC3 Atmos 5.1][HEVC]-NTb.mkv Success Oct 1 17:05:07 Hades root: move: /mnt/disk6/data/media/tv/The Witcher - Blood Origin (2022) {imdb-tt12785720}/Season 01/The Witcher Blood Origin (2022) - S01E04 - Of Mages Malice and Monstrous Mayhem [Release Sources (Streaming Service)_2_4 WEBDL-1080p][HDR10][EAC3 Atmos 5.1][HEVC]-NTb.nfo Success Oct 1 17:05:07 Hades root: move: /mnt/disk6/data/media/tv/The Witcher - Blood Origin (2022) {imdb-tt12785720}/Season 01/The Witcher Blood Origin (2022) - S01E04 - Of Mages Malice and Monstrous Mayhem [Release Sources (Streaming Service)_2_4 WEBDL-1080p][HDR10][EAC3 Atmos 5.1][HEVC]-NTb-thumb.jpg Success Oct 1 22:06:01 Hades monitor_nchan: Stop running nchan processes Oct 1 23:05:53 Hades emhttpd: spinning down /dev/sdm Oct 1 23:05:53 Hades emhttpd: spinning down /dev/sdj Oct 1 23:05:53 Hades emhttpd: spinning down /dev/sdu Oct 1 23:05:53 Hades emhttpd: spinning down /dev/sdf Oct 1 23:05:53 Hades emhttpd: spinning down /dev/sdl I just restarted it but it only moved about 300GB of 8TB before it stopped.
-
cool and thank you! so, mover start -e diskN |& logger & or do I have too many "&"? where N = my disk number I need to move I just want to make sure I have the logging part right to.
-
Is there a specific place to go to do the move/empty a drive? I didn't see anything specific in file browser or scheduler.
-
Will it move the data across multiple disks? Also, is it pretty stable? I know its beta, I am not shy for trying to use betas but it also hasn't been updated since July so wasn't sure how safe it is to use.
-
I ended up reseting my router and started working again. What I don't understand is I imported my settings back and it still worked. I will keep an eye on it but it seems fine now.
-
I am in the process of trying to move my drives to ZFS however it has been a painful process as I don't have anymore slots in my server to expand. I have 13 of 18 drives as ZFS (from XFS). The remaining 5 are 2x 14TB and 3x 8TB. I have been using unbalanced but with only 19TB free it's been kind of a messy ordeal getting it to work. The process takes over a week or two to move the data off the drive, it usually fails 5-10 times throughout the process. One time I ended up duplicating a ton of data (6tbs worth) and just wondering if there is a best way to do it? So I shut down all my dockers except critical ones (like Plex) so nothing is writing to my array for the time it's being done? Should I do smaller batches? Any better way to clear drives when you don't have a ton of space available to easily clear the drives too?
-
Might be above my pay grade here (not a network guy, just know basics) so please bear with me haha. so, originally I had stuff set manually without issue. My old router I had the IP set to static and it’s currently set to static as well, the only thing that changed was the actual IP but I changed it everywhere (dockers/configs etc). Since I deleted my old network config everything is back to “default” in unraid network settings and it’s still getting the right IP from my router. everything works as it should I just can’t locally browse it. What I don’t understand is why it worked for 2 days… im 80% sure it’s my router I just don’t know what I did…
-
I have restarted the router. Restarted the modem. My IP is static (10.10.1.2) and my router sees it fine (10.10.1.1). ping results: laptop to unraid fails unraid to laptop fails unraid to google.com works fine I have deleted the network.cfg. It’s got to be some cache thing or something because it worked for 2 days and I didn’t change anything. This am I enabled my guest network (not saying this caused it but mentioning what I did). I have since disabled that again. So far, every device on my network has a static IP as I’ve been adding things 1 by 1 and assigning IPs. everything works as it should in unraid, I just can’t connect to it via lan or wan.
-
what I don't get is it worked for 2 days. I did not make a router change this AM and it stopped connecting.
-
It can not ping other clients but can ping google.com. Network isolation isn't available on my router (as far as I can tell). Supposedly its only a setting on the guest network but I disabled that anyways.
-
yes. Most of my stuff has static ips as well, so for instance my laptop is 10.10.1.3. My phone is 10.10.1.15. I also noticed unraid connect doesn't load, lan or wan link. Web GUI works fine locally. Not sure that helps with figuring out what I mucked up though.
-
255.255.255.0 is the subnet mask ip set to 10.10.1.1
-
this appears to be strictly local. from unraid I can ping google. from unraid I can not ping my laptop. From my laptop I can not ping unraid. I am so lost right now on this. I am sure it's my new router I just don't know what's missing. Is a port forward needed for unraid? My server uses no port number, so I typically browse to 10.10.1.2 (static ip)
-
I also deleted the network.cfg file to have it recreate. still no luck
-
It is not ping able and I can connect to the gui locally (I really need to buy a dedicated monitor for that, what a PITA that was haha). Armor is off. i did notice my network config file had a different IP and a different DNS from my router, using 1.1.1.1 and unraid had I believe google set 8.8.8.8. That said, the IP was from years back so not really sure if that mattered anyways. I changed the dns in the file. Still not pinging
-
Status: My server connects, all dockers are online but I can't connect to my unraid server from my network. Background: On Sunday I installed a new Router (Netgear Orbi 960). All worked and I could connect to my server. Yesterday I noticed some slow downs connecting to my server if SAB was running. I assumed it was maybe some router setting I forget to grab from my prior Orbi setup. If I paused the downloads unraid would return to speed and you could connect to it. Today however, I can't access unraid at all. My dockers come online, so I honestly have 0 clue what it happening. I can't browse to it via my Mac or windows box. I know unraid is online because I can see all my dockers and my push notifications are showing I have a parity check running (I did a hard reboot when I thought the system was fully locked out). Any thoughts on this? In the unraid.net account page I see this: "Server registration must be started from your Unraid webgui. If you did and you received this message please try the following before contacting support:"
-
no clue. It just creates an empty folder that was where I stored software, which makes it even more cryptic as that location had no automation in it (as in tools were not pointing towards it at all.
-
would the creation of that share be in my logs somewhere? As in, if I delete the share, and check daily until it shows backup would it show what made it somewhere in the logs?
-
Sorry, meant to mention that before. I have no mappings to that location in dockers. I also checked a few apps to see if I had something linked there, like sabnzb. I do not. I also verified backup plugins and nothing is pointing to it.

