





dclive
Members
-
Joined
-
Last visited
-
Is there a quick setup guide that tells step by step what to do and how to get the best use out of it? I set up a subnet and told AI to run an analysis of it (ongoing) but am not really sure I'm getting full use out of it.
-
My issue is resolved. I had a /mnt/remote volume that was SMB mounted that dropped off the network for a while. Which begs the question: another device dropping from the network shouldn't be able to take down or negatively impact this device, right? Why is there such a negative impact when the remote SMB device went down? Sure, browsing that directory should be a mess, but why was so much of my Unraid environment negatively impacted?
-
After the 7.2.2 -> 7.2.4 upgrade, I now experience docker and other GUI-related hangs: If I go to the docker tab, I get the Unraid (please wait) logo while it thinks ...for minutes at a time. Sometimes, eventually, it will return a list of my docker containers. On the main Dashboard tab, the docker objects simply don't show up anymore. In all cases, the docker containers themselves are still working - I can open one and it works great. Settings is VERY slow to load. Since the upgrade I've not even been able to get in to modify anything there (like enabling SSH...sigh). I'm not happy with these new changes. :(
-
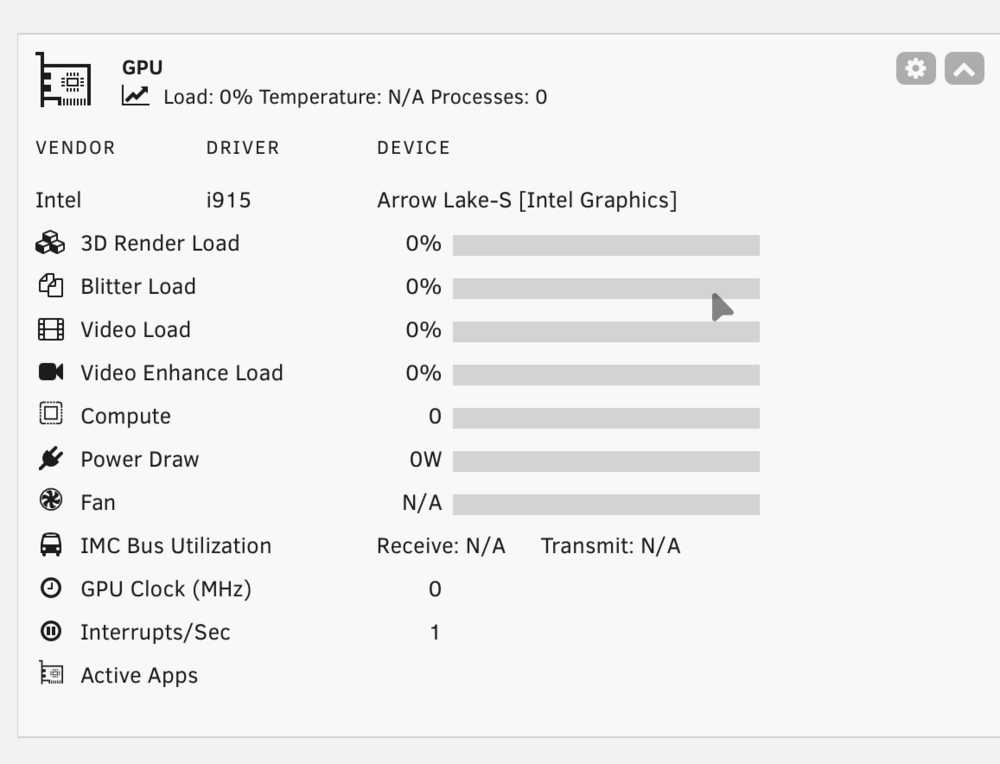
I have basically the same problem. I updated from an i7-8700k to a i5-14600k (where gpu reporting worked great) to an Ultra Core 2 265K, where all of the fields are blank. Unraid 7.2.3, and the gpu plugins are all updated to current as of 12.26.25. Here’s my cat gpu raw data output: root@Tower:/tmp# cat gpurawdata0000\:00\:02.0 "[\n\n{\n\t\"period\": {\n\t\t\"duration\": 11.801962,\n\t\t\"unit\": \"ms\"\n\t},\n\t\"frequency\": {\n\t\t\"requested\": 0.000000,\n\t\t\"actual\": 0.000000,\n\t\t\"unit\": \"MHz\"\n\t},\n\t\"interrupts\": {\n\t\t\"count\": 0.000000,\n\t\t\"unit\": \"irq\/s\"\n\t},\n\t\"rc6\": {\n\t\t\"value\": 0.000000,\n\t\t\"unit\": \"%\"\n\t},\n\t\"power\": {\n\t\t\"GPU\": 0.000000,\n\t\t\"Package\": 19.067730,\n\t\t\"unit\": \"W\"\n\t},\n\t\"engines\": {\n\t\t\"Render\/3D\": {\n\t\t\t\"busy\": 0.000000,\n\t\t\t\"sema\": 0.000000,\n\t\t\t\"wait\": 0.000000,\n\t\t\t\"unit\": \"%\"\n\t\t},\n\t\t\"Blitter\": {\n\t\t\t\"busy\": 0.000000,\n\t\t\t\"sema\": 0.000000,\n\t\t\t\"wait\": 0.000000,\n\t\t\t\"unit\": \"%\"\n\t\t},\n\t\t\"Video\": {\n\t\t\t\"busy\": 0.000000,\n\t\t\t\"sema\": 0.000000,\n\t\t\t\"wait\": 0.000000,\n\t\t\t\"unit\": \"%\"\n\t\t},\n\t\t\"VideoEnhance\": {\n\t\t\t\"busy\": 0.000000,\n\t\t\t\"sema\": 0.000000,\n\t\t\t\"wait\": 0.000000,\n\t\t\t\"unit\": \"%\"\n\t\t},\n\t\t\"Compute\": {\n\t\t\t\"busy\": 0.000000,\n\t\t\t\"sema\": 0.000000,\n\t\t\t\"wait\": 0.000000,\n\t\t\t\"unit\": \"%\"\n\t\t}\n\t},\n\t\"clients\": {\n\n\t}\n}\n{\n\t\"period\": {\n\t\t\"duration\": 1010.531708,\n\t\t\"unit\": \"ms\"\n\t},\n\t\"frequency\": {\n\t\t\"requested\": 0.000000,\n\t\t\"actual\": 0.000000,\n\t\t\"unit\": \"MHz\"\n\t},\n\t\"interrupts\": {\n\t\t\"count\": 0.989578,\n\t\t\"unit\": \"irq\/s\"\n\t},\n\t\"rc6\": {\n\t\t\"value\": 0.000000,\n\t\t\"unit\": \"%\"\n\t},\n\t\"power\": {\n\t\t\"GPU\": 0.000000,\n\t\t\"Package\": 13.444708,\n\t\t\"unit\": \"W\"\n\t},\n\t\"engines\": {\n\t\t\"Render\/3D\": {\n\t\t\t\"busy\": 0.000000,\n\t\t\t\"sema\": 0.000000,\n\t\t\t\"wait\": 0.000000,\n\t\t\t\"unit\": \"%\"\n\t\t},\n\t\t\"Blitter\": {\n\t\t\t\"busy\": 0.000000,\n\t\t\t\"sema\": 0.000000,\n\t\t\t\"wait\": 0.000000,\n\t\t\t\"unit\": \"%\"\n\t\t},\n\t\t\"Video\": {\n\t\t\t\"busy\": 0.000000,\n\t\t\t\"sema\": 0.000000,\n\t\t\t\"wait\": 0.000000,\n\t\t\t\"unit\": \"%\"\n\t\t},\n\t\t\"VideoEnhance\": {\n\t\t\t\"busy\": 0.000000,\n\t\t\t\"sema\": 0.000000,\n\t\t\t\"wait\": 0.000000,\n\t\t\t\"unit\": \"%\"\n\t\t},\n\t\t\"Compute\": {\n\t\t\t\"busy\": 0.000000,\n\t\t\t\"sema\": 0.000000,\n\t\t\t\"wait\": 0.000000,\n\t\t\t\"unit\": \"%\"\n\t\t}\n\t},\n\t\"clients\": {\n\n\t}\n}]\n" It always shows this even when Plex is using hw transcode.
-
Having similar issues here. Sometimes my webgui just doesn't respond (meaning unraid's; Plex's and etc. are fine), and IO performance takes a negative hit. I just installed Glances (thanks!) and will monitor iowait now.
