


martial
Members
-
Joined
Everything posted by martial
-
That log looks very bare, as if nothing happened. The previous step completed (installing torch), then it goes into installing Comfy's requirements.txt which should run uv pip install -r and be a little bit more verbose, especially in case of error. Here it is like it was not able to start the command.
-
When you deleted the run folder you downloaded a fresh install of ComfyUI during the next startup, so we can expect this to be something else. Doing a quick gpt search seems to say that it might be a CPU issue and you might have to compile kornia from source. You can try to use the userscript (check the README for instructions) to attempt to run the build manually: /comfy/mnt/venv/bin/pip install kornia-rs --force-reinstall --no-cache-dir --no-binary :all: (also copied from the GPT answer)
-
The crash comes from ComfyUI itself so I would not be able to comment too much on what the issue is. When I see this kind of behavior, I rename the run folder to run.old and re-run the container which will re-create a new installation. In general this fixed things for me, knowing that the custom nodes and images are in basedir, everything in "run" should be able to be deleted.
-
The error I see in there is RuntimeError: Detected that PyTorch and TorchAudio were compiled with different CUDA versions. PyTorch has CUDA version 13.0 whereas TorchAudio has CUDA version 12.9. Please install the TorchAudio version that matches your PyTorch version. You said you have a Blackwell card. I would try with the CUDA 13.2 container, not the 13.0 (or are you trying 12.9)?
-
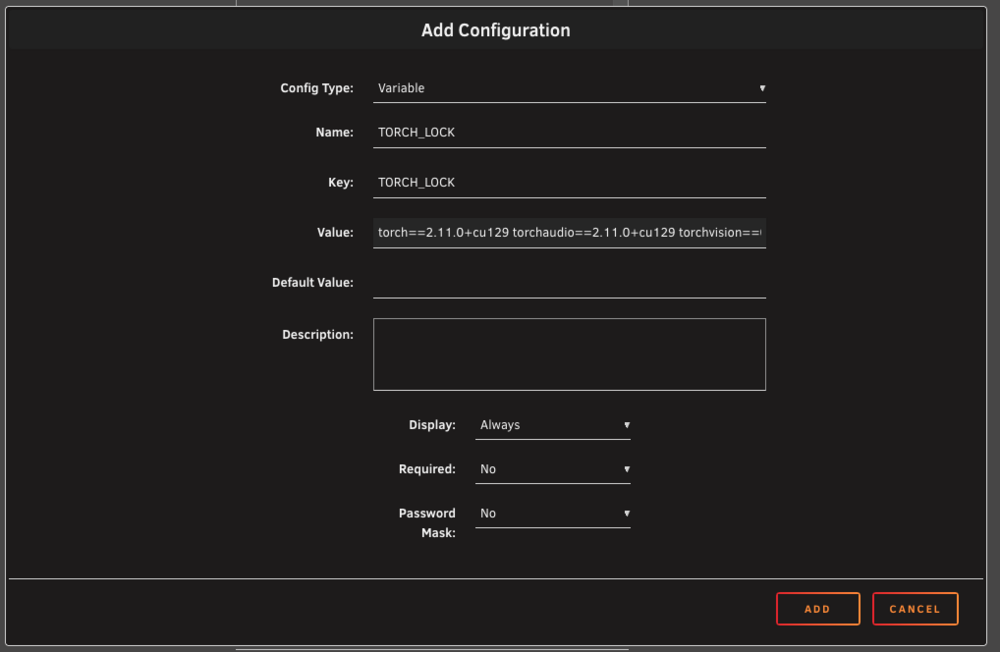
And you are not using TORCH_LOCK, correct? In your case, my belief is that Torch is trying to update to 2.12 but as noted above, they dropped support for CUDA 12.8 in Torch 2.12 Details: "Introducing CUDA 13.2 and Deprecating CUDA 12.8 (Release 2.12)" https://dev-discuss.pytorch.org/t/introducing-cuda-13-2-and-deprecating-cuda-12-8-release-2-12/3337 The two options I would recommend are either: 1) use TORCH_LOCK=torch==2.9.1+cu130 torchvision==0.24.1+cu130 torchaudio==2.9.1+cu130or a more recent Torch (as long as you get the right combination, I am not sure what it is honestly :) ) 2) change the base container from ubuntu24-cuda12.8 to a more recent one. Important note: latest is likely going to move from CUDA 12.8 to CUDA 12.9 because of that (likely this week end)
-
Is everyone having a problem on 7.3.1?
-
Understood, maybe other will encounter the same issue and report their solution. I do not have the issue or am able to reproduce it currently, so I can not help further.
-
In the Settings/nvidia-driver page of my Unraid, I see in the GPU Driver Support a note: Supported candidates: 580.159.03, 590.48.01, 595.71.05, 595.80, 610.43.02 Recommended Driver: 595.71.05 (open-source) Apparently I am running the expected "recommended" driver.
-
The thing is that it should not be fighting you at all ... I run 3x instances of the container with my primary on an RTX 4090 Linux Mint using the CUDA 13.2 base and it works fine. The container's part appear to be working: it installs ComfyUI, then starts it, it is ComfyUI that then crash (I did not see anything wrong in the logs that you shared with us). The 3090 supports the latest driver with CUDA 13.2 I believe. If you ssh into your Unraid --or use the >_ terminal-- and type nvidia-smi you will see by the top the max version of CUDA that the host (and therefore container runtime) can support, my Unraid runs Driver Version: 595.71.05 CUDA Version: 13.2 (ie I have not yet upgraded to the 610.43.02 driver that appears to be available) so I can use the 13.2 version (and do not use TORCH_LOCK) From the release notes, I do not see any expected issue but maybe others that have a more recent driver can say what they see? https://forums.developer.nvidia.com/t/610-release-feedback-discussion/371356
-
Importantly it also tells us that Comfy started so your installation is (from the view of the container's purpose) clean
-
That error just tells us that ComfyUI exited with an error. Everything in the second log is just normal ComfyUI starting with PyTorch 2.11.0+cu129 and Comfy 0.23.0 "when" it fails is shows the line that caused the error, here the call to Comfy which is normal. If you are comfortable with this, can you delete the container (do not delete the folder where your files are in /mnt/usr/appdata). Then move the run folder that should be in /mnt/user/appdata/comfyui-nvidia/mnt to "mnt.old" (not the basedir, it contains your generations and models) From that Community Apps, reinstall a new ComfyUI, use at least CUDA 12.9 and it should recreate the "mnt" folder with a fresh installation?
-
The image uploaded should have the right info (apparently it did not copy): Beyond that you should have nothing to do, the tool create a venv specific to the "ubuntu24-cuda12.9" at first start.

-
Keep in mind if you use the template that you can select the CUDA version you want to run against. I have made 12.8 the default but with the depreciation of 12.8 for PyTorch I might be forced to make 12.9 the default "latest" shortly. It is recommended to manually select which version of CUDA you want to run against (if your Unraid Nvidia driver is up to date you should be able to run 13.2 ). You can find it from the same "edit" page as "Repository": The list of possible values is in the table at https://github.com/mmartial/ComfyUI-Nvidia-Docker

-
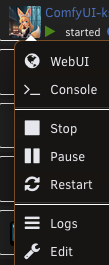
I run the ubuntu24_cuda12.9 version on Unraid. It uses: torch==2.11.0+cu129 torchaudio==2.11.0+cu129 torchvision==0.26.0+cu129 From the "Docker" tab, click on the application icon and use "Edit" So I could add "Add another Path, Port, Variable, Label or Device" with the following parameters:
-
Good news is that cu132 finally has it own download page https://download.pytorch.org/whl/cu132 Bad news ... uv does not yet support it, so not moving yet
-
I think I see a potential issue:"Introducing CUDA 13.2 and Deprecating CUDA 12.8 (Release 2.12)" https://dev-discuss.pytorch.org/t/introducing-cuda-13-2-and-deprecating-cuda-12-8-release-2-12/3337
-
I see: TorchAudio 2.11 "this release is compatible with torch 2.11 and is compatible with future versions of torch."
-
If the Nvidia driver was updated, the tool should not attempt to do a fresh reinstall of the run folder. It is only if the base container has changed that a new venv should be created PyTorch upgrade if a new version is available and you have DISABLE_UPGRADES disabled. When it installs, the == Installing torch using uv with backend: cu130 shows the backend used. I expect what is happening is that a new version of Torch was released, but the corresponding TorchAudio was not yet and the restart caused the issues you are facing. The solution would likely be to use the TORCH_LOCK environment variable (which is not enabled by default) and specify the exact version of all 3x primary packages to install. For example: TORCH_LOCK=torch==2.9.1+cu130 torchvision==0.24.1+cu130 torchaudio==2.9.1+cu130 I run the CUDA 13.2 version, so if I do: # Adapt your container name % docker exec -it comfyui-nvidia /bin/bash % sudo su -l comfy # As comfy % source /comfy/mnt/venv/bin/activate % pip freeze | grep torch I get torch==2.12.0+cu130 torchaudio==2.11.0+cu130 [...] torchvision==0.27.0+cu130giving me the values which I could use with TORCH_LOCKenvironment variable. The fact that a TorchAudio release is out of sync with Torch is unfortunately outside of my control. I would usually check the table on: GitHubGitHub - pytorch/vision: Datasets, Transforms and Models...Datasets, Transforms and Models specific to Computer Vision - pytorch/vision https://github.com/pytorch/audio From this research I see that Audio is going in maintenance mode but it is still a dependency for ComfyUI per https://github.com/Comfy-Org/ComfyUI/blob/master/requirements.txt
-
FYSA, I believe it is not just you, it is an issue with using the legacy manager UI apparently. I also have it occur to me. The options are to disable the LEGACY webui temporarily or delete the run folder(what I did) so Comfy update. I do not believe the patch as been merged yet https://github.com/Comfy-Org/ComfyUI-Manager/issues/2880 From it I expect the temporary solution is to set ENABLE_MANAGER_LEGACY_UI to false
-
Hello, I was looking at using the "Obsidian-LiveSync-CouchDB" template and just wanted to note that there should be an additional path added to the template: On the original GH page, teh compose has it but not the default docker line: volumes: - ${COUCHDB_DATA}:/opt/couchdb/data
-
There is a way to do this using a built-in solution from the container itself: the "UserScripts" folder. https://github.com/mmartial/ComfyUI-Nvidia-Docker#533-userscripts_dir You would need to add a mount to the location in your unraid template then copy the script you want to enable (here the SageAttention one) then make it executable. During the next restart, the initialization script will see it (check the logs) and attempt to install it for you. I am giving a brief "how to" as the longer one is listed in the documentation.
-
I think you might be able to achieve it The tool only expose the port needed by Comfy but you could add an exported port for 7860 as long as the service is started on that port. You will need to rebuild the tool to add the expose port but that can be done from a Dockerfile "FROM" so luckily fairly easily
-
According to the recent ComfyUI blog post, I believe that the answer is yes ACE-Step 1.5 is Now Available in ComfyUICommercial-grade music generation on consumer hardware You would need to update your comfy using the manager first, but check out the "For ComfyUI Desktop & Local Users" section
-
This is something I was worried about AFTER I released the update. I am going to remove it from the template for now and will fix it in a future update. For fresh installs you still need to start the container twice before it can have modified the settings (1st load) and used them (2nd load).
-
This is normal, the tool does not take arguments directly, they have to be passed through environment variables existing in the template. If you look, you should find a COMFY_CMDLINE_EXTRA for Extra command-line options for ComfyUI; this is where you would use those command line arguments.


