martial
Members
-
Joined
Everything posted by martial
-
Unfortunately, this is not the purpose of the tool. If subtrans can be run as a Docker container, I would investigate a tool like Dokge or Dockemon (which are in the App Catalog) to start the service.
-
Thank you for that. In my case the servers.conf include is the last line in my configuration file. The `/etc/rc.d/rc.nginx restart` confirms that the syntax is okay too ;)
-
Instead of killing all nginx, I was looking for the master process (ie not the ones run by containerd-shim-runc-v2) So far the simpler way I found is to run: ps -axfo pid,ppid,uname,cmd | grep nginx | grep -v '\\_' ie get the hierarchy of processes and remove the ones started by another process. This returns only one value so far. You can then kill the process and /etc/rc.d/rc.nginx start it again
-
One thing that I have noticed is that when I access the Dashboard directly from NPM, I might have it happen. When I access that same dashboard from a CloudFlare tunnel, I have not seen it happen yet.
-
I see a new "Preview" version in the community apps; what is the use of this one versus the existing plugin?
-
The error seems to only trigger for me when I leave a browser open on the Dashboard page (I have not seen it yet on the Docker page or VM page, for example), so as long as I close the browser tab, I do not get the empty dashboard/main. I can still ssh into it and start the script manually if/when it happens, so no user scripts are needed. I only use it when needed
-
Not sure if this request was for the script I use? If it is, I just put a copy on GH, here is a direct link to it https://raw.githubusercontent.com/mmartial/unraid-study/main/varlog_nginx.sh
-
Yes, I was looking for a simple pastebin solution, without a DB, and that could do text and binaries ... and the simple word combination was useful. I tried it and started to wonder why the UI was missing some of the features from the webpage, so I checked
-
Happy to do so. Please bear with me, as it might take a couple of days as I am out of town
-
I updated to the Unraid connect released Today (2024-01-09) and signed in. I have two additional "extra origins" to add (Nginx Proxy Manager over WireGuard + CloudFlare Tunnel). I followed the instructions "Provide a comma separated list of urls that are allowed to access the unraid-api (https://abc.myreverseproxy.com,https://xyz.rvrsprx.com,…)" accordingly (comma separated, no space) but I get the red shield with "The CORS policy for the unraid-api does not allow access from the specified origin." asking me to add the value to the "extra origins" line as I have already done. Am I doing this incorrectly?
-
For people using Apprise and seeing a large amount of memory used by the tool, this is because "# Workers are relative to the number of CPUs provided by hosting server" The default formula is "multiprocessing.cpu_count() * 2 + 1", which, for high CPU hosts, creates a lot of copies of the apprise worker and, therefore, memory usage. This number can be limited by adding a new "Container Variable" named "APPRISE_WORKER_COUNT" and entering a value. Hoping this helps others
-
For people using microbin, I recommend modifying the "AppData" directory within the container to "/app" so that the files are not stored only within the container (and would not survive a container update, therefore) Also, you can add environment variables as described in https://microbin.eu/docs/installation-and-configuration/configuration/ to enable things like <Config Name="MICROBIN_ENCRYPTION_CLIENT_SIDE" Target="MICROBIN_ENCRYPTION_CLIENT_SIDE" Default="false" Mode="" Description="Enables server-side encryption. https://microbin.eu/docs/installation-and-configuration/configuration/" Type="Variable" Display="always" Required="false" Mask="false">true</Config> <Config Name="MICROBIN_DISABLE_TELEMETRY" Target="MICROBIN_DISABLE_TELEMETRY" Default="false" Mode="" Description="Disables telemetry if set to true" Type="Variable" Display="always" Required="false" Mask="false">true</Config> <Config Name="MICROBIN_ENCRYPTION_SERVER_SIDE" Target="MICROBIN_ENCRYPTION_SERVER_SIDE" Default="false" Mode="" Description="Enables client-side encryptio" Type="Variable" Display="always" Required="false" Mask="false">true</Config> <Config Name="MICROBIN_PRIVATE" Target="MICROBIN_PRIVATE" Default="true" Mode="" Description="Enables private pastas" Type="Variable" Display="always" Required="false" Mask="false">true</Config> <Config Name="MICROBIN_GC_DAYS" Target="MICROBIN_GC_DAYS" Default="90" Mode="" Description="Sets the garbage collector time limit. Pastas not accessed for N days are removed even if they are set to never expire. Default value: 90. To turn off GC: 0." Type="Variable" Display="always" Required="false" Mask="false">0</Config> <Config Name="MICROBIN_ENABLE_BURN_AFTER" Target="MICROBIN_ENABLE_BURN_AFTER" Default="0" Mode="" Description="Sets the default burn after setting on the main screen. Default value: 0. Available expiration options: 1, 10, 100, 1000, 10000, 0 (= no limit)" Type="Variable" Display="always" Required="false" Mask="false">0</Config> <Config Name="MICROBIN_PUBLIC_PATH" Target="MICROBIN_PUBLIC_PATH" Default="" Mode="" Description="Add the given public path prefix to all urls. This allows you to host MicroBin behind a reverse proxy on a subpath. You need to set the public path for QR code sharing to work." Type="Variable" Display="always" Required="false" Mask="false">https://yoururl/</Config> <Config Name="MICROBIN_QR" Target="MICROBIN_QR" Default="false" Mode="" Description="Enables generating QR codes for pastas. This feature requires the public path to also be set." Type="Variable" Display="always" Required="false" Mask="false">true</Config> <Config Name="MICROBIN_DEFAULT_EXPIRY" Target="MICROBIN_DEFAULT_EXPIRY" Default="24hour" Mode="" Description="Sets the default expiry time setting on the main screen. Default value: 24hour Available expiration options: 1min, 10min, 1hour, 24hour, 1week, never" Type="Variable" Display="always" Required="false" Mask="false">never</Config> I am adding a copy of my modified XML file for those interested. Hoping this helps some -- M microbin.xml
-
FYSA, Dozzle changed how they do authentication. https://github.com/amir20/dozzle/issues/2630 explains the simple changes to create a configuration file to replace the environment parameters. You will need a new "Container Path" for /data where you will put the "users.yml" file. You will also need to remove the "Username" and "Password" fields from the template for Dozzle to start
-
FYSA, CryptPad stopped using the Promascu dockerhub and created their own over the summer. They do not have a "latest" build, but I got the 5.6.0 version of cryptpad running by: - updating the "repository" to "cryptpad/cryptpad:version-5.6.0" - changing the "registry url" to "https://hub.docker.com/r/cryptpad/cryptpad/" - adding a "CPAD_CONF" environment variable pointing to "/cryptpad/config/config.js" Hoping this helps others
-
Got it happening again, used it to clear the logs. The df confirms that worked Unfortunately the dashboard or main page are empty of content, so the next step is to restart nginx I tried the steps in pkill -9 nginx /etc/rc.d/rc.nginx start but the dashboard and main were still not updating with live data ... after a couple of minutes the data was showing up again the "/var/log/nginx/error.log" has many of those "nchan: Out of shared memory while allocating channel /cpuload. Increase nchan_max_reserved_memory" so use: pkill -9 nginx > /var/log/nginx/error.log & > /var/log/nginx/error.log.1 /etc/rc.d/rc.nginx start To get a more reasonably sized "df -h /var/log" I put all this in a small shell script (attached to this post), hopefully this can help others varlog_nginx.sh
-
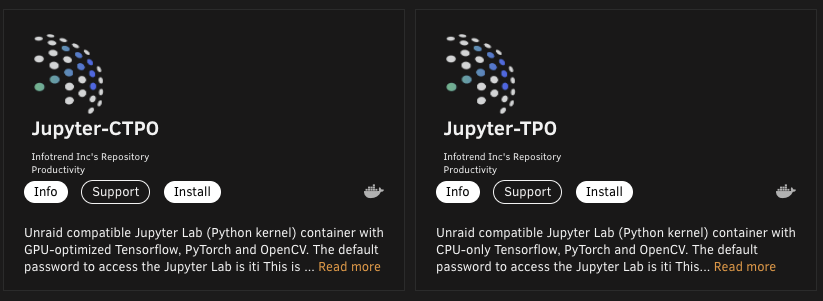
December 2023 update: Please note that a new version under a different location and repository is available. Please search for Jupyter-CTPO and Jupyter-TPO, added to the CA in early December 2023
-
FYSA: I am the person who built this container and also the original author of the previous version.
-
Just a quick update. I now access the UI from a CloudFlare Tunnel, not a Nginx Proxy Manager proxy. I also close the tab to the dashboard after I am done using it. So far, the log has not shown any sign of growth.
-
if it happens again I will try that. One thing I have found in the past from searching the "nchan_max_reserved_memory" error is that it seems to happens if you leave a tab open onto the dashboard. If you close that tab (and reopen a new one later) people in other threads seem to indicate that helps
-
Out of curiosity I checked mine and I see 70K of those nchan_max_... errors too I overwrote the file (> /var/log/syslog) and /etc/rc.d/rc.syslog restart and within a minute I already see another 100 of those errors And sadly that did not reduce the size of /var/log tmpfs 128M 47M 82M 37% /var/log also now the items on my dashboard are not updating anymore, so reboot time
-
I too have a tab always open in Firefox to my dashboard, but I have been seeing less of my logs filling lately (logs still at 14% after 16 days -- awaiting a few more days to see the list of issues on 6.12.4) The two things I did were to use CloudFlare tunnels to reach my dashboard (Cloudflare Zero Trust with a 6 digits pin sent to a selected email to give me access to the dasahboard and selected services) vs accessing it from Nginx Proxy Manager (NPM), and I have increased the memory allocated to NPM in the extra parameters: --memory=4G from 1G Hopefully others can reproduce this
-
I just upgraded from 6.12.2 to 6.12.3 I had the plugin enabled before the upgrade (as well as the Tailscale docker container) and could access my Docker containers URLs over Nginx Proxy Manager After rebooting I lost the means to access any of those urls Luckily I also had CloudFlareD to access my main UI, and I have removed the plugin and I can once again access my URLs I am unclear why I was prevented from accessing anything with the plugin enabled (tailscale1 [the plugin interface] was added in the "Include listening interfaces:", I checked) Any insight into this would be appreciated
-
The actual fix was to use the change that was introduced in 6.12
-
@FlyingTexan Which of the "cloudflared" version in "apps" do you recommend? I ended up using "CloudflaredTunnel" which uses the "cloudflare/cloudflared" container. Thanks for the recommendation.
-
On 6.12.2 and similar error: Jul 13 17:34:17 kasumi nginx: 2023/07/13 17:34:17 [crit] 35027#35027: ngx_slab_alloc() failed: no memory Jul 13 17:34:17 kasumi nginx: 2023/07/13 17:34:17 [error] 35027#35027: shpool alloc failed Jul 13 17:34:17 kasumi nginx: 2023/07/13 17:34:17 [error] 35027#35027: nchan: Out of shared memory while allocating message of size 233. Increase nchan_max_reserved_memory. Jul 13 17:34:17 kasumi nginx: 2023/07/13 17:34:17 [error] 35027#35027: *5835100 nchan: error publishing message (HTTP status code 500), client: unix:, server: , request: "POST /pub/wireguard?buffer_length=1 HTTP/1.1", host: "localhost" Jul 13 17:34:17 kasumi nginx: 2023/07/13 17:34:17 [error] 35027#35027: MEMSTORE:01: can't create shared message for channel /wireguard Restarted nginx but no luck, will restart the OS next. I also tried to see if it was maybe Nginx Proxy Manager, but the /pub location makes me think I have a browser on another computer logged into the dashboard, causing this issue. Could we get a list of remote connections to the dashboard and shut them down manually?