coppit
Community Developer
-
Joined
-
Last visited
Everything posted by coppit
-
I recently had a regression in my VM performance. I was getting crackling audio, and my mouse would occasionally stop responding. This is with those devices being on a passed-through USB controller. What was happening is that some of the IRQs for the VM were being processed on other cores on the host. This causes a huge latency spike as things have to cross the CCD (core complex die) boundary. I figured out some manual bash commands, and was about to put it into a user script when I saw that I already had a general purpose script to do this! I speculate that docker containers are taking longer to start, so the script was being run before the VMs booted, which caused it to do nothing. I modified the script to wait up to 5 minutes for the VMs to boot. I can't remember if I wrote the script or got it from somewhere. Apologies if you wrote it and I'm not giving you credit. Attached is my updated version. set_irq_affinity_for_vms.sh
-
The built-in mover doesn't support ignore lists in a file. For efficient moves between qBittorrent, Sonarr/Radarr, and my media library, everything needs to be on the same share (/mnt/user/data). But I don't want to move anything except the media library files from the cache pool to the array.
-
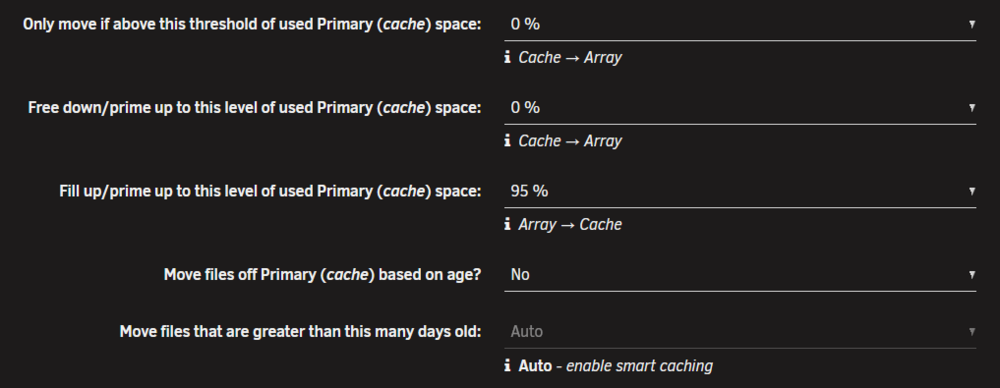
I'm having a similar issue. Except I have my schedule set for once at day at 1am. I have it set to move everything off that it can. (See settings below.) The mover is running in my case. For instance, last night it ran for 30 minutes. I have disabled the built in mover schedule.
-
Yeah, this is all I want: 1) Containers I specify us the VPN tunnel 2) Everything else (bridge-networked containers, host) stays the same, not using the VPN tunnel. 3) The VPN tunnel rebuilds itself as needed (the PIA token has a lifetime) 4) If the VPN tunnel goes down, it doesn't affect anything that doesn't use it Why is this so hard? @SpaceInvaderOne 's tutorial gets you up and running, but you don't realize that unwanted traffic is going over the tunnel, and when the tunnel fails the host suddenly loses network. For example, I have a DuckDNS container running to update my domain with my current IP address. It's on the bridged network. It thought my IP address was that of the VPN endpoint, and updated the DNS entry. Then all my Caddy-managed reverse proxy names like "photos.mydomain.com" were not resolving to my server. I was able to get everything working except my host traffic is still going over the tunnel while it's up. I had to use a combination of (1) a refresh script that includes IPtables tweaks like you're describing, (2) routing rules in my go script. See https://forums.unraid.net/topic/197609-unraid-vpn-manager-tunnel-wg0-not-showing-up-in-docker-containers/#findComment-1621149
-
I found that sometimes the tunnel breaks because the token for it has a lifespan. So I set up a user script that runs every hour to refresh the tunnel as needed. Attaching it in case it helps anyone. Edit: Oh, and I forgot. That script also includes routing rules so that (1) local traffic doesn't go out the VPN, and (2) the host doesn't lose network if the tunnel goes down. I also had to put this in the /boot/config/go: # Ensure that the docker bridged containers never use wg1 ip rule add from 172.17.0.0/16 lookup main priority 5201 ip rule add from 172.19.0.0/16 lookup main priority 5202 ip rule add from 192.168.122.0/24 lookup main priority 5203 VPN_Check_and_Repair.sh.txt
-
All I want to do is find posts with the words "VPN" and "container". I type "vpn container" and the search returns posts with "vpn" or "container". It "helpfully" suggests that I try "vpn AND container". So I try that, and it now returns posts with the word "and". Like, seriously, stop words in queries have been a thing since the 70's.
-
I noticed sometimes that the process "fileactiv" prevents unraid from unmounting a disk during array stop operations. I assume that process is for this plugin. After a minute or so I had to kill the process to unblock the operation. Is there some way to automatically stop the plugin so that it doesn't interfere?
-
Hi everyone, After many years, I've updated the container. Changes: Fix download URL so that "latest" and "latest_beta" works again Update to latest Phusion base image (Ubuntu lite) Change how the config file sets passwords to allow for special characters Add the -core option to suppress an X11 warning Allow the user to set the MAC_ADDRESS to a consistent value Periodically fix permissions in the config directory Let me know if there are any other burning feature requests and I'll try to address them. Thanks to the folks who provided pull requests.
-
I'm not sure. Sometimes it takes nearly a day to show itself, and I didn't run it long enough in safe mode to know. Here's what I think is happening... Hardware issues are causing segfaults, which cause some component of the web UI to fail, which then causes the browser timeouts. So basically not an UNRAID problem. So given the instabilities of the recent Intel CPUs, yesterday I replaced my motherboard and CPU with an AMD setup. So far no GUI hangs, but I see these in the syslog: Feb 7 00:19:32 storage kernel: ccextractor[528241]: segfault at 0 ip 000014d9771f2384 sp 00007fff1fd35308 error 4 in libc.so.6[14d977193000+195000] likely on CPU 9 (core 9, socket 0) Feb 7 00:19:32 storage kernel: Code: 5d c3 0f 1f 40 00 8b 47 04 83 e2 cf 8d 48 01 89 4f 04 89 13 eb bb e8 bb 9e 00 00 eb 92 66 0f 1f 84 00 00 00 00 00 f3 0f 1e fa <8b> 17 f6 47 74 80 74 74 89 d0 25 00 80 00 00 75 6b 55 53 48 89 fb Feb 7 00:22:55 storage kernel: ccextractor[543229]: segfault at 0 ip 000015540a56c384 sp 00007ffc97191298 error 4 in libc.so.6[15540a50d000+195000] likely on CPU 11 (core 11, socket 0) Feb 7 00:22:55 storage kernel: Code: 5d c3 0f 1f 40 00 8b 47 04 83 e2 cf 8d 48 01 89 4f 04 89 13 eb bb e8 bb 9e 00 00 eb 92 66 0f 1f 84 00 00 00 00 00 f3 0f 1e fa <8b> 17 f6 47 74 80 74 74 89 d0 25 00 80 00 00 75 6b 55 53 48 89 fb But it looks like a known issue with Plex or some other subtitle app. We'll see how things hold up after a few days, but it looks like I'm in the clear. Thanks for all the help!
-
Aren’t the NGINX errors exactly the problem? I log in, the main page tries to load for several minutes, and after a timeout I get an error in my browser and NGINX errors in the log. I’m not sure I mentioned it, but earlier I had tried to “pskill nginx” and the command hanged.
-
No luck with setting the CPU voltages as recommended by Intel. Or I should say I'm not seeing segfaults so far, but my web UI is still hanging. There's this in the syslog: Feb 1 00:37:53 storage nginx: 2025/02/01 00:37:53 [error] 15024#15024: *958 upstream timed out (110: Connection timed out) while reading response header from upstream, client: 10.22.33.101, server: , request: "GET /Main HTTP/1.1", subrequest: "/auth-request.php", upstream: "fastcgi://unix:/var/run/php-fpm.sock", host: "storage.coppit.org", referrer: "http://storage.coppit.org/login" Feb 1 00:37:53 storage nginx: 2025/02/01 00:37:53 [error] 15024#15024: *958 auth request unexpected status: 504 while sending to client, client: 10.22.33.101, server: , request: "GET /Main HTTP/1.1", host: "storage.coppit.org", referrer: "http://storage.coppit.org/login" Who is the upstream in this context? emhttp? Syslog attached. syslog
-
I stopped that container. It's weird, because it was working before but now its appdata subdirectories are empty. It locked up during the night last night. Here's the syslog from while I was asleep: Jan 30 22:36:49 storage emhttpd: read SMART /dev/sdg Jan 30 23:14:21 storage kernel: python3[24845]: segfault at 0 ip 0000000000000000 sp 000014f23108cd98 error 14 likely on CPU 4 (core 8, socket 0) Jan 30 23:14:21 storage kernel: Code: Unable to access opcode bytes at 0xffffffffffffffd6. Jan 30 23:38:29 storage emhttpd: spinning down /dev/sdd Jan 30 23:38:33 storage emhttpd: spinning down /dev/sdg Jan 30 23:38:34 storage emhttpd: spinning down /dev/sdb Jan 31 00:19:33 storage kernel: traps: sed[3214755] general protection fault ip:146dc212a427 sp:7ffcf5ce6270 error:0 in libc-2.40.so[146dc20ab000+17c000] Jan 31 00:47:55 storage kernel: tdarr-ffmpeg[3298066]: segfault at 146e569f5000 ip 0000146e66c699c0 sp 0000146e569f2fc0 error 6 in libx265.so.199[146e66c2a000+e98000] likely on CPU 5 (core 8, socket 0) Jan 31 00:47:55 storage kernel: Code: 83 c5 04 49 83 c4 08 53 48 8b bd 10 fe ff ff 48 83 c3 04 4c 89 95 18 fe ff ff e8 7b c6 ff ff 4c 8b 95 18 fe ff ff 48 63 53 fc <49> 01 12 59 5e 48 3b 9d 00 fe ff ff 74 12 48 8b 85 08 fe ff ff 48 Jan 31 02:04:32 storage emhttpd: read SMART /dev/sdd Jan 31 02:04:42 storage emhttpd: read SMART /dev/sdg Jan 31 03:12:10 storage emhttpd: spinning down /dev/sdg Jan 31 03:12:28 storage emhttpd: spinning down /dev/sdd Jan 31 04:43:30 storage rc.nginx: Reloading Nginx server daemon... Jan 31 04:43:31 storage rc.nginx: Checking configuration for correct syntax and then trying to open files referenced in configuration... Jan 31 04:43:31 storage rc.nginx: /usr/sbin/nginx -t -c /etc/nginx/nginx.conf Jan 31 04:43:31 storage rc.nginx: Reloading Nginx server daemon configuration... Jan 31 04:43:31 storage nginx: 2025/01/31 04:43:31 [alert] 14705#14705: *141820 open socket #4 left in connection 12 Jan 31 04:43:31 storage nginx: 2025/01/31 04:43:31 [alert] 14705#14705: aborting Jan 31 05:00:01 storage Plugin Auto Update: Checking for available plugin updates Jan 31 05:00:05 storage Plugin Auto Update: Community Applications Plugin Auto Update finished Jan 31 07:19:55 storage emhttpd: spinning down /dev/sdc Jan 31 08:30:13 storage emhttpd: read SMART /dev/sdc I see several segfaults on core 8, socket 0. I've had stability issue before but they seemed to go away. It's an Intel i9-13900K. Looks like there's a new bios. I'll try that. I'll also try disabling that core in the bios if I can.
-
Here are the diagnostics. All plugins and docker containers are updated. Thanks Squid! I wonder if despite repairing the disk, when the parity check hits a "bad part" of the disk it locks everything up. storage-diagnostics-20250128-2300.zip
-
I repaired the file system on sdb1. Unfortunately, I couldn't mount the disk and there was a transaction log. I had to delete that before the repair could complete. Sadly, the server was wedged again when I woke up this morning. I guess I'll uninstall plugins next in case one of them is interacting poorly with the new version. I tried to run "ps" to see if mover was running, and it wedged. "top" run fine, until I pressed "c" to show full command lines, at which point it wedged too. Weird. Here's the output: top - 08:47:30 up 12:45, 1 user, load average: 32.18, 32.16, 32.13 Tasks: 1106 total, 3 running, 1103 sleeping, 0 stopped, 0 zombie %Cpu(s): 3.2 us, 6.4 sy, 0.0 ni, 90.1 id, 0.0 wa, 0.0 hi, 0.2 si, 0.0 st MiB Mem : 128585.4 total, 12450.2 free, 73395.6 used, 44329.3 buff/cache MiB Swap: 0.0 total, 0.0 free, 0.0 used. 55189.8 avail Mem PID USER PR NI VIRT RES SHR S %CPU %MEM TIME+ COMMAND 15201 root 20 0 26.9g 24.2g 62720 R 85.1 19.3 9,41 qemu-system-x86 12396 root 20 0 718856 88532 1024 S 82.8 0.1 7,21 shfs 15936 root 20 0 26.4g 24.1g 62976 S 45.0 19.2 251:33.63 qemu-system-x86 10318 root 20 0 0 0 0 S 24.5 0.0 152:57.24 unraidd0 1900849 root 20 0 5012 3804 1792 R 20.9 0.0 0:02.14 find 8409 root 20 0 0 0 0 D 10.3 0.0 62:38.12 mdrecoveryd 17930 root 20 0 22968 11356 9564 S 2.6 0.0 16:56.66 openvpn 651 root 0 -20 0 0 0 I 1.7 0.0 10:49.35 kworker/7:1H-kblockd 180 root 20 0 0 0 0 S 0.7 0.0 2:24.67 ksoftirqd/7 8395 root 20 0 279972 5120 4352 S 0.7 0.0 3:00.61 emhttpd 26415 nobody 20 0 4405024 2.8g 2.8g S 0.7 2.2 12:58.13 qbittorrent-nox 1900251 root 20 0 9944 4352 2304 R 0.7 0.0 0:00.19 top 16 root 20 0 0 0 0 S 0.3 0.0 0:04.73 ksoftirqd/0 17 root 20 0 0 0 0 I 0.3 0.0 1:16.21 rcu_preempt 24198 root 20 0 1239296 17544 9728 S 0.3 0.0 0:04.16 containerd-shim 29782 root 20 0 38324 27876 9956 S 0.3 0.0 0:05.05 supervisord 429290 root 20 0 103728 32912 25856 S 0.3 0.0 1:11.43 device_list The two qemu processes are my VMs. "shfs", "find" and "unraidd0" are using a lot of CPU. Maybe the parity check is still running in the background...
-
Thanks, but it doesn't crash. Like I said, I can log in and get the syslog (which I posted). The web UI simply stops responding.
-
Hi all, I recently updated to 7.0. Sometimes the web UI works fine, but then after I come back in about half a day, it's unresponsive. I can load the login screen and log in okay, but then the main page doesn't load. It just spins and nothing shows up, and then it times out. I can ssh in, and my VMs and Docker seem to be running fine. If I run "shutdown -r now" it never completes. Syslog attached. I'm not sure where to start debugging this. (I see an XFS metadata error, which I'll try to fix once I can access the UI.)s Thanks! syslog.txt
-
Yeah, I saw that too. Hard to know...
-
Last update: I finally replaced the CPU. Things are stable now. The weird thing is that the old CPU is stable in another machine as well... Not sure what's going on. Maybe the motherboard's memory speed detection re-ran and is better now, or maybe I was missing a bit of thermal paste.
-
Sadly things only were stable for about a couple of weeks. I remember that I recently swapped out my air cooler for a water cooler in order to accommodate a third GPU. My new hypothesis is that the CPU was getting overheated, then slowing to a crawl. Unraid's temperature monitoring didn't show high temps in general, but I suppose that they can spike quickly without my noticing. I've removed the 3rd GPU and re-installed the air cooler, and reverted my CPU voltage tweaks (which likely caused it to run hotter). Hopefully this will stabilize things <fingers crossed / thumbs held>.
-
I switched to zfs with a 2 disk mirror. $ dd if=/dev/zero of=test1.img bs=100M count=20 oflag=dsync 20+0 records in 20+0 records out 2097152000 bytes (2.1 GB, 2.0 GiB) copied, 0.43951 s, 4.8 GB/s Much better. I'll check it again after a month.
-
I used filefrag on all my cache files to find out which are the most fragmented. 142807 ./system/docker/docker-xfs.img 21087 ./appdata/mariadb-official/data/ib_logfile0 11353 ./appdata/binhex-plex/Plex Media Server/Plug-in Support/Databases/com.plexapp.plugins.library.db 6344 ./appdata/binhex-plex/Plex Media Server/Plug-in Support/Databases/tv.plex.providers.epg.cloud-e6847e85-fd9d-4ae3-b604-b5ff4a50bfde.db 4277 ./appdata/nextcloud/log/nextcloud/nextcloud.log 2334 ./appdata/pihole-kids/pihole/pihole-FTL.db 1501 ./appdata/binhex-radarr/supervisord.log.1 <and a bunch of Deluge downloads>
-
I've been having trouble with Sonarr performance. Looking in the log, I see errors related to database locks. Digging deeper, my cache drive performance is very very bad. Since I was getting a few errors on one of the SSDs, I moved everything to the array and replaced that drive a month ago. At first performance was better (but not great), but now a month later it's bad again. Some info. My disk write performance is measured in kB/s: $ dd if=/dev/zero of=test1.img bs=1024 count=20 oflag=dsync 20+0 records in 20+0 records out 20480 bytes (20 kB, 20 KiB) copied, 5.56003 s, 3.7 kB/s $ hdparm -Tt /dev/sdg /dev/sdg: Timing cached reads: 42310 MB in 2.00 seconds = 21188.73 MB/sec Timing buffered disk reads: 1440 MB in 3.00 seconds = 479.45 MB/sec $ hdparm -Tt /dev/sdh /dev/sdh: Timing cached reads: 39242 MB in 2.00 seconds = 19650.09 MB/sec Timing buffered disk reads: 118 MB in 3.02 seconds = 39.08 MB/sec $ btrfs fi df /mnt/cache Data, RAID1: total=529.00GiB, used=466.58GiB System, RAID1: total=64.00MiB, used=96.00KiB Metadata, RAID1: total=3.00GiB, used=1.86GiB GlobalReserve, single: total=512.00MiB, used=0.00B $ btrfs fi show Label: none uuid: 7853a932-8ed9-4c4c-b1b9-48ad56a03e28 Total devices 2 FS bytes used 469.44GiB devid 3 size 931.51GiB used 530.03GiB path /dev/sdh1 devid 4 size 931.51GiB used 530.03GiB path /dev/sdg1 Label: none uuid: ecf4c172-490c-475d-8f98-be66f31b9bd7 Total devices 1 FS bytes used 2.94MiB devid 1 size 1.00GiB used 174.38MiB path /dev/loop3 I've read that sqlite databases can get really fragmented, which does appear to be the case: $ filefrag lidarr.db lidarr.db: 42850 extents found The UNRAID GUI says that a balance is not needed. But do I need to find and defrag highly fragmented files? I also read that the metadata volume can get fragmented? I started a balance operation anyway, but it was going to take 4+ days to complete so I canceled it. To be honest, I expect a file system to not need this much manual maintenance. Is my pool misconfigured? Should I switch to a ZFS mirrored pool? storage-diagnostics-20240504-0706.zip
-
Mover stops on this file: prw-rw---- 1 201 201 0 Feb 12 11:38 /mnt/disk2/appdata/netdata/cache/.netdata_bash_sleep_timer_fifo| which is a named pipe. The solution is to log into the server, manually delete the pipe, hard reset your server, and rerun mover. You can kill mover and restart it without rebooting, but this leaves a "move" process that cannot be killed, and which blocks the share from being unmounted during reboot. A hard server reset is the only way to reboot. I'm on 6.12.8
-
I've been dealing with frequent sqlite DB errors in Sonarr. I'm hopeful this was the cause. Thanks for posting the disk I/O errors. That helped me find this solution.
-
Just to follow up on this, in case anyone else has similar problems. mprime would warn about hardware errors within 5 seconds of starting. (The memtest ran a complete test without any errors.) I did two things that helped: 1) I saw a video where Intel CPUs would become unstable if the cooler was tightened too much on an Asrock Tai Chi motherboard. I removed my cooler and reinstalled, tightening just until I felt resistance. That stopped mprime from failing quickly. However after about 5 minutes I still got another error. The parity check after doing this found about 60 errors... 2) I increased my CPU voltage by two steps. (.10 V I think.) That seems to have removed that last of the instability.