






Everything posted by Lazaros Chalkidis
-
Hello @L0rdRaiden. Thanks for the detailed write-up and for taking the time to put all this together, it's genuinely appreciated. I've gone through each section and want to share where I land, what makes sense to adopt, and what doesn't fit the direction of the plugin. On the layout You're right about the width. The panel height is already user-adjustable by dragging the bottom-right corner, but wider monitors could definitely benefit from better use of horizontal space. I'll add an optional Wide mode toggle in the settings. On the SigmaHQ corpus and pre-compiled pipeline (section 1) The pre-compile pipeline is the delivery mechanism for the SigmaHQ corpus, so the decision is really about whether to adopt those rules at all. I'd rather not, and the reason is signal quality rather than feasibility. The Sigma project itself is upfront about this. The official rule specification defines an experimental status as a rule that could lead to false positives results or be noisy, and the level field documentation notes that even high and critical rules indicate an incident if not a false positive. Industry guidance from major Sigma users is consistent. SOC Prime explicitly warns that deploying all rules at once without testing is a recipe for disaster, and LimaCharlie notes that community rules are often broad by design and will fire on benign system activity in production environments. The corpus also skews heavily Windows. Of the roughly 3,100 rules currently in the SigmaHQ repository, around 2,400 (about 77%) target Windows, while only 209 (about 7%) target Linux. Within that Linux subset, 121 rules require process creation telemetry (Sysmon for Linux, auditd-based, or similar collectors that Unraid doesn't run by default) and 53 require auditd directly. Only the 22 builtin rules use a generic Linux logsource that could plausibly match plain syslog content as LogsViewer reads it. The remaining file-event and network-connection rules need their own telemetry sources. The grep backend that this proposal targets is also positioned in Sigma's own docs as useful for ad-hoc searching on a single host rather than as a primary production detection path. Compiling field-based rules through it flattens them to substring or regex matching on unstructured text and loses much of the precision that makes Sigma valuable in its native environment. So what shipping this would mean in practice for an Unraid install is: maybe a couple of dozen rules that actually fire on something the system produces, embedded in a much larger set that either does not apply or fires on benign activity, with no per-environment tuning, presented to an audience that is mostly home NAS users rather than SOC analysts. That erodes trust faster than the catches earn it back, especially given that LogsViewer is not currently positioned as a security plugin. The pipeline itself isn't the issue, there's just nothing I want to put through it. On bundling auditd (section 2) I'd rather not bundle and manage auditd within LogsViewer. A few specific concerns with the snippet as written. The package URL is pinned to slackware64-15.0, which is the Slackware base for Unraid 6.12.x. Unraid 7.x is built on Slackware current, which has a different glibc and Python (3.12 vs 3.9 on Slackware 15). The 15.0 audit package will either fail to install or install with library mismatches on 7.x, and will break again the next time the base shifts. The proposed audit.rules starts with the D flag, which silently deletes every audit rule already loaded on the system. Any user-configured rules disappear without warning on every boot. The default rule set is heavy on Unraid. Logging every execve under euid 0 means cron, plugins, Docker daemon activity, array event hooks, and so on all get recorded. Without per-deployment tuning the audit log fills quickly. If auditd integration is worth doing as a feature in its own right, it belongs in a separate opt-in plugin where it is the headline. One small clarification on your closing note. /var/log/audit/audit.log cannot actually be added as a new source in LogsViewer today. The system source list is hardcoded (syslog, dmesg, graphql-api.log, nginx-error, phplog, libvirt), and there is no settings path for arbitrary log files. That is a gap I want to close anyway, by adding user-configurable custom log paths. Once that lands, anyone running auditd separately can point LogsViewer at the audit log in one line. On the cursor and state management system (section 3) Good catch. Byte offset tracking is already in place in logsviewer-alerts-scan.php, but you're right on two real shortcomings. The offsets file lives at /tmp/logsviewer_cache/alert_offsets.json, and /tmp is tmpfs on Unraid, so the cursor state is lost on reboot. The cursor is also offset only, with no inode tracking. On log rotation, fseek to the saved offset can either skip lines silently or land past the end of the new file. Both will be implemented. On the scanning engine (section 4) Agreed. Adding a Scan Now button on the Alerts tab via AJAX is a clean addition. Since the scanner is already cursor-based, it will remain fast even when triggered manually. On auto-updates (section 5) Falls away with the Sigma decision above. On the extras (section 6) ReDoS protection is already in place. The scanner sets pcre.backtrack_limit around preg_match calls. Severity mapping to Unraid notify icons is already wired up (critical to alert, warning to warning, default to normal). Mute Rule is not in place today. I want to add it from the Alert History view, with muted IDs persisted and checked at the top of the scan loop. MITRE ATT&CK badges are a good idea. Since they depend on tags, I'll implement them via an optional Tags field in the rule editor. Users (or future curated packs) can tag their own rules with MITRE technique IDs, and the UI renders the badges in the alert history. Summary of what I'll implement for the next update: 1. Persistent cursor storage with inode tracking for log rotation 2. User-configurable custom log paths 3. Scan Now button on the Alerts tab 4. Mute Rule action from the Alert History view 5. Optional Tags field on rules with MITRE-style badges 6. Wide mode toggle for the log viewer Your write-up surfaced a couple of real improvements to the existing scanner that I might have otherwise missed. Thanks again, feedback like this is very valuable.
-
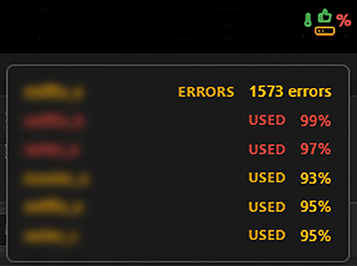
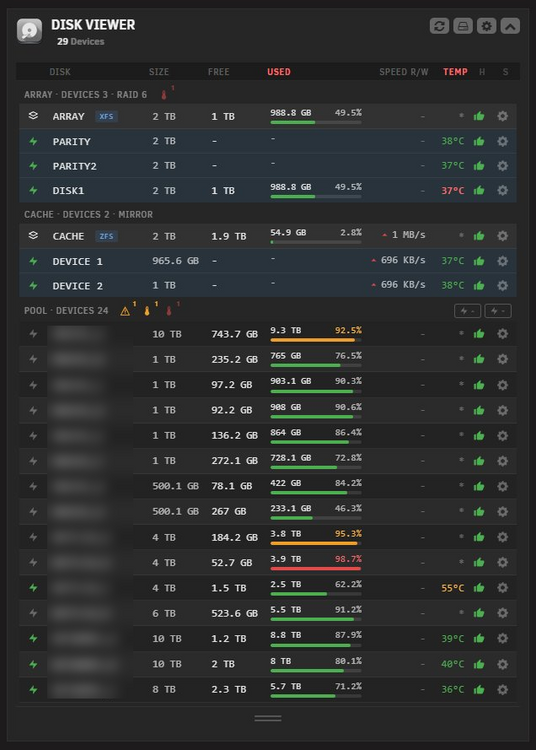
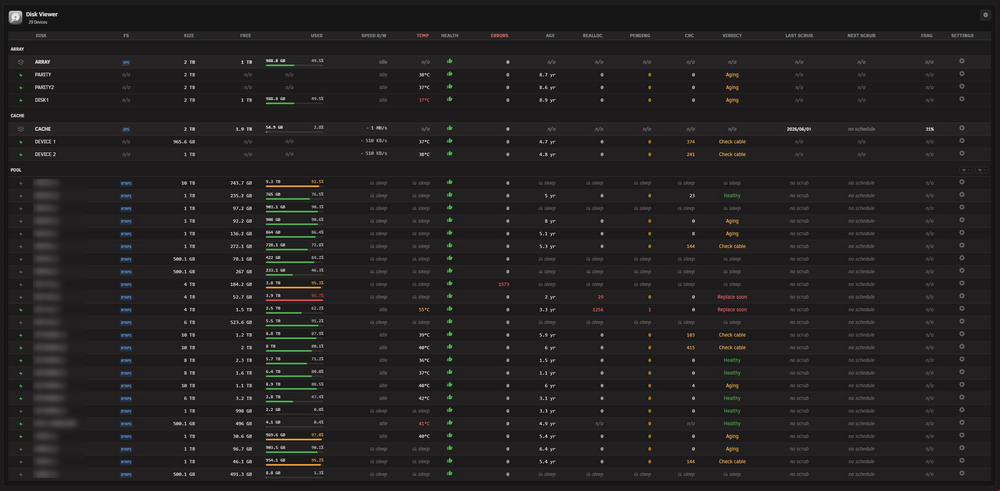
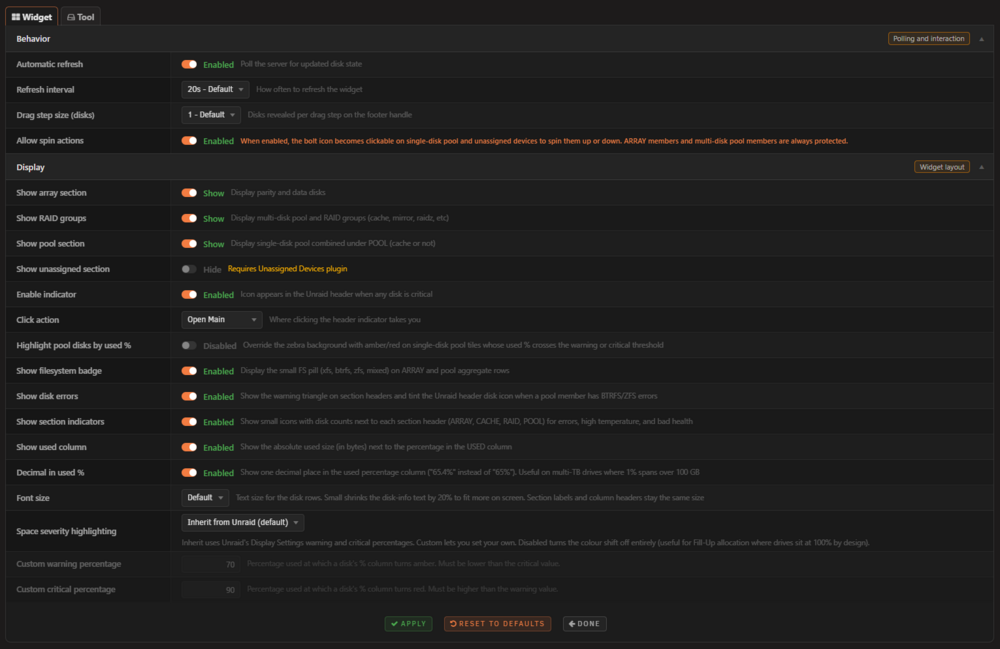
A compact dashboard widget that replaces Unraid's per-pool disk widgets with a single grid of all array, pool, and unassigned devices. Adds a full-page Tools view with detailed SMART, temperature, and capacity columns. Ideal for servers with many disks. Features Dashboard Widget: Monitor every disk on your Unraid server in real time from the dashboard Tools Page: A full-page view under Tools > Disk Viewer with a wide table of every disk and detailed SMART, temperature, capacity, scrub, and health columns, with its own independent settings Section Organisation: Disks grouped under ARRAY, CACHE, POOLS, and UNASSIGNED with independent show/hide toggles At-a-Glance Stats: Capacity, free space, used percentage, temperature, current read/write speed, and SMART health per disk Drag-to-Resize: Footer handle to reveal more rows or shrink the widget back down without leaving the dashboard Manual Spin Control: Per-disk bolt button to spin a disk up or down on demand, with bulk controls at section headers. Array members and multi-disk pool members stay protected Spindown Aware: Does not wake sleeping disks just to read temperature or SMART, and keeps showing the last-known values while they sleep Header Bar Indicator: A compact disk badge in the WebGUI top bar with temperature, health, and utilization markers reflecting the worst current state, with a configurable click action Severity Highlighting: Used percentage and temperature shift to warning or critical colours, either inheriting Unraid's native Display thresholds or using your own Auto Refresh: Configurable polling interval for live disk state, set separately for the widget and the tool Theme-Aware: Inherits the active Unraid theme (black, white, azure, gray) without override hacks Mobile Responsive: Works on all screen sizes including the Unraid 7.2+ responsive WebGUI Persistent SMART Cache: Last-known SMART values are stored on the flash config so they survive reboots and plugin updates Settings Page: Standalone settings at Settings > Disk Viewer, with per-tab Apply and Reset and browser-native form submission Dashboard Widget Screenshots: Header Badge Screenshots: Tool page screenshot: Installation Via Community Applications (recommended) 1. Open Community Applications in Unraid 2. Search for Disk Viewer 3. Click Install Manual Installation 1. Go to Plugins in Unraid 2. Click Install Plugin 3. Paste the following URL: https://raw.githubusercontent.com/Lazaros-Chalkidis/unraid-diskviewer/main/diskviewer.plg 4. Click Install Settings Settings live at Settings > Disk Viewer Settings and cover four sections: behaviour (refresh interval, drag step size, respect spindown), display (which sections to show), header bar indicator (enable/disable, click action), and spin control (enable/disable manual spin buttons). Apply uses a plain browser POST, no AJAX. Settings Screenshots: Requirements Unraid 7.2.x Optional: the Unassigned Devices plugin, if you want unassigned devices to appear in the widget GitHub Repository: https://github.com/Lazaros-Chalkidis/unraid-diskviewer GitHub Profile: https://github.com/Lazaros-Chalkidis Bug reports, feature requests and feedback are welcome here or on the GitHub issue tracker. If you hit something odd, a screenshot of the widget plus a few lines about your disk layout (how many array disks, what kind of pools) usually gives me enough to reproduce.
-
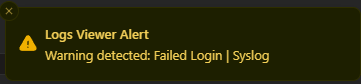
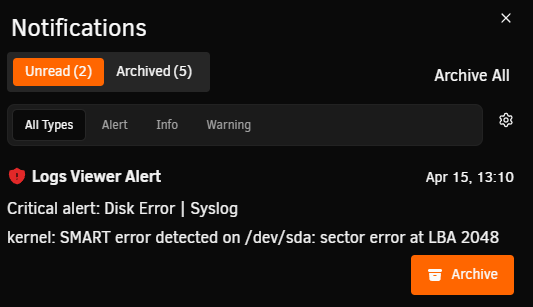
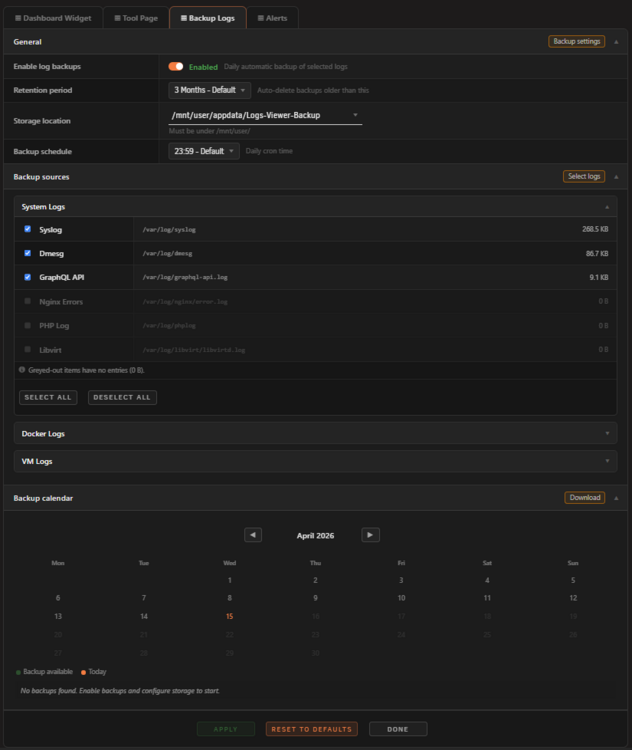
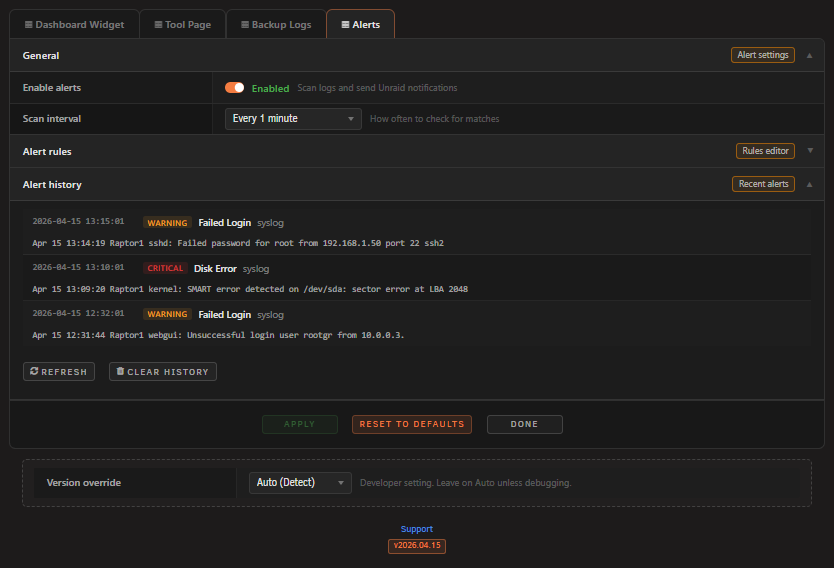
v2026.04.15 is out. New Features Syslog Previous added as a selectable system log source in Dashboard and Tool page Three new theme presets: Midnight, Ocean and Monokai Log Backups: scheduled daily compressed backups of all enabled sources (system, Docker, VMs) with retention control, calendar view and one-click ZIP download Alert system: pattern-based rules that scan logs at configurable intervals and send notifications through Unraid's notification system, with built-in presets and alert history
-
v2026.04.12 is out Bug Fixes Fixed poll daemon not restarting after a live plugin update. The daemon now auto-starts if the array is already running, so a reboot is no longer needed after updating. New Features Dashboard Widget: Time remaining indicator next to progress bar (e.g. "47m left", "1h 12m left") Resolution conversion in transcode badge (e.g. "TRANSCODE 1080p > 720p 2.4x") Last activity display when no streams are active (e.g. "Last stream 2h ago by user - Movie Title") Statistics - Graphs tab (10 new charts): Plays by day of week Monthly plays (always displays all 12 months) Top devices and platforms Library activity (plays per server and content type) Concurrent streams per day (peak simultaneous streams) Source resolution distribution Stream resolution distribution Watch completion histogram (0-25%, 25-50%, 50-75%, 75-100%) Plays by country (GeoIP lookup via ip-api.com) Top locations by city Improvements Standardized bar chart thickness across all graphs to match Peak viewing hours Improved footer timestamp styling and readability Increased progress bar width by 20% Fixed Cancel button sizing and alignment in Plex OAuth sign-in flow
-
Hey @joz, you were right, this was caused by the plugin. The poll daemon was starting during boot before user shares were fully mounted, which interfered with share initialization. This is fixed in v2026.04.10. The daemon no longer starts from the plugin install script. Instead it uses Unraid's event system and only starts after the array is fully up and shares are properly mounted. Also added automatic cleanup for any orphaned directories left behind from failed boots. Update through Community Applications and let me know if the issue is resolved on your end. Thanks for reporting this, it was a tricky one.
-
That confirms it. The path is correct but PHP resolves it through the FUSE layer to your actual SSD pool which was failing a security check. The fix is ready and will be in the next update. No need to change anything on your end, it will just work after the update. Thanks for taking the time to troubleshoot this with me, it helped improve the plugin for everyone with custom pool setups.
-
That's the bug. Your system resolves the path to /mnt/app_data/ instead of /mnt/user/ which fails a security check in the plugin. I'll fix this in the next update. For now there's a quick workaround. What path does your Docker appdata actually use? Check with: cat /boot/config/docker.cfg | grep DIR
-
I think I found the issue. Can you quickly run: php -r "var_dump(realpath('/mnt/user/appdata/Stream-Viewer'));"
-
Good news, cronPoll returned 1 and SQLite works fine. Check if the database was created just now: ls -la /mnt/user/appdata/Stream-Viewer/
-
No output means it's failing silently. Let's check if SQLite is available. Run: php -r "echo class_exists('SQLite3') ? 'yes' : 'no';" And also: php -r "try { \$db = new SQLite3('/mnt/user/appdata/Stream-Viewer/test.db'); echo 'ok'; \$db->close(); unlink('/mnt/user/appdata/Stream-Viewer/test.db'); } catch(Exception \$e) { echo \$e->getMessage(); }"
-
Sorry for all the back and forth. One last thing, run this in the terminal: php -r "require '/usr/local/emhttp/plugins/streamviewer/streamviewer_api.php'; echo (new StreamViewerEndpoint())->cronPoll();" 2>&1 This will either fix it or show us exactly what's going wrong. Paste whatever it prints.
-
You mentioned you toggled it off and on before, but that was before the folder existed. Now that you created it, try once more: toggle statistics off, Apply, then back on, Apply. Wait a minute and check if a .db file appeared: ls -la /mnt/user/appdata/Stream-Viewer/ Also run this so we can see what the config says: cat /boot/config/plugins/streamviewer/streamviewer.cfg | grep STATS
-
Those errors might just be because the database was just created and has no data yet. Give it 2 3 minutes for the daemon to record some sessions, then refresh the page completely (Ctrl+F5). The errors should go away once there's data in the database. If they persist after that, right-click one of the red lines, copy the response, and paste it here so I can see the actual error message.
-
That explains it. The plugin expects that folder to exist but your system doesn't have it. Create it manually for now: mkdir -p /mnt/user/appdata/Stream-Viewer Then go to Settings, toggle statistics off and on, hit Apply. Data should start showing up within a couple of minutes. Let me know if it works after that. I'll fix this in the next update so the plugin creates the full path automatically.
-
One more thing, can you run: ls /mnt/user/appdata/ I want to make sure that folder actually exists on your system. Some setups have appdata in a different location.
-
OK the daemon is running so that's good. Let's check a couple of things. Run these in the terminal: ls -la /mnt/user/appdata/Stream-Viewer/ And then: cat /tmp/streamviewer_cache/header_count Also open the browser console (F12 > Console tab) while on the statistics page and tell me if there are any red errors showing up.
-
Hey @derriang, no you don't need to install anything separately, SQLite is built into the plugin. From the screenshot it looks like the page is stuck on loading. Try hitting the refresh icon in the top right corner of the statistics page first, that should kick it into loading the data. If that doesn't help: 1. Go to Settings, toggle statistics off, hit Apply 2. Toggle it back on, hit Apply again 3. Wait a couple of minutes and check if data starts showing up If it's still stuck, open the Unraid terminal and run: ps aux | grep streamviewer_poll That will tell us if the daemon is actually running. Paste the output here and I'll take a look.
-
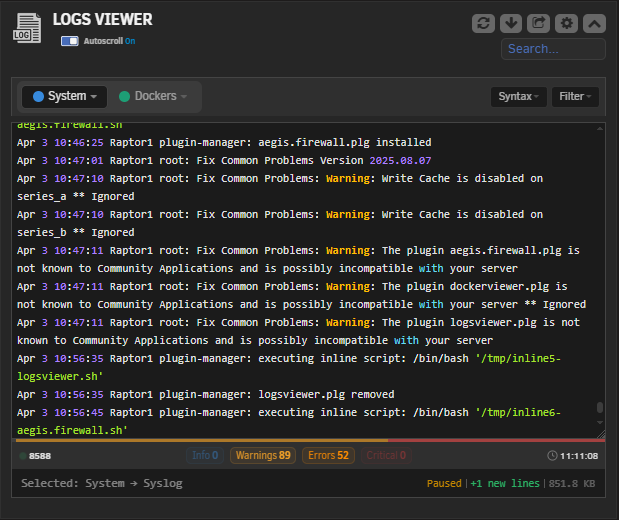
Hey everyone, v2026.04.06 is out. Toast bar upgrade The toast bar at the bottom of the widget now has two sections. The left side works as before (selected log, search results, login alerts, syntax warnings). The right side now shows the log file size permanently, plus live counters between polls: new lines in green, new errors in orange, new critical in red. These stay visible until the next poll brings fresh data. If you have pause on hover enabled, a "Paused" label also appears when you hover over the log panel. Settings page The System Logs, Docker Logs and VM Logs sections have been redesigned with a proper structured layout matching the rest of the settings page. Footer buttons (Apply, Reset, Done) and source action buttons (Select All, Deselect All, Scan) now match the Stream Viewer design. The hex color input for log background also accepts manual typing now. Fixes Theme preset selection (Terminal, Dim, Contrast) was broken and would always revert to Default after clicking Apply. This has been fixed. Also fixed the syntax/perf toast getting stuck after clearing a search query. Let me know if you run into anything.
-
Hey everyone, v2026.04.06 is out. Biggest addition is a header streaming indicator. You'll see a small cast icon with a purple badge up in the header bar whenever something is playing, regardless of which page you're on. It shows the active stream count and clicking it takes you straight to the Statistics page. You can turn it off from Settings if it bothers you. The other big change is under the hood. Statistics recording now runs through a background poll daemon instead of relying on the browser. This means sessions get recorded even if you don't have a tab open. The daemon starts and stops on its own when you toggle statistics in settings, and if you're upgrading it'll pick up automatically and clean up old cron entries. Also squashed a few bugs: Jellyfin/Emby autoplay was merging consecutive episodes into a single session. Each episode now gets its own entry. Multiple crond processes could spawn when saving settings, plus some syslog noise from cron. Both sorted. The user activity chart was cutting off usernames when you had a lot of users. Container height now scales with the number of entries. Mobile was a pain. The dashboard widget and the statistics page both had horizontal scroll issues on phones. Should be properly contained now. Some smaller stuff: settings page got restyled buttons, widget settings are reordered to make more sense, and the header icon picks up your theme colors automatically. Let me know if anything breaks.

-
Hello @kacktoz, thanks for the report! This is a confirmed Jellyfin specific issue. When Jellyfin autoplays the next episode, it keeps the same session ID, so the statistics tracker sees it as one continuous session instead of separate episodes. The dashboard shows correctly because it reads the live session title, but the history only records the final episode title. Fix is coming in the next update.
-
Your database is healthy (integrity check passed) and the 3 records are all from the same session, which confirms what I mentioned in my previous reply. Statistics currently only record while the Dashboard is open in your browser. I'm working on a background process for the next update that will fix this. Regarding CA Appdata Backup, that's not the issue here.
-
@Jonae , after investigating further, I believe your issue might be the same as another report I received. Currently, statistics only record data while you have the Unraid Dashboard open in your browser. Once you close it or navigate to another page, data collection stops. That would explain why it "works for a while then stops". When you change permissions and open the Dashboard to check, it starts recording because the page is open. When you close the browser, it stops, and it seems like a permissions issue but it's actually not. This is a known limitation that I'm actively working on fixing. The next update will include a background process that collects data independently 24/7, regardless of whether you have the browser open. Stay tuned!
-
@Jonae i did some testing on my own setup to try to reproduce this. I tested with both root:root and nobody:users ownership on the Stream Viewer folder, and statistics kept writing normally in both cases. This is because the Unraid webGUI runs PHP as root, so file permissions alone shouldn't cause this issue. That said, I'd like to dig deeper into your specific case. Could you run the following in the Unraid terminal and paste it here? Check database health: sqlite3 /mnt/user/appdata/Stream-Viewer/streamviewer.db "PRAGMA integrity_check;" Check if there are recent records: sqlite3 /mnt/user/appdata/Stream-Viewer/streamviewer.db "SELECT * FROM watch_history ORDER BY id DESC LIMIT 3;" Check file status: ls -la /mnt/user/appdata/Stream-Viewer/ Also: Do you have any backup plugins (like CA Appdata Backup) that might be copying the Stream-Viewer folder while the plugin is running? SQLite uses a single file as its database, and if another process reads or copies that file at the same time the plugin is writing to it, the database can get locked and stop accepting new data until the lock is released. Share the output and any screenshots, that will help narrow it down.
-
Hey @Jonae, sorry to hear that! I need a bit more info to help you troubleshoot. Could you let me know: Which version of Stream Viewer are you running? Which media server (Plex, Jellyfin, Emby)? Is the widget still working on the Dashboard? When you open the Statistics page, do you see any error or just empty data? Did you recently update Stream Viewer or Unraid? Can you check in Settings that Statistics are enabled? (Settings > Stream Viewer > scroll to the Statistics section and make sure "Enable statistics" is turned on) Any details or a screenshot would really help narrow it down. Thanks!
-
Great suggestion, thanks! A header bar streaming indicator is already on the roadmap. The plan is a small icon with a stream count badge in the top-right header, visible from any page. It will pulse when streams are active and stay hidden when there are none. Clicking it will take you straight to the Dashboard. I considered the popup approach but decided to keep it lightweight and consistent with the existing Unraid header style rather than introducing a floating widget. Hopefully the indicator alone will solve the "am I streaming right now?" question without needing to navigate to the Dashboard!



