Everything posted by Lazaros Chalkidis
-
Hi @mrhogan, thanks for the feedback and the detailed report. The next update gives TB and up a second decimal (clean values like 2 TB stay 2 TB), so your two cache drives will read 1.49 and 1.53. On the n/a columns Age, Realloc, Pending, CRC and Verdict come from SMART, and the plugin will not wake a sleeping disk to read it. So spin up any disks in standby first and the values fill in. A few drives never report Power-On Hours at all, so Age can stay n/a there even when awake. Last scrub is a btrfs/zfs thing, and on a multi-disk pool it shows on the summary row, not the member rows. Frag is zfs only (read from zpool), btrfs can scrub but does not expose a fragmentation number, and XFS has neither. Thanks again.
-
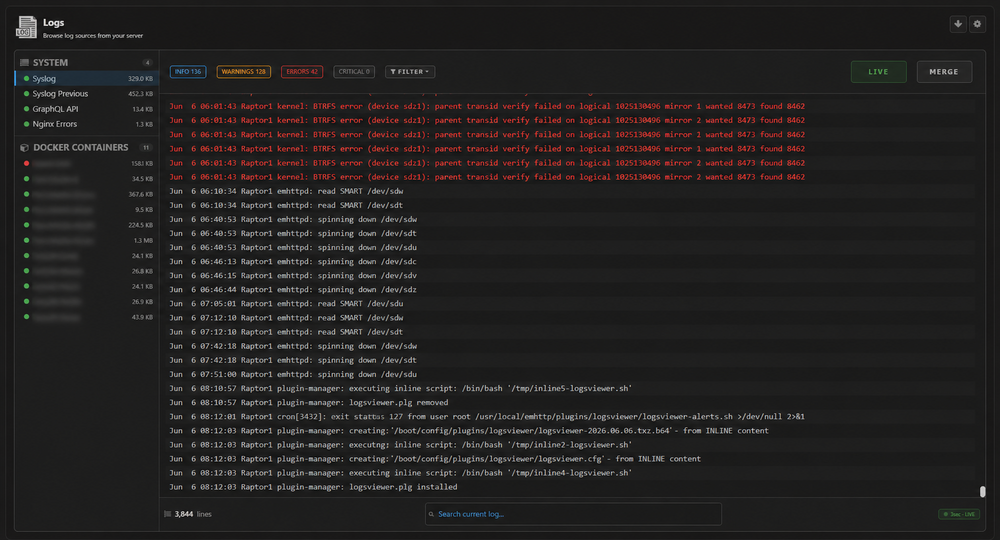
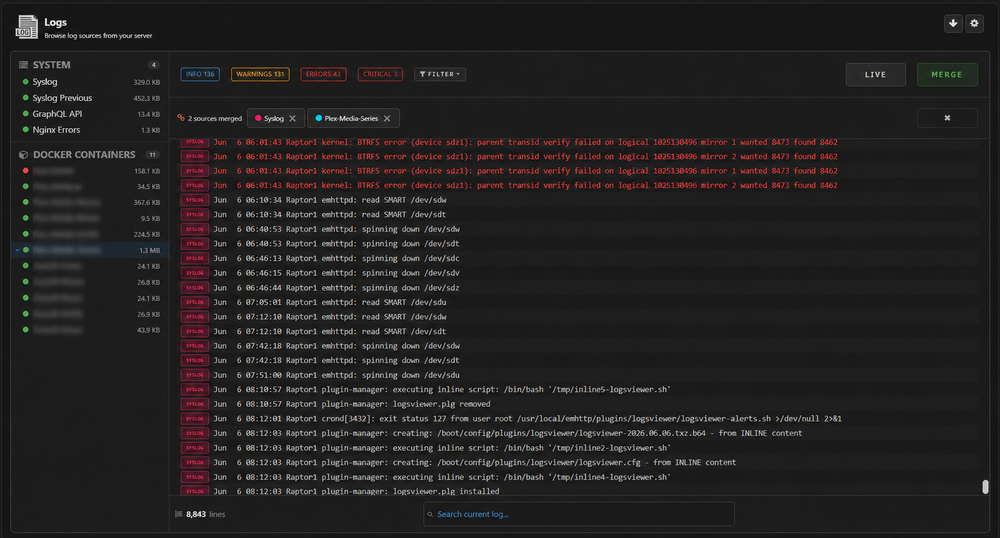
v2026.06.06 is out This release is a big one. The Tool page has been completely rebuilt into a full log viewer, and there are new tools on the Alerts side plus a lot of polish across the plugin. Fixed Apostrophes and other characters in log lines no longer show as raw codes like '. The Tool page no longer shows an "HTTP 403" error after being left idle. Merge mode now orders lines from different sources correctly by time. On a fresh install, Dmesg no longer appears with a "log not found" error; empty (0 B) logs are now hidden from the very first load. Docker container log sizes are detected reliably, so the source pickers no longer grey out valid containers. The alert mute menu no longer gets cut off at the bottom of the list. The whole Tool page now fits on screen without page scrolling. New Features Rebuilt Tool page: a full-screen log viewer with a sidebar listing all your sources (System logs, Docker containers, VMs, and custom logs), grouped together with a status dot and the file size next to each one. Live tailing: the open log updates on its own. Pick the refresh rate (3, 5, 10 or 20 seconds) in settings. Hovering over the log pauses updates so lines do not scroll away while you are reading. Severity filtering: click the Info / Warnings / Errors / Critical pills to show only that level, and use the Filter dropdown for "and above" levels. Merge mode: pick two or more sources to see them combined in one stream, ordered by time. Search box in the footer to filter the current log as you type. Right-click a line to copy it or to filter the log on the selected text. Download button to save the current log as plain text, JSON or CSV (format is chosen in settings). Custom log paths: add any log file under /var/log, /mnt/user or /mnt/cache, and it becomes available everywhere (Tool page, widget, Alerts and Backup). Alerts: a Scan Now button for on-demand scans, the option to mute a rule for 1 hour / 24 hours / 7 days / forever, and tags on rules with a built-in MITRE ATT&CK technique picker. Log font size setting (Default or Large) for the Tool page. Improvements Settings and Tool pages now use the full width of large 2K and 4K monitors instead of leaving big empty margins. Tidier Settings footer with Support Forum, GitHub Issues and Credits links in one row. Stopped Docker containers and VMs now show a red dot, matching the dashboard widget. Sidebar dots now always reflect the source state and no longer change colour when you click a source. Alternating row shading in the log makes long lines easier to follow. Consistent "Docker Containers" wording across the whole plugin. Alert tracking now survives reboots and log rotation, so you do not get duplicate or missed alerts. One consistent button style across the Tool page. Tool page Screenshots:
-
Hi @JudasD, let us check two things, in order. 1) First, make sure the unassigned section is actually turned on. It is off by default, and it is set separately for the dashboard widget and for the Disk Viewer page. 2) If it is already on and the drive still does not appear, the plugin now writes a small diagnostic file that tells me exactly what it sees and why a drive is or is not picked up. After you have reloaded with the section enabled, please run these two commands from the Unraid terminal and paste the output here: cat /tmp/diskviewer_cache/ud_diag.json echo "----" cat /var/state/unassigned.devices/unassigned.devices.json If you would rather not paste the whole second file, I mainly need the "device", "mounted", "pass_through", "array_disk" and "pool" fields for your drive (feel free to blank out the serial). That will show whether your drive is in the list at all, and if so why it was skipped.
-
v2026.06.05 is out Fixed Unassigned drives show up again on the newest Unassigned Devices plugin, which changed how it stores its device list. The header badge now pulses only when a disk runs well over its critical temperature, matching the widget, instead of flashing on any critical reading. Tool settings are now fully independent from the Widget: a Tool option left at its default no longer follows the Widget value. New Features Header click action now includes "Open Tool", so the top-bar icon can jump straight to the Disk Viewer page. Improvements Unassigned drives now show real temperature and SMART health when the drive reports it. Unassigned drives now show their live read/write speed. Last scrub now follows your Unraid date format from Settings > Date and Time. Tool page Small font size is now only slightly smaller, so it stays comfortable to read. Widget font size options are now Default (compact) and Large. @JudasD try the latest version and let me know if the unassigned drives are showing up for you.
-
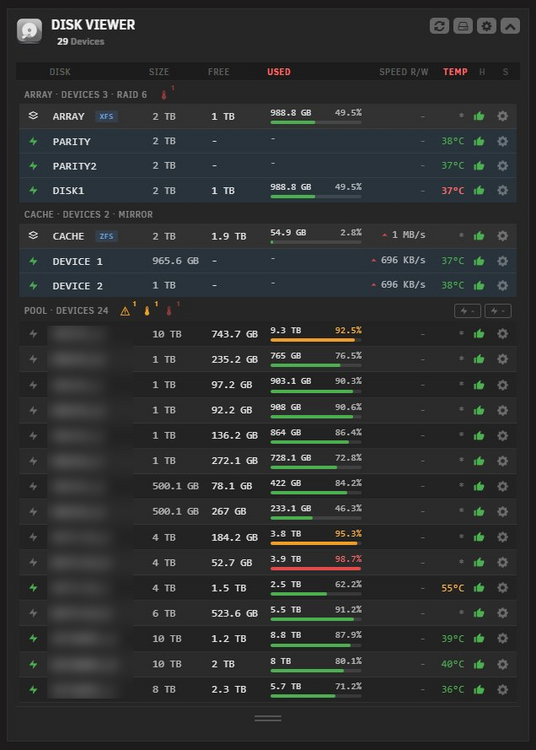
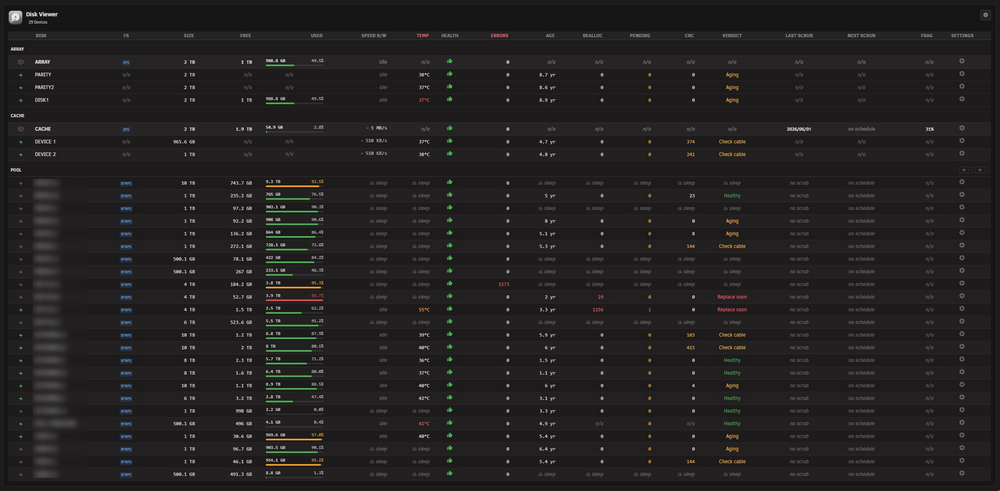
v2026.06.02 is out Fixed Disk sizes now match the Unraid Main page (a 2 TB drive reads as 2 TB). Disk Viewer page column headers now stay pinned while scrolling. Live read/write speed updates again on its own fast cadence. Used column and decimal percentage now display correctly right after a fresh install. Empty Parity 2 slot no longer appears on single-parity arrays. New Features Disk Viewer page: a new full-page view under Tools > Disk Viewer with a wide table of every disk, including detailed SMART, temperature, capacity, scrub and health columns. Separate Widget and Tool settings: Settings now has Widget and Tool tabs, each configured independently with its own Apply and Reset. USED column now shows the used bytes next to the percentage, with optional one-decimal precision. Section header indicators: small icons next to ARRAY, CACHE, RAID and POOL show how many disks have errors, high temperature, or bad health, with a tooltip listing them. Font size option to shrink the disk rows and fit more on screen. Improvements Critical temperatures now stand out: a separate red indicator sits next to the amber one and pulses when a disk runs well over its limit, in both the widget and the header badge. Used bytes and one-decimal percentage are now shown by default. Refreshed zebra striping for a cleaner look across all themes. Dashboard screenshot Tool page screenshot
-
Hi @mrhogan, thanks for testing it out. 1. Fair point, the value's already there internally (size minus free). Adding it as an optional column. 2. Yeah, 1% on a 16TB drive is a lot. Adding a toggle for one decimal place. 3. That's actually a bug, not a preference. My plugin uses binary math (1024-based), Main uses decimal (1000-based). Same disk, different unit. Fixing to match Main. 4. Empty Parity 2 shouldn't show at all when you've only got one parity assigned. Filter on my end is missing that case. Will be gone in the next build. All four going into the next release.
-
v2026.05.28 is out Bug Fixes Statistics time-range dropdowns now go up to All time (previously capped at 90 days) to match the retention options in Statistics settings. Movies in Recently Added now show "Movie" in the Type column instead of "-". Stats charts, legends, tooltips and Server filter dropdowns now only show the server types you actually use, instead of always showing Plex, Jellyfin and Emby.
-
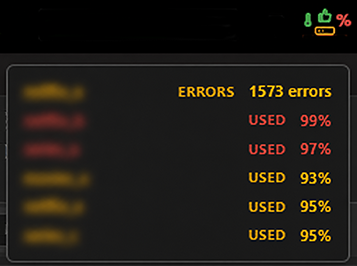
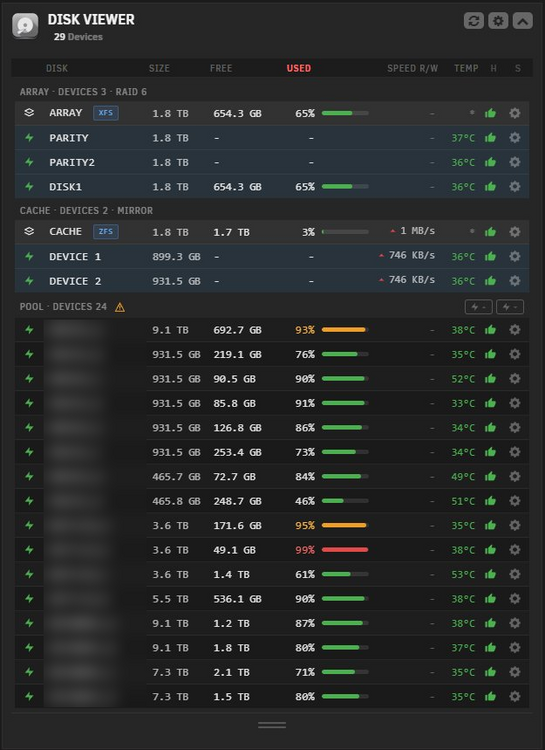
v2026.05.28 is out Fixed Pool disk errors are now actually detected and flagged. SSD and NVMe drives use their own temperature thresholds instead of the HDD ones. Per-disk temperature overrides set in Unraid SMART settings are honoured. Failed or disabled array disks are now flagged as critical. Unassigned drives are visible by default. Header click action setting now works. Array data disks show their correct capacity. Parity disks now show their I/O activity, and aggregate rows show real totals. Hover tooltip works reliably across all themes. Filesystem badge stays readable on light themes. New Features Hover the header icon to see exactly which disks have issues and why. Warning triangle next to a section header when any disk in that group has errors. RAID type shown in section headers (RAID 6, BTRFS RAID 1, ZFS Mirror, and so on). Click action setting for the header icon: Open Main, Dashboard, or Settings. New toggles: highlight pool disks by used %, show filesystem badge, show disk errors. Per-disk free-space overrides honoured (set from the Main page). Improvements ARRAY section redesigned: parity, data disks, and aggregate row. CACHE section now shows the pools actually used as cache, not just the one named "cache". Multi-disk pool members shown as DEVICE 1, 2, ... with the totals on the summary row. Cleaner zebra striping in combined sections. Default refresh interval is now 20 seconds. Show Unassigned defaults to off. Hover tooltip colours match your active Unraid theme. Bigger, clearer speed arrows without bouncing the row height. New Screenshots
-
I’ve noticed that some plugins are being added to CA even though they do not meet the requirement of having a support link to the Unraid forum. Normally, they should appear under Statistics > Template Errors, unless something has changed and I’m not aware of it.
-
Hi @JudasD, thanks for the feedback! The issues regarding "Per-drive settings for free space" and "Header click-action" have been included in the next update. For the UD drives not showing up, if you've enabled them in the settings, but they're still not showing up, I'll try to figure out what's going on.
-
Hi @shwa87, thanks for the kind words and the detailed write-up. Both points are fair, and honestly the current behaviour reads as quirky once you describe it like that. Putting them into the next release: 1. A dedicated summary row above the parity disks for the ARRAY section, so the array total stops piggybacking on the first PARITY row. 2. Pool topology detection so the displayed capacity matches the actual pool layout (mirror, RAIDZ, RAID1, etc) instead of the raw sum of the member disks. The raw-sum row gets dropped when the pool is not a true stripe. Will post here when it is ready. Thanks for the feedback.
-
Hi @JudasD, The plugin was reading only the global HDD threshold from Display Settings and applying it to every disk, ignoring the per-disk overrides you set on the Main page. Honestly didn't think about per-disk overrides at all. Going to take me a few days to rework the code to handle these properly, along with a few other improvements I've got planned. Will post here when the next release lands. Thanks for the patience.
-
v2026.05.23 is out Bug Fixes Pause/resume of a stream was recorded as multiple separate plays in Recent history, inflating the play count in Most Watched. New Features New "Merge paused sessions" setting in Statistics settings. Stream sessions for the same user and title on the same server that end within this window are merged into a single play. One-time cleanup on upgrade collapses existing pause/resume duplicates in the watch history using the 60-minute default window.
-
Hi @Eisi2005, I reproduced the issue. It will be fixed in the next update. Thanks for pointing it out.
-
Hi @JudasD, try ctrl -alt-del. The most likely cause is a browser cache. If it doesn't fix it, let me know.
-
v2026.05.21 is out Feature additions Space Severity Highlighting: New dropdown in Display with three modes (Inherit, Custom, Disabled). Temperature Unit Awareness: Plugin now follows Unraid's global Temperature Unit setting (°C / °F) automatically. Improvements Wider Settings Panel Refreshed Credits Modal
-
Stream Viewer is a plugin, not a Docker container. In Community Applications, make sure you're either on the "All" or "Plugins" category, not filtering for Docker containers only.
-
v2026.05.20a is out Bug Fixes Fix width on settings and statistics pages
-
A new update will be out shortly with a fix for this issue.
-
Hi @JudasD, thanks for the kind words and the thoughtful feedback. Both items make sense, putting them into the next release: 1. Fill-Up allocation legitimately puts drives at 100% and that should not read as an alert. I will add a toggle to either turn off the colour-shift on the used percentage column entirely, or set custom warning/critical thresholds that override the ones inherited from Unraid Display Settings. 2. Temperature units. The plugin currently always renders Celsius. Unraid's Display Settings already has a Temperature Unit toggle (C/F) and the widget should honour that automatically rather than needing its own setting. Will wire it up, so the temperature column follows whatever you have set globally. Will post here when the next release lands.
-
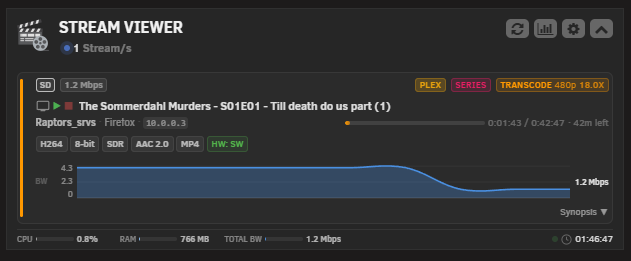
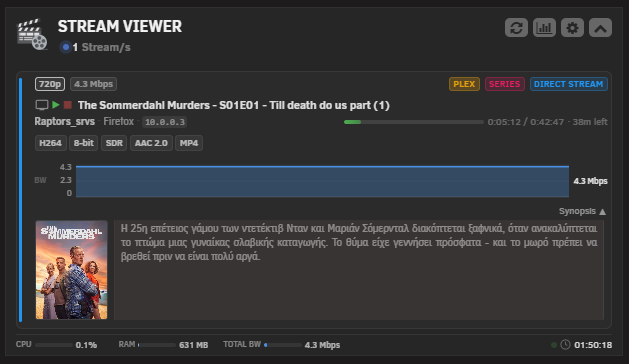
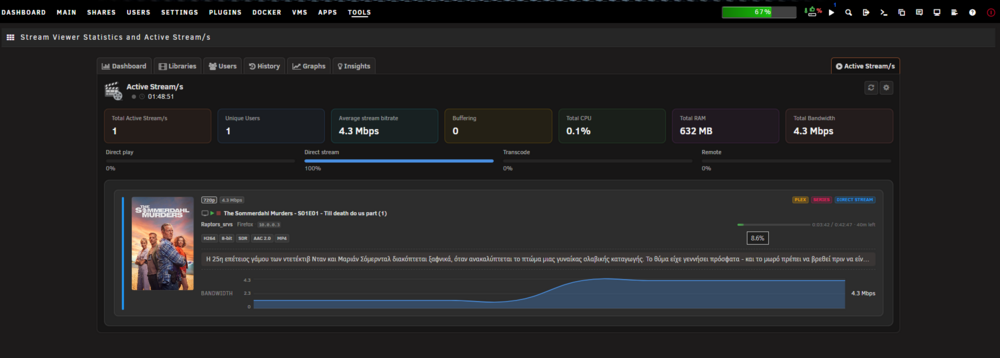
v2026.05.20 is out Bug Fixes Statistics page was being constrained by Unraid's main content container width, leaving large gutters on 2K and 4K monitors. New Features New Active Stream/s tab in statistic page Bandwidth chart per stream card. New "Network bandwidth capacity" setting in Widget settings controls the ceiling of the Total BW bar in the footer Statistics retention dropdown gains an "Unlimited" option (sentinel value 0) that disables the daily prune entirely New "Erase data on uninstall" toggle in Statistics settings (default off). New "Wipe statistics database" button in Statistics settings Improvements "Show Docker stats" description changed from "CPU/RAM in footer" to "CPU/RAM/Total BW in footer" Screenshots
-
v2026.05.14 is out Bug Fixes Plex local plex.direct hostnames were being treated as remote, breaking the auto-rediscover logic for OAuth-configured servers Widget RAM stat for media containers was inflated by file cache; now reports real working-set memory matching the Unraid dashboard Emby/Jellyfin transcode reason badges showed garbled text like "Audio $2odec $2ot $2upported" instead of "Audio Codec Not Supported" Light/dark theme detection treated Azure as light and forgot Gray entirely. All four official Unraid themes (Black, White, Azure, Gray) now render with the correct contrast New Features OAuth discovery detects Plex containers running on the same Unraid host and offers their direct LAN address as a top-priority "Local Container" option in the connection dropdown Settings page shows a one-click "Switch to local" banner when a configured Plex server is reachable as a local container but stored with a non-local URL Stop stream confirmation and Reset to defaults notification now use styled in-plugin modals instead of the native browser dialogs Improvements - Credits modal redesigned to match the Logs Viewer layout Note: the next update will be focused on the Statistics page, with new features and improvements. It's going to be a big one, so it may take a bit longer to land.
-
@i1mran92, thanks for the output, that gave me what I needed. The URL saved on your end resolves to your public IP, so SV was reaching Plex by going out to your router and looping back in. That round trip is unstable under load, which is the 10 second timeout you were hitting. The root cause is on my side. When you signed in with Plex, the connection picker preselected a remote URL even though a local one was available. I am pushing a fix shortly that addresses this specific case. Will post here when it is up.
-
Hey @i1mran92, the badge lights up when SV cannot get a clean response from your Plex server, but without seeing the exact error it would be guessing. The reason re-auth temporarily fixes it is that the sign-in flow also re-runs Plex discovery and picks a fresh server URL, so whatever the real cause is, the new sign-in masks it for a while. The most useful thing you can do is run one command the next time the badge shows unreachable, from the terminal: TOKEN=$(grep -oP 'SERVER1_TOKEN="?\K[^"]+' /boot/config/plugins/streamviewer/streamviewer.cfg) URL=$(grep -oP 'SERVER1_URL="?\K[^"]+' /boot/config/plugins/streamviewer/streamviewer.cfg) echo "URL: $URL" time curl -v -m 10 -k -H "X-Plex-Token: $TOKEN" "$URL/status/sessions" 2>&1 | grep -E "^[<>*]|HTTP|real" | head -30Post the output here (the token is stripped, the URL is safe to share). Depending on what comes back we will know whether it is a slow response under load, a stale URL pointing at the wrong IP, a revoked token, or the Plex container being down at that moment. Each of those has a different fix and right now we cannot tell them apart. If the badge clears before you get a chance to run it, no worries, just catch the next occurrence.
-
Hello @i1mran92. Thanks for the kind words, really glad Stream Viewer's been useful! Good catch on the bold font in the plugin list, that's a small bug on my side. I'll get it sorted in the next release so it shows properly alongside the others. On the live streams view inside Stream Viewer Statistics, that's a great idea. Having the active sessions next to the historical stats in one place would tie things together nicely. I'll add it to the roadmap and figure out the cleanest layout when I get to it, probably either a dedicated Live tab or an active streams panel at the top of the dashboard. Appreciate the feedback, this is exactly the kind of input that helps the plugin get better.