Everything posted by Lazaros Chalkidis
-
Hey @aal994 thank you! Really appreciate the kind words!
-
Hello @Kilrah, thank you for the detailed report and the video. The network spikes are related to how much log data is being fetched per refresh cycle. I noticed in your video that your syslog shows ~5000 lines. Please check your Settings and reduce the tail lines to 200-500 for the dashboard widget, this alone will dramatically reduce the data transferred per refresh and should fix the browser slowdown. Regarding the font size — there is already a font size option in the Settings page under Log Display.
-
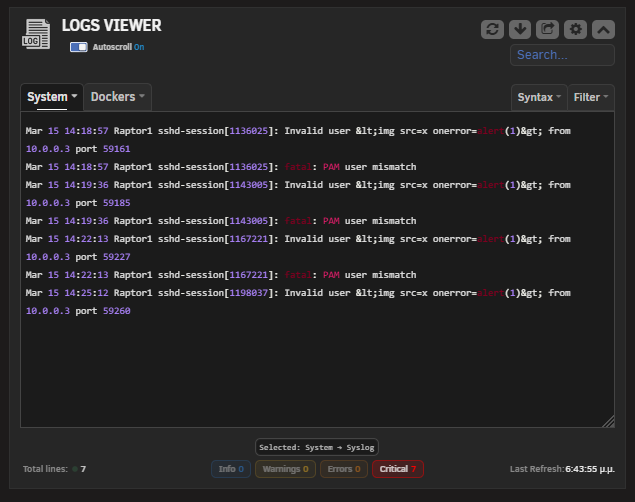
Hi @DiscoverIt, thank you for the detailed report, this is exactly the kind of security scrutiny a plugin should face. I investigated the specific attack vector you described and here's what I found: Server-side escaping (PHP) All log content system logs, Docker logs, and VM logs is passed through htmlspecialchars($text, ENT_QUOTES, 'UTF-8') before being serialized to JSON and sent to the client. This converts <img src=x onerror=alert('XSS')> into <img src=x onerror=alert('XSS')> before it ever reaches the browser. Client-side (JavaScript) The innerHTML write you identified does receive this data, but by the time it arrives it is already HTML-encoded plain text. The highlightLevels() and applySearchHighlight() functions only inject controlled <span> tags wrapping already escaped content they never operate on raw unescaped input. Live test: I sent a crafted payload directly to the server: curl "http://[server]/<img src=x onerror=alert('XSS')>" The nginx error log contained no trace of the payload nginx rejected the malformed URI before it was even logged. No alert fired in the browser. In summary: the escaping happens at the API boundary (PHP), before the data touches JavaScript. The innerHTML usage is safe because the data arrives pre escaped. I appreciate you raising this it's a valid concern for any log viewer and worth documenting clearly. If you were able to reproduce this in practice, I'd be happy to see a proof of concept, but based on my code review and live testing, I cannot reproduce the vulnerability you described. I tested your exact SSH username vector. As you can see, the payload appears fully HTML escaped in the widget <img src=x onerror=alert(1)> no script executes! For the record, here is the proof.
-
Hi @Nonoss , thanks for the kind words and for catching this! It's a double encoding bug apostrophes in titles and descriptions from Plex get HTML encoded twice, which is why you see ' instead of '. I've already identified the root cause and a fix is on the way. I'll push an update shortly. Thanks again for reporting it!
-
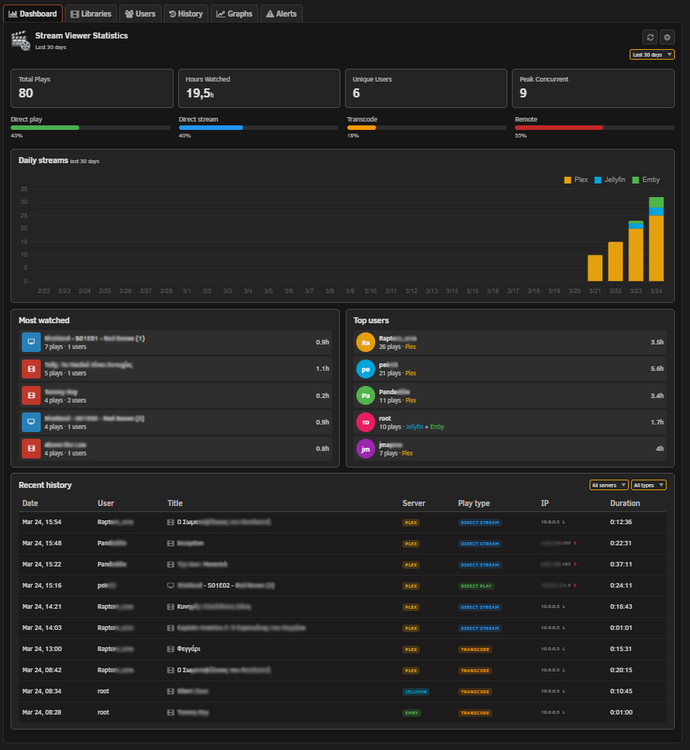
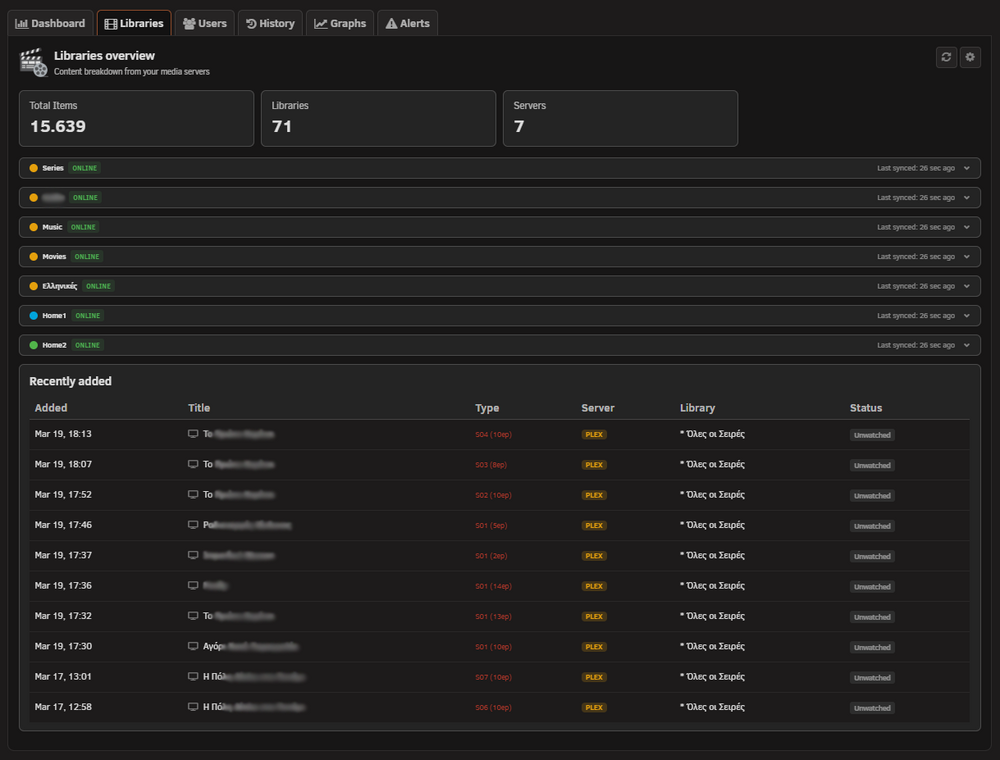
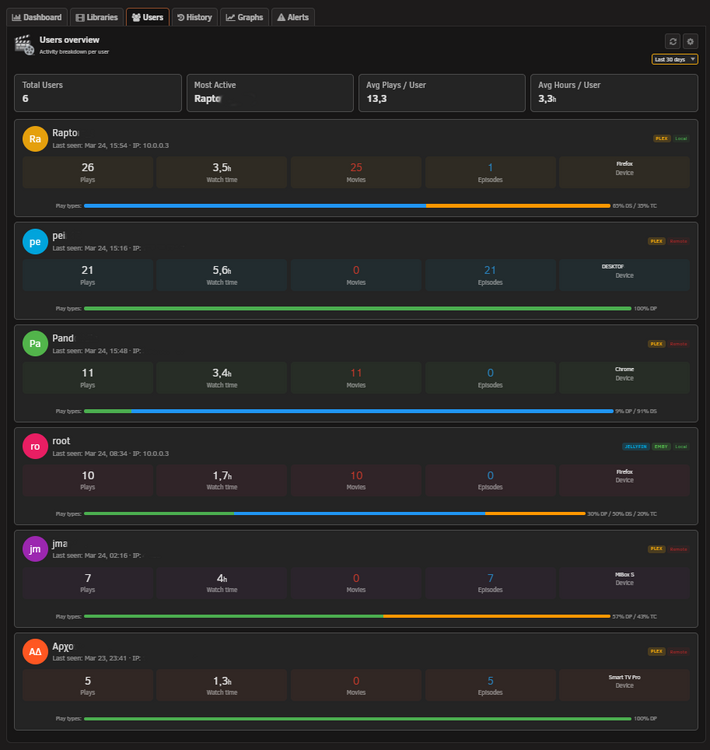
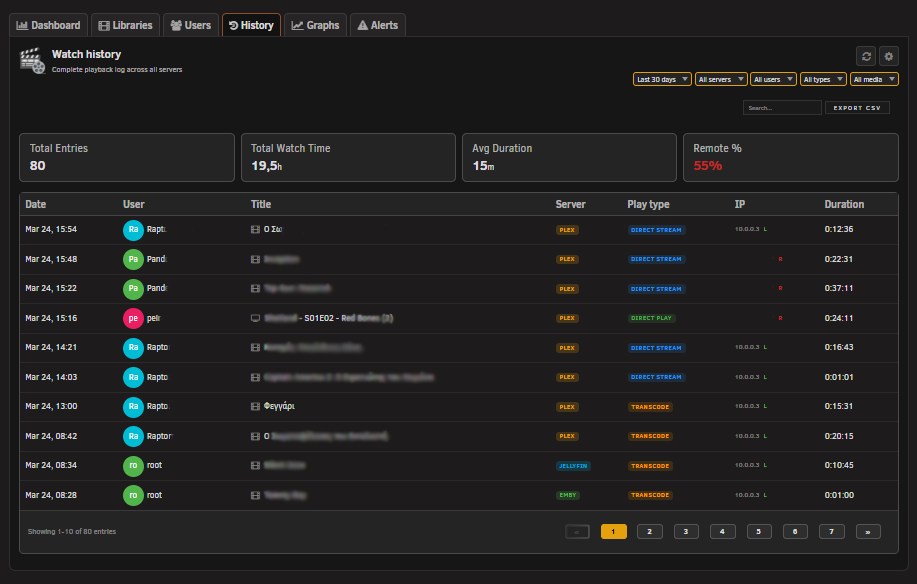
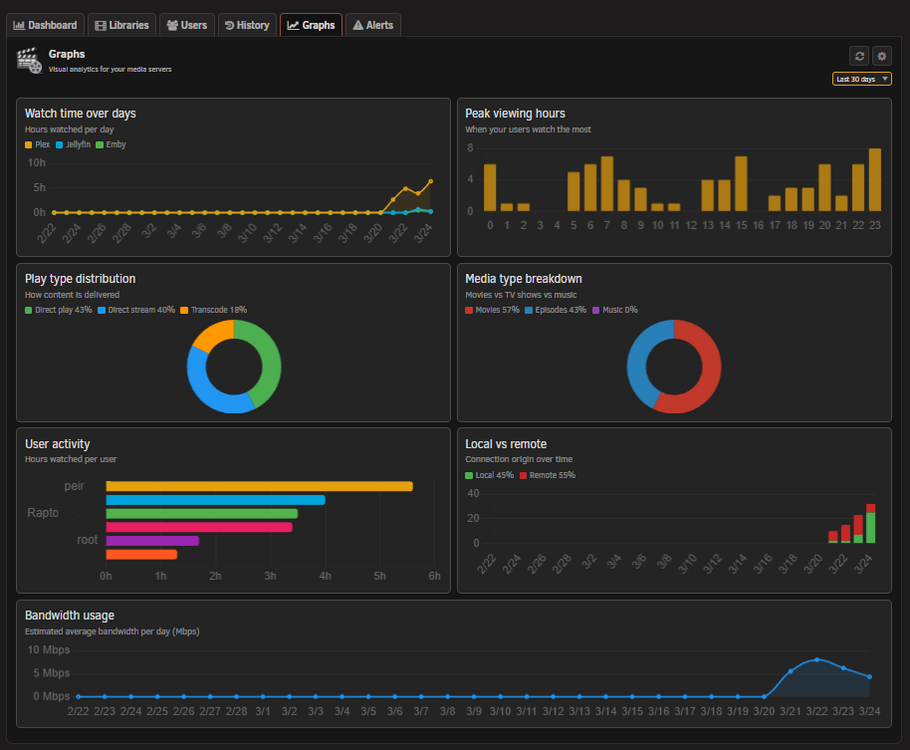
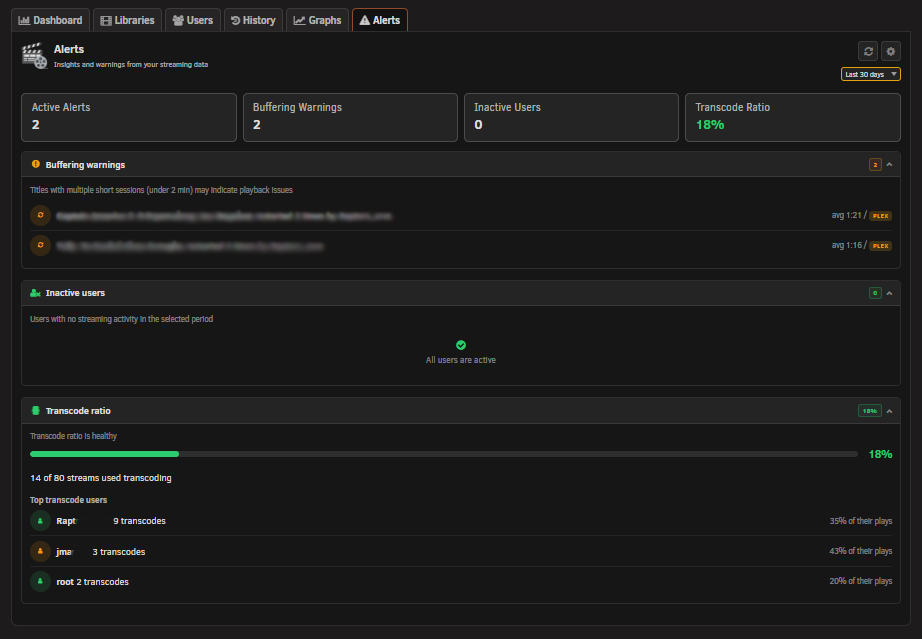
A real-time media stream monitor and statistics tracker. View active streams from your Plex, Jellyfin and Emby servers directly from the dashboard, and track watch history through a dedicated statistics page. Features Dashboard Widget: Monitor active streams in real-time from the Unraid dashboard Multi-server support for up to 10 Plex, Jellyfin and Emby servers simultaneously Stream details including user, device, IP address, playback progress, quality and codec info Custom SVG media type icons for movies, series, music and photos Collapsible Synopsis section with thumbnail, description and dominant color tinting from cover art Collapsible technical details row per stream (codec, audio channels, container, subtitles, HW acceleration, transcode reasons) Transcode monitoring with visual indicators for Direct Play, Direct Stream and Transcode sessions Transcode speed badge on active transcodes Docker CPU and RAM micro-bars per media server container with color thresholds Kill Session button to terminate active streams directly from the widget Badge Color Theme picker with 12 color options for server name badges Configurable auto-refresh with adjustable polling interval Mobile responsive layout Performance friendly with micro-cache, backoff on errors and lightweight polling Dashboard Widget Screenshots: Statistics Tool Page (Beta): Dashboard tab with active streams overview, most watched titles, top users and recent history Libraries tab with server overview, collapsible sections and recently added items Users tab with per-user play counts, watch time, content breakdown and play type distribution History tab with full watch history, filters, search, pagination and CSV export Graphs tab with daily streams, watch time distribution and play type breakdown charts Alerts tab (placeholder for future alert rules) SQLite database with automatic schema migration system Configurable data retention and IP anonymization Statistics Tool Screenshots: Supported Servers: Plex: Sessions, Kill Session, OAuth Setup Jellyfin: Sessions, Kill Session Emby: Sessions, Kill Session Installation: Via Community Applications Search for Stream Viewer and click Install. Configuration: After installation, go to Settings > Stream Viewer. The settings page is organized into three sections. Widget Settings: Auto Refresh: Enable or disable automatic stream refresh Refresh Interval: How often to poll for new stream data (5 to 300 seconds) Max Streams: Limit the number of streams shown (5, 10, 20, 50 or Unlimited) Show Device: Show or hide the client device name Show IP: Show or hide the viewer IP address Badge Color Theme: 12 color options for server name badges (Default, Blue, Lime, Green, Purple, Unraid, Red, Cyan, Pink, Gold, Teal, Mono) Show Progress: Show or hide the playback progress bar Show Quality: Show or hide the stream quality badge Show Transcode: Show or hide the transcode/direct play badge Show Technical Details: Show or hide the collapsible details row Technical Details Default: Start expanded or collapsed Show Media Summary: Show or hide the Synopsis section with thumbnail and description Media Summary Default: Start expanded or collapsed Show Docker Stats: Show or hide CPU/RAM usage per container Allow Kill Session: Enable the ability to terminate active streams Statistics Settings: Statistics: Enable or disable the statistics tool page Database Path: Directory where the SQLite database is stored (must be under /mnt/user/) Data Retention: How many days of watch history to keep (7 to 365 days) Anonymize IP: Mask the last octet of IP addresses before storing Library Sections: Default state (expanded or collapsed) for library server sections Connections Servers Setting: TLS Verification: Enable or disable SSL certificate checking Servers Cards: Server Type: Plex, Jellyfin or Emby Server Name: Custom display name for each server Server URL: The URL of the media server API Token: Server access token (Plex uses OAuth, Jellyfin/Emby use API key) Enable/Disable: Toggle individual servers on or off Plex: Sign in with Plex via OAuth, no password stored. Auto-discovery finds your servers after sign-in. Add discovered servers with one click. Jellyfin: Enter server URL and API key. Test Connection to verify before adding. Emby: Enter server URL and API key. Test Connection to verify before adding. Settings Screenshots: Security: CSRF token (nonce) protection on all API requests with sliding expiration Rate limiting (120 requests per minute per IP) Origin validation blocks cross-origin requests Input validation and sanitization on all parameters Prepared statements for all SQLite queries (no string concatenation) LIKE wildcard escaping with explicit ESCAPE clause Docker container ID hex-only validation before API use Security headers on all API responses (X-Frame-Options, X-Content-Type-Options, CSP, X-XSS-Protection, Referrer-Policy) Image proxy with URL allowlist, only proxies thumbnails from configured servers MIME type validation on proxied images with 5 MB size cap Plex account token never stored, only per-server access tokens are saved Database file permissions restricted to owner only (0600) Cache directory created with restricted permissions (0700) Cache-Control: no-cache, must-revalidate header AJAX-only enforcement (X-Requested-With check) HTTP method restriction (GET/POST only) URL validation on outbound HTTP requests MD5 package integrity verification on install PHP 7 compatible (no PHP 8 only functions) File and Directory Permissions: Plugin directory: 755 PHP files: 644 Page files: 755 Static assets (JS, CSS, PNG): 644 Config directory: 755 Cache directory: 700 Nonce and database files: 600 Requirements: Unraid 7.2.0 or later GitHub Repository: https://github.com/Lazaros-Chalkidis/unraid-streamviewer GitHub Profile: https://github.com/Lazaros-Chalkidis To suggest features, report bugs or share feedback, post here or open an issue on GitHub.

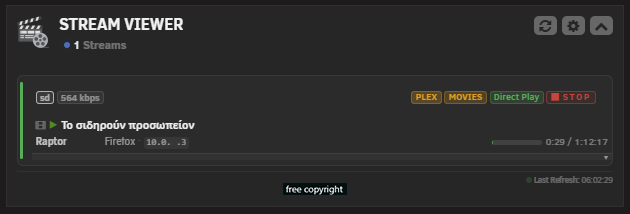
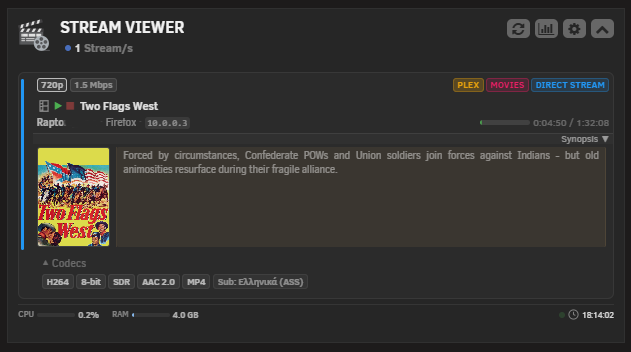
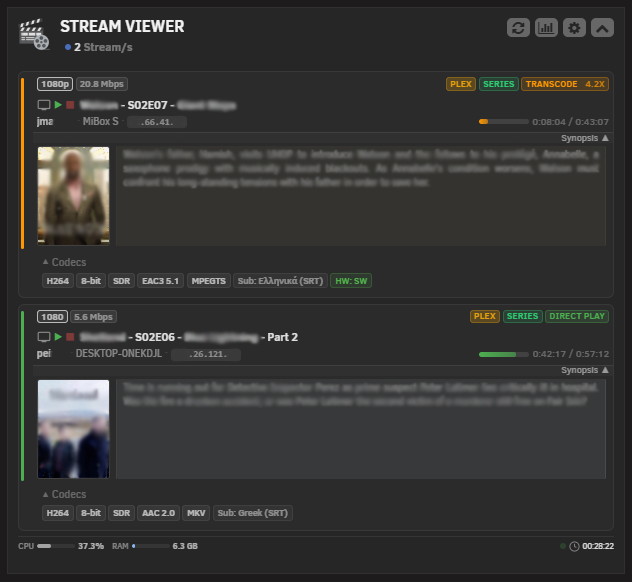
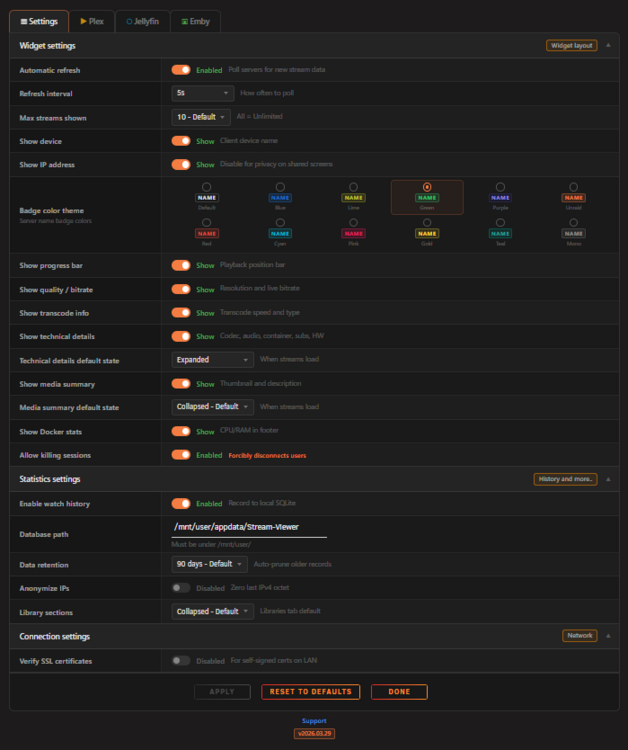
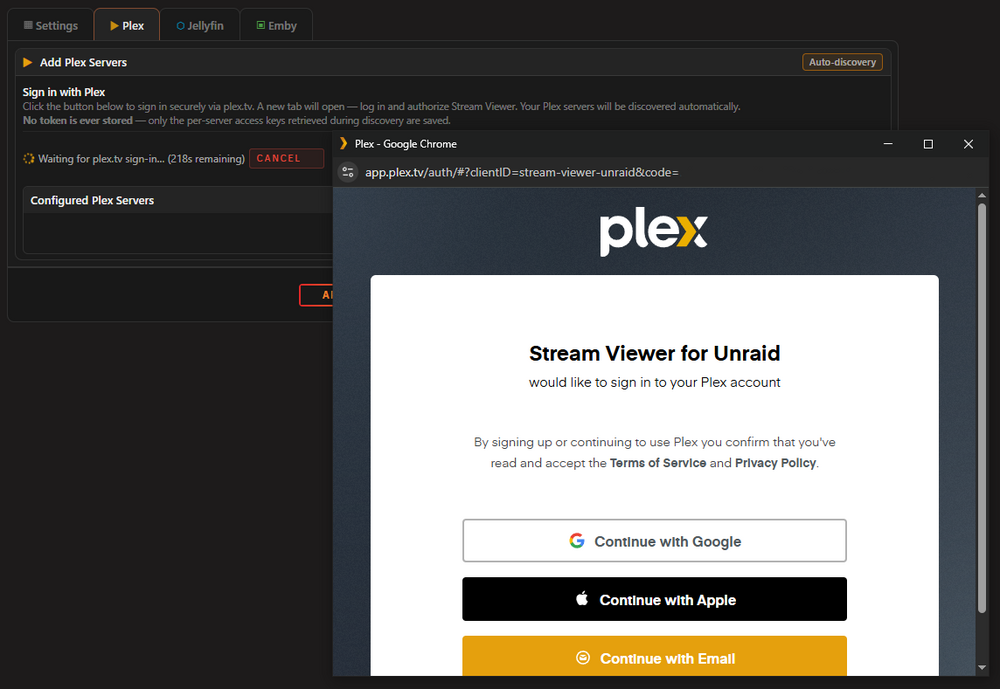
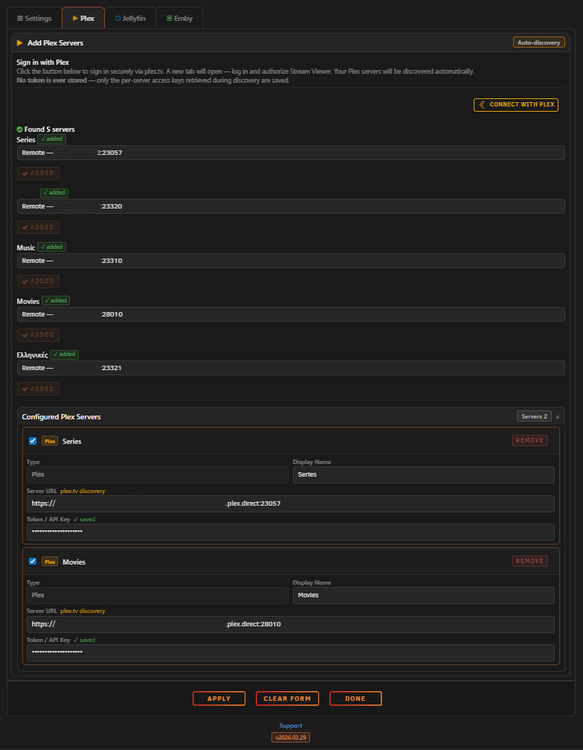
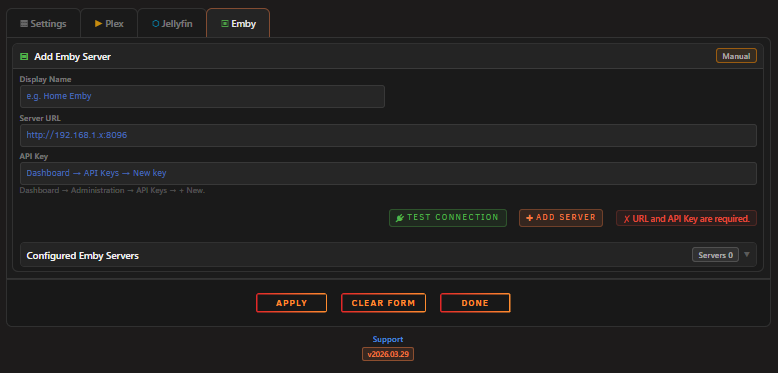
-
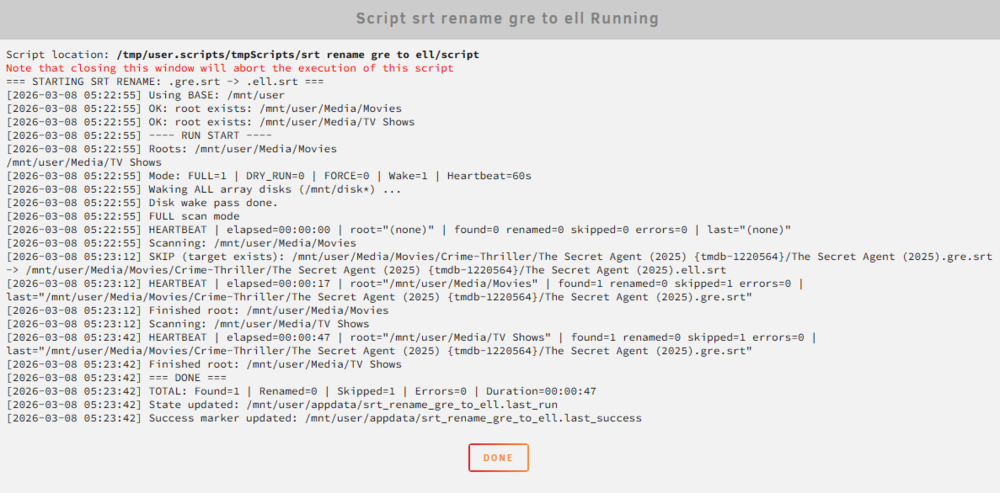
What it doesThis script recursively scans your Media library and renames subtitle files from the deprecated gre ISO 639-2 language code to the correct ell code for Modern Greek. Most modern media players and tools (Jellyfin, Plex, Kodi, etc.) now expect ell and may not recognise gre. Example: Movie.2020.gre.srt → Movie.2020.ell.srt The script is designed to run safely on an Unraid server via the User Scripts plugin, with low I/O and CPU priority so it does not disturb normal operations. *Feel free to adapt for other language code migrations (e.g. heb→iw, iw→he, etc.) RequirementsUnraid with the User Scripts plugin installed (Community Applications) Media stored under a consistent path (e.g. /mnt/user/Media/ or /mnt/user0/Media/) SetupOpen Settings → User Scripts → Add New Script Paste the full script into the editor Edit the variables in the USER CONFIGURATION section at the top (see below) Save and optionally set a schedule (e.g. monthly) Run once with --dry-run first to verify what would be renamed ⚙️ User Configuration — Variables to customiseThese are the only variables you should need to change. Everything else can be left as-is. ROOTS — Your media pathsROOTS=( "$BASE/Media/Movies" "$BASE/Media/TV Shows" ) Change these to match your actual folder names. Add or remove lines as needed. # Examples: ROOTS=( "$BASE/Media/Films" "$BASE/Media/Series" "$BASE/Media/Documentaries" ) LOG — Log file locationLOG="/mnt/user/appdata/srt_rename_gre_to_ell.log" Change this if you prefer logs in a different location, e.g. inside a dedicated appdata subfolder. LOG_MAX_LINES — Log rotation sizeLOG_MAX_LINES=5000 The log file is trimmed to this many lines at the start of each run. Increase if you have a very large library and want more history, or decrease to keep things lean. HEARTBEAT_SECS — Progress logging intervalHEARTBEAT_SECS=60 How often (in seconds) a progress line is written to the log while scanning. Useful for monitoring long runs. Set to 300 for less noise, or 15 for very frequent updates. 🚀 Run flags (optional)You can pass these as Script Arguments in the User Scripts UI, or append them to the script call: Flag Description --dry-run Preview only — no files are renamed. Always run this first! --force Rename even if a .ell.srt file already exists at the destination --inc Incremental mode — only scan files newer than the last successful run --full Full scan (default) — scan all files every time --wake Wake all array disks before scanning (default: enabled) Recommended first run: Set Script Arguments to --dry-run and check the log at the path defined in LOG. 📋 What gets loggedEach run produces entries like: [2025-03-08 14:00:01] ---- RUN START ---- [2025-03-08 14:00:01] Mode: FULL=1 | DRY_RUN=0 | FORCE=0 | Wake=1 | Heartbeat=60s [2025-03-08 14:01:03] Renamed: /mnt/user/Media/Movies/Foo (2020)/Foo.gre.srt -> Foo.ell.srt [2025-03-08 14:02:00] HEARTBEAT | elapsed=00:02:00 | found=145 renamed=12 skipped=3 errors=0 [2025-03-08 14:05:22] === DONE === [2025-03-08 14:05:22] TOTAL: Found=892 | Renamed=47 | Skipped=5 | Errors=0 | Duration=00:05:21 📝 Full Script#!/bin/bash set -euo pipefail IFS=$'\n\t' renice -n 15 -p $$ >/dev/null 2>&1 || true ionice -c2 -n7 -p $$ >/dev/null 2>&1 || true echo "=== STARTING SRT RENAME: .gre.srt -> .ell.srt ===" # ============================================================ # USER CONFIGURATION — edit these to match your setup # ============================================================ BASE="/mnt/user" [[ -d "/mnt/user0/Media" ]] && BASE="/mnt/user0" ROOTS=( "$BASE/Media/Movies" "$BASE/Media/TV Shows" ) LOG="/mnt/user/appdata/srt_rename_gre_to_ell.log" STATE="/mnt/user/appdata/srt_rename_gre_to_ell.last_run" SUCCESS_MARK="/mnt/user/appdata/srt_rename_gre_to_ell.last_success" LOG_MAX_LINES=5000 HEARTBEAT_SECS=60 # ============================================================ # END OF USER CONFIGURATION # ============================================================ DRY_RUN=0 FORCE=0 FULL=1 WAKE_DISKS=1 while [[ $# -gt 0 ]]; do arg="${1//$'\r'/}" case "$arg" in "") shift ;; --dry-run) DRY_RUN=1; shift ;; --force) FORCE=1; shift ;; --full) FULL=1; shift ;; --inc) FULL=0; shift ;; --wake) WAKE_DISKS=1; shift ;; *) echo "Unknown option: [$(printf '%q' "$arg")]"; exit 1 ;; esac done mkdir -p "$(dirname "$LOG")" if [[ -f "$LOG" ]]; then tmp_log="$(mktemp)" tail -n "$LOG_MAX_LINES" "$LOG" > "$tmp_log" && mv "$tmp_log" "$LOG" fi fmt_secs() { local s="$1" printf "%02d:%02d:%02d" $((s/3600)) $(((s%3600)/60)) $((s%60)) } log() { local msg="$1" local ts ts="$(date '+%F %T')" echo "[$ts] $msg" | tee -a "$LOG" logger -t srt-rename "$msg" 2>/dev/null || true } missing=0 log "Using BASE: $BASE" for r in "${ROOTS[@]}"; do if [[ ! -d "$r" ]]; then log "ERROR: root not found: $r" missing=1 else log "OK: root exists: $r" fi done if [[ $missing -eq 1 ]]; then log "ABORT: Fix ROOTS and rerun." exit 1 fi START_TS="$(date +%s)" CURRENT_ROOT="(none)" LAST_FILE="(none)" LAST_BEAT_TS="$START_TS" found=0 renamed=0 skipped=0 errors=0 beat() { local now elapsed now="$(date +%s)" elapsed=$((now - START_TS)) log "HEARTBEAT | elapsed=$(fmt_secs "$elapsed") | root=\"$CURRENT_ROOT\" | found=$found renamed=$renamed skipped=$skipped errors=$errors | last=\"$LAST_FILE\"" LAST_BEAT_TS="$now" } wake_all_disks() { log "Waking ALL array disks (/mnt/disk*) ..." shopt -s nullglob for d in /mnt/disk*; do [[ -d "$d" ]] || continue ls -1 "$d" >/dev/null 2>&1 || true done shopt -u nullglob log "Disk wake pass done." } process_one() { local file="$1" found=$(( found + 1 )) LAST_FILE="$file" local new_file new_file="$(printf '%s' "$file" | sed -E 's/\.gre\.srt$/.ell.srt/')" if [[ "$new_file" == "$file" ]]; then skipped=$(( skipped + 1 )) return fi if [[ -e "$new_file" && $FORCE -eq 0 ]]; then skipped=$(( skipped + 1 )) log "SKIP (target exists): $file -> $new_file" return fi if [[ $DRY_RUN -eq 1 ]]; then renamed=$(( renamed + 1 )) log "[DRY-RUN] Would rename: $file -> $new_file" return fi if mv -- "$file" "$new_file"; then renamed=$(( renamed + 1 )) log "Renamed: $file -> $new_file" else errors=$(( errors + 1 )) log "ERROR renaming: $file" fi } log "---- RUN START ----" log "Roots: ${ROOTS[*]}" log "Mode: FULL=$FULL | DRY_RUN=$DRY_RUN | FORCE=$FORCE | Wake=$WAKE_DISKS | Heartbeat=${HEARTBEAT_SECS}s" if [[ $WAKE_DISKS -eq 1 ]]; then wake_all_disks fi if [[ $FULL -eq 0 ]]; then if [[ -f "$STATE" ]]; then log "Incremental since: $(date -r "$STATE")" else log "Incremental since: (none) -> first run will behave like full for matches" fi else log "FULL scan mode" fi beat for root in "${ROOTS[@]}"; do CURRENT_ROOT="$root" log "Scanning: $root" if [[ $FULL -eq 0 && -f "$STATE" ]]; then while IFS= read -r -d '' file; do now="$(date +%s)" if (( now - LAST_BEAT_TS >= HEARTBEAT_SECS )); then beat fi process_one "$file" done < <(find "$root" \( -type d -name ".Recycle.Bin" -prune \) -o \ \( -type f -iname "*.gre.srt" -newer "$STATE" -print0 \)) else while IFS= read -r -d '' file; do now="$(date +%s)" if (( now - LAST_BEAT_TS >= HEARTBEAT_SECS )); then beat fi process_one "$file" done < <(find "$root" \( -type d -name ".Recycle.Bin" -prune \) -o \ \( -type f -iname "*.gre.srt" -print0 \)) fi beat log "Finished root: $root" done END_TS="$(date +%s)" TOTAL_SECS=$((END_TS - START_TS)) log "=== DONE ===" log "TOTAL: Found=$found | Renamed=$renamed | Skipped=$skipped | Errors=$errors | Duration=$(fmt_secs "$TOTAL_SECS")" if [[ $DRY_RUN -eq 0 && $errors -eq 0 ]]; then touch "$STATE" touch "$SUCCESS_MARK" log "State updated: $STATE" log "Success marker updated: $SUCCESS_MARK" else log "State NOT updated (dry-run or errors present)" fi exit 0 NotesThe script skips .Recycle.Bin folders automatically If a .ell.srt file already exists at the destination, the original is skipped (use --force to override) State files are only updated if the run completes with zero errors Logs go to both the file and Unraid's syslog (logger) Tested on Unraid 7.2.+ 📁 GitHub Repository: Link
-
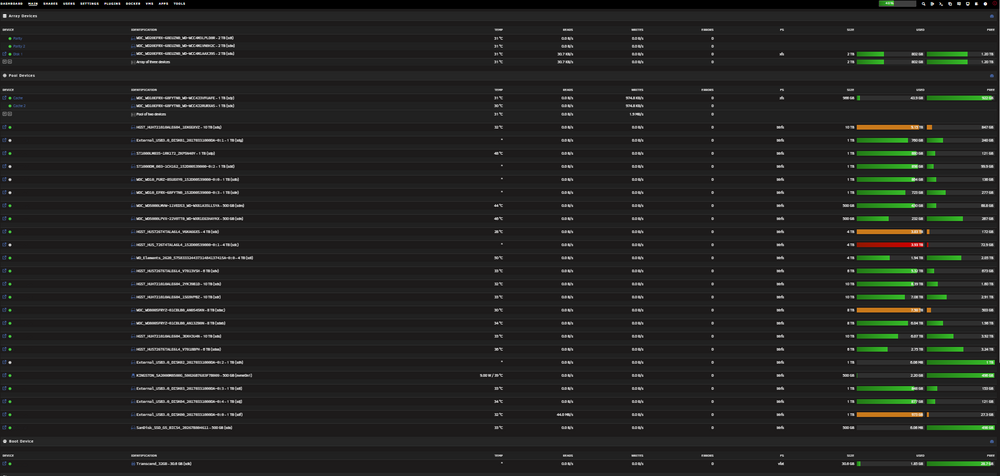
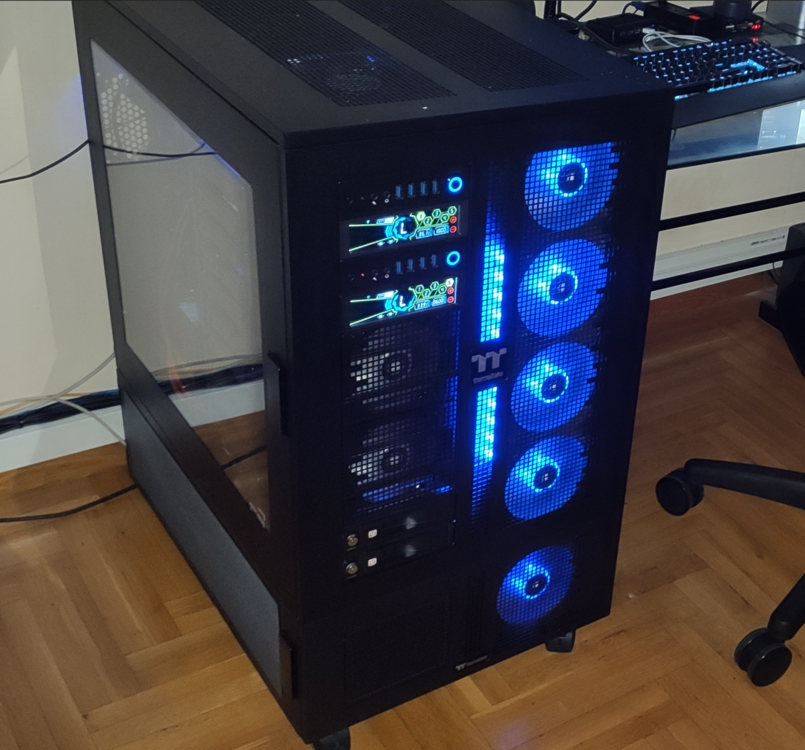
98+ TB - 30 HDD
-
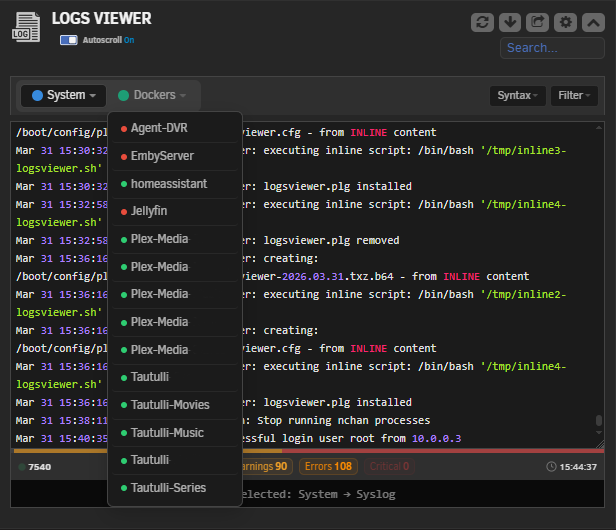
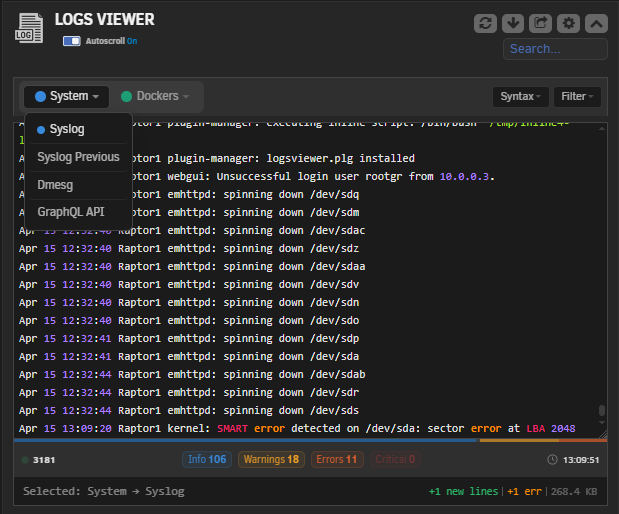
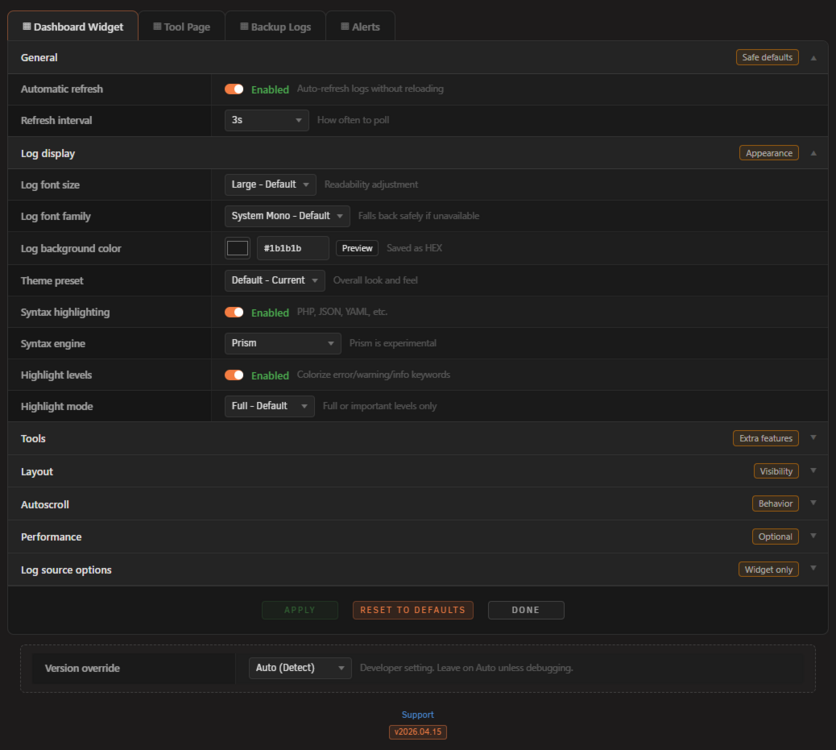
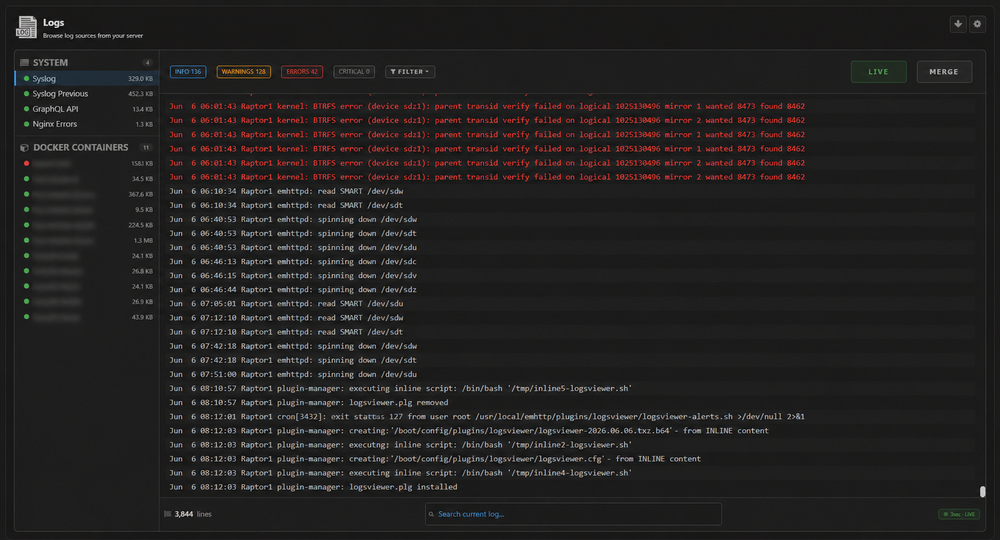
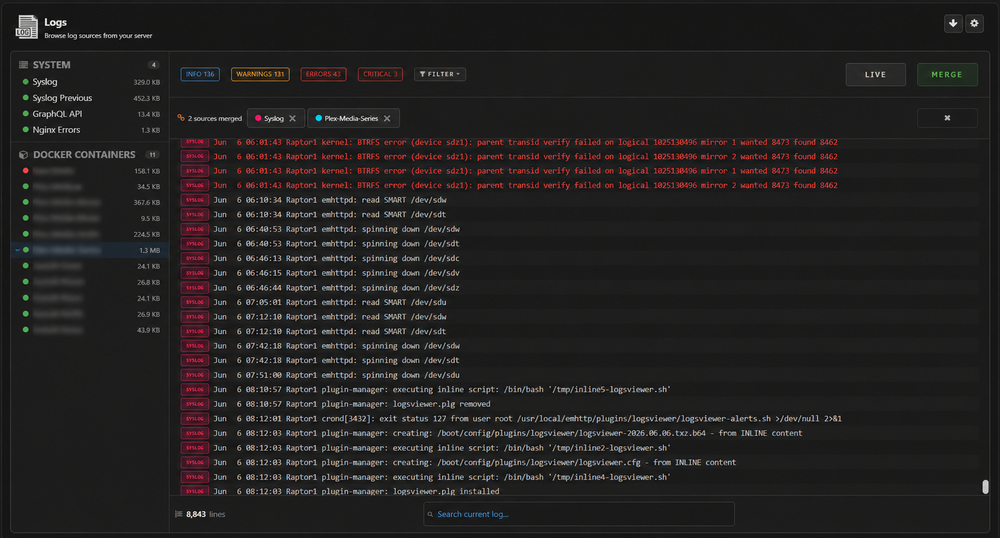
Real-time system, Docker and VM log viewer with dashboard widget and dedicated Tools page. Log backups and system alerts. Live auto-refresh, severity badges, search, filtering, syntax highlighting and export. Features Dashboard Widget with live auto-refresh and severity proportion strip Tools Page for full-screen, focused log viewing System Logs: Syslog, Syslog Previous, Dmesg, GraphQL API, Nginx Errors, PHP Log, Libvirt Docker Logs with real-time running/stopped status indicators VM Logs with real-time running/stopped status indicators Log Backups: scheduled daily snapshots of all enabled sources, compressed and stored on a path you choose, with retention control and calendar-based download Alerts: pattern-based rules that scan logs every 1/2/5 minutes and push notifications through Unraid's notification system when a match is found. Includes one-click presets for failed logins, disk errors, OOM, kernel panics, array errors and Docker crashes Search: match highlighting with next/prev navigation Filtering: by severity level (Info, Warnings, Errors, Critical) or login events Severity Badges: clickable counters that double as quick filters Proportion Strip: color bar in the footer showing the error/warning/info ratio at a glance Syntax Highlighting: Highlight.js and Prism.js bundled locally, no CDN calls Autoscroll: follows new entries as they arrive, with pause-on-hover option Export: .log, .txt or structured .json with parsed timestamps and levels Responsive: works from wide monitors down to phones (five breakpoints) Theme Support: Black, Gray, Azure and White Independent Settings: Dashboard widget and Tool page configured separately Performance Friendly: single-source polling, content hash detection, pre-compiled regex, smart tail limits Dashboard Screenshots: Tool page Screenshots: Installation Community Applications: search for Logs Viewer → Install Configuration Go to Settings > Logs Viewer after installing. Four tabs: Dashboard, Tool, Backup and Alerts, each with their own settings. GENERAL Automatic Refresh: enable/disable live polling Refresh Interval: how often to poll (seconds) LOG DISPLAY Appearance Log Font Size: adjustable (default: Large) Log Font Family: system, monospace, JetBrains Mono, Fira Code, Source Code Pro, IBM Plex Mono Log Background Color: custom color picker Theme Preset: color theme presets Syntax Syntax Highlighting: on/off Syntax Engine: Highlight.js or Prism.js (beta) Highlight Levels: colorize Info, Warning, Error, Critical keywords Highlight Mode: full or keywords-only TOOLS Search Search in log: enable/disable Highlight search matches: on/off Export Export Format: .log / .txt / .json Include timestamp in filename: on/off LAYOUT Show badges: severity counters (clickable as filters) Show total lines: line count with pulse indicator Show timestamp: 24-hour clock in footer Show filter dropdown: quick severity filter in tabs rail Show toast: notification bar in footer Widget height: resizable AUTOSCROLL Autoscroll default: initial state on load Pause on hover: stop scrolling when mouse is over the log PERFORMANCE Show only last N lines: 0 = full log, or 200 / 500 / 800 / 1500 LOG SOURCES System Logs: pick which ones to show Docker Logs: select containers (auto-discovered with status) VM Logs: select VMs (auto-discovered with status) Log Sources System Logs: Syslog (/var/log/syslog), Dmesg, Nginx Errors, GraphQL API, PHP Log, Libvirt. Selectable per page. Docker Logs All containers discovered automatically. Each one shows a green or red dot for its current state. Pick which ones you want to monitor. VM Logs All VMs discovered automatically with the same status dots. Export Formats: - .log : plain text - .txt : plain text - .json : structured with parsed timestamp, level, hostname and service per line New Features v.2026.04.15 Log Backups: Daily compressed backups of all enabled log sources (system, Docker, VMs) to a storage path of your choice. Settings include: Backup time (configurable hour) Storage path (defaults to /mnt/user/appdata/Logs-Viewer-Backup) Retention period (automatic cleanup of old backups) Calendar view in the Settings page showing available dates One-click ZIP download for any backup date Backup directories are created with restricted permissions (700) so they are not exposed through Samba shares. Alerts The alert system scans log sources at regular intervals and sends notifications through Unraid's built-in notification system when a pattern match is found. How it works: Define rules with a name, text or regex pattern, target sources and severity level Set a cooldown per rule to avoid repeated notifications for the same event The scanner runs as a cron job every 1, 2 or 5 minutes depending on your setting Matches are logged in the alert history (visible in the Settings page) and pushed as Unraid notifications Built-in presets (one click): Failed Login (syslog) Disk Error (syslog, dmesg) Out of Memory (syslog, dmesg) Kernel Panic (syslog, dmesg) Array Error (syslog) Docker Crash (docker logs) You can add your own rules on top of these. Settings Screenshots: Security Information: CSRF nonce on every API request (hourly rotation, stored in /tmp)¹ Rate limiting: 60 requests/minute per IP Origin validation blocks cross-origin requests XSS sanitizer strips all span attributes except class, validates values against a character whitelist All htmlspecialchars calls use ENT_QUOTES INI writes strip control characters to block injection Whitelist validators on all settings fields (interval, theme, engine, format, font size, etc.) VM log paths checked with realpath to prevent directory traversal Content-hash parameter validated against a strict hex regex Alert patterns capped at 500 chars with lowered backtrack limit to prevent ReDoS Security headers on all API responses (X-Content-Type-Options, X-Frame-Options, CSP, Referrer-Policy) MD5 package integrity check on install File permissions: Plugin directory: 755 PHP / Page / Asset files: 644 Config file and directory: 600 / 700 Cache directory: 700 Backup directory: 700 No world-writable files ¹ Custom nonce instead of Unraid's built-in csrf_token. Keeps the API self-contained. Requirements Unraid 7.2.0 or later GitHub Repository: https://github.com/Lazaros-Chalkidis/unraid-logsviewer GitHub Profile: https://github.com/Lazaros-Chalkidis Feedback, bug reports or feature ideas welcome here or on GitHub Issues.
-
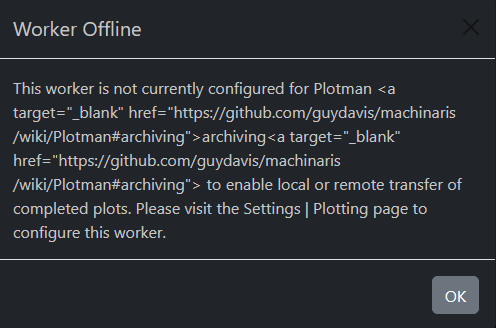
Hi, a litle issue on this popup