






namida
Members
-
Joined
-
Last visited
Everything posted by namida
-
-
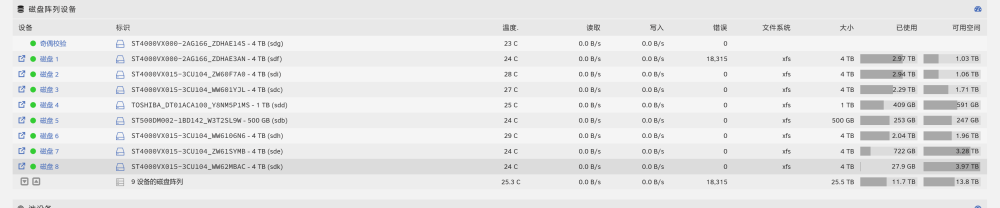
从6.12.3更新到6.12.8,原本设置每月校验一次并且勾选了将校验数据写入校验盘,但现在校验速率实在是太低,只有不到1MB/S的速度,原来在6.12.3的版本里是可以跑慢校验盘的速率,大概120MB/S,附上阵列池内的硬盘信息

-
选择5700x+C8DH(X570芯片组)可以吗,有点担心AMD CPU在unraid环境下会出现奇怪的BUG
-
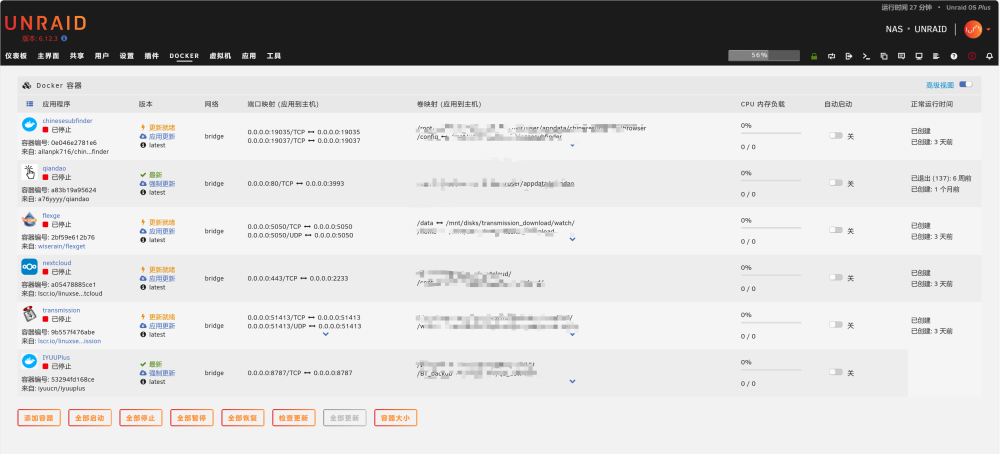
in the Dashboard page can displayed all docker but in the docker page cannot displayed all docker Restarting unraid still cannot solve the problem unraid-diagnostics-20231101-1523.zip

-
The driver has been successfully installed, thank you very much 非常感谢你 ありがと

-
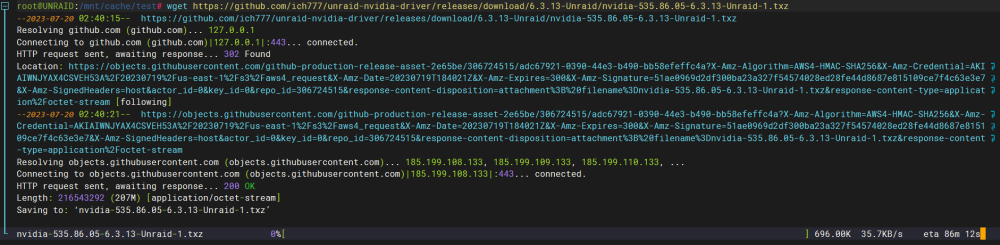
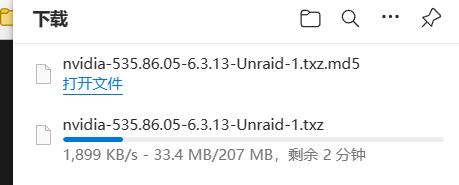
I can download these two files, but the download speed on the unraid side is very slow, can I use Windows to download these two files now, and then put them in the specified directory?
-
Sorry, I misunderstood what you meant just now, this is the result of the test root@UNRAID:/boot/imags# wget https://github.com/jellyfin/jellyfin/archive/refs/tags/v10.8.10.zip && rm v10.8.10.zip --2023-07-20 02:22:31-- https://github.com/jellyfin/jellyfin/archive/refs/tags/v10.8.10.zip Resolving github.com (github.com)... 127.0.0.1 Connecting to github.com (github.com)|127.0.0.1|:443... connected. HTTP request sent, awaiting response... 302 Found Location: https://codeload.github.com/jellyfin/jellyfin/zip/refs/tags/v10.8.10 [following] --2023-07-20 02:22:32-- https://codeload.github.com/jellyfin/jellyfin/zip/refs/tags/v10.8.10 Resolving codeload.github.com (codeload.github.com)... 20.205.243.165 Connecting to codeload.github.com (codeload.github.com)|20.205.243.165|:443... connected. HTTP request sent, awaiting response... 200 OK Length: unspecified [application/zip] Saving to: ‘v10.8.10.zip’ v10.8.10.zip [ <=> ] 2.74M 2.45MB/s in 1.1s 2023-07-20 02:22:34 (2.45 MB/s) - ‘v10.8.10.zip’ saved [2875484]
-
Running the command you gave did not give me the output download speed, then I ran the command you replied to the above post, the output is that the driver is downloaded, but the webui prompts that the download is not completed root@UNRAID:~# wget -qO- https://raw.githubusercontent.com/ich777/unraid-plugin_update_helper/master/force_package_update | bash Please don't close this window until it says finished! Finished, please take a look at your unRAID notifications if all packages where downloaded correctly! root@UNRAID:~# pcregrep -oM 'Linux kernel[\s\S]*?version\s+\K\d+(\.\d+)+' /boot/changes.txt | sort -V | tail -1 6.1.38 root@UNRAID:~# wget -qO- https://api.github.com/repos/ich777/unraid-nvidia-driver/releases/tags/6.1.38-Unraid | jq -r '.assets[].name' | grep -E -v '\.md5$' | grep "nvidia" | sort -V | tail -1 nvidia-535.86.05-6.1.38-Unraid-1.txz


-
Actually, the word should be used as anxious,Google translation is a little inaccurate (English is very bad。 The following is the test. I set up the agent according to this blog. It seems that the download speed of this file is very fast, but the download driver is very slow https://www.konoka.top/nas/54/ root@UNRAID:~# wget https://raw.githubusercontent.com/jellyfin/jellyfin/master/README.md && rm README.md --2023-07-20 02:03:12-- https://raw.githubusercontent.com/jellyfin/jellyfin/master/README.md Resolving raw.githubusercontent.com (raw.githubusercontent.com)... 127.0.0.1 Connecting to raw.githubusercontent.com (raw.githubusercontent.com)|127.0.0.1|:443... connected. HTTP request sent, awaiting response... 200 OK Length: 11978 (12K) [text/plain] Saving to: ‘README.md’ README.md 100%[====================================================================>] 11.70K --.-KB/s in 0s 2023-07-20 02:03:13 (608 MB/s) - ‘README.md’ saved [11978/11978]
-
Sorry, I was too impatient, very sorry, thank you for being willing to solve this problem for me
-
Then you tell me to come out and see the download progress on the webui output interface of the plug-in, where else can I see the download progress, such as checking the installation progress through the command line
-
In other words, the driver can only be downloaded and installed from the webui interface of the plug-in, and it is impossible to manually upload the driver file to complete the driver installation (the GitHub website I visit on Windows is smoother than that of unriad.
-
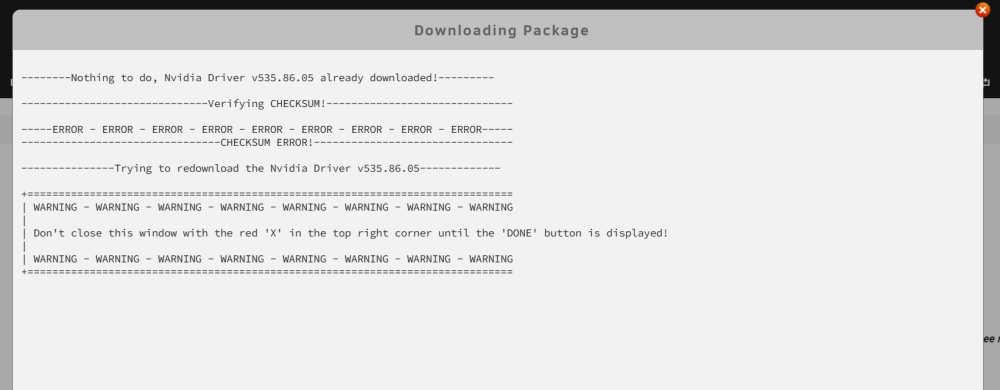
I click to re-download the driver now, but he will always be stuck in this interface. When I just updated unriad, I clicked the update card for more than an hour and there was no change, so I would like to ask if you have a manual installation method, such as the command OK, or I download the driver file on Windows and upload it to unraid
-
thank you
-
Here is the diagnostic file unraid-diagnostics-20230720-0101.zip
-
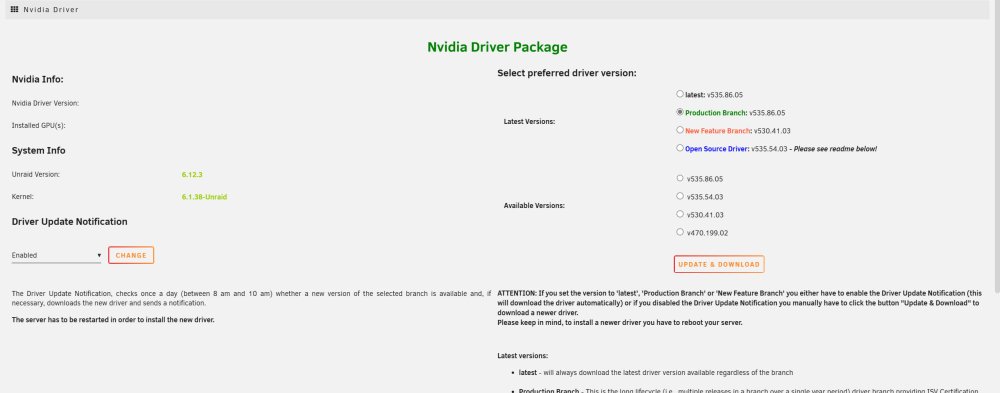
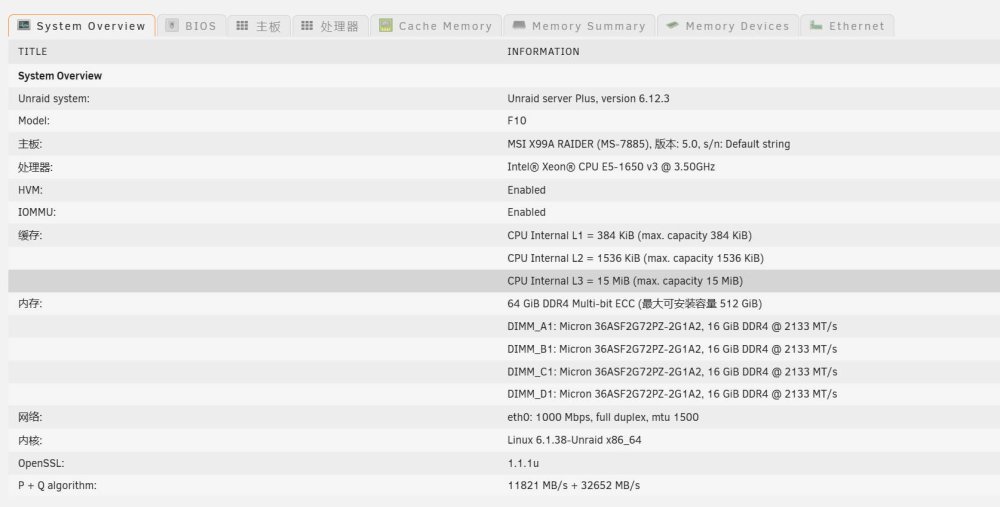
Update to unraid 6.12.3 ,cannot recognize the Nvidia graphics card ,There are no error messages in the NVidia-driver。You can see the Nvidia graphics card in the system device。Model is Quadro P1000。How to solve this, I hope a blogger can give a solution, thank you。 This is the configuration of the machine


-
I tried different devices, devices that did not open the browser just after booting up, Android, etc., all showed that they could not be loaded (there was no error message in the browser, this problem has appeared since I updated unraid on the 6th. And I just entered The diagnostics command is not available. The ssh interface has been stuck, and it will not show that the log collection is complete after waiting for an hour. So I can only provide yesterday’s log files (helpless I just restarted unraid and it's definitely accessible now, but I'm not sure if it will happen after a while
-
You can access the webui just after booting up, but you can’t access it after a few hours after booting up. The edge display keeps loading without returning any errors. The ports on the docker service are accessible, such as port 8096 of jellyfin. , the ip configured by the direct network card in the virtual machine is also accessible, but the unraid webui cannot be accessed Using the commands provided in the post, I did not find the same error as in the post hope that can provide a solution thanks The virtual machine is not currently enabled, and unraid has only one network card root@UNRAID:~# cat /etc/nginx/conf.d/servers.conf # # Listen on local socket for nchan publishers # server { listen unix:/var/run/nginx.socket default_server; location ~ /pub/(.*)$ { nchan_publisher; nchan_channel_id "$1"; nchan_message_buffer_length $arg_buffer_length; } location ~ /nchan_stub_status$ { nchan_stub_status; } } # # Always accept http requests from localhost # ex: http://localhost # ex: http://127.0.0.1 # ex: http://[::1] # server { listen 127.0.0.1:81; # lo listen 127.0.0.1:444; # lo listen [::1]:81; # lo listen [::1]:444; # lo # include /etc/nginx/conf.d/locations.conf; } # # Port settings for http protocol # ex: http://tower (IP address resolved via NetBIOS) # ex: http://tower.local (IP address resolved via mDNS) # ex: http://192.168.1.100 # ex: http://[::ffff:192.168.1.100] # server { listen 192.168.31.100:81 default_server; # br0 listen 10.253.0.1:81 default_server; # wg0 listen [fd00:6868:6868::63c]:81 default_server; # br0 listen [fc00:253::1]:81 default_server; # wg0 # location ~ /wsproxy/81/ { return 403; } include /etc/nginx/conf.d/locations.conf; } root@UNRAID:~# ifconfig br0: flags=4163<UP,BROADCAST,RUNNING,MULTICAST> mtu 1500 inet 192.168.31.100 netmask 255.255.255.0 broadcast 0.0.0.0 inet6 fe80::4ecc:6aff:fe6d:b221 prefixlen 64 scopeid 0x20<link> inet6 fd00:6868:6868:0:4ecc:6aff:fe6d:b221 prefixlen 64 scopeid 0x0<global> inet6 fd00:6868:6868::63c prefixlen 128 scopeid 0x0<global> ether 4c:cc:6a:6d:b2:21 txqueuelen 1000 (Ethernet) RX packets 1741654 bytes 711537620 (678.5 MiB) RX errors 0 dropped 0 overruns 0 frame 0 TX packets 4726591 bytes 4640681486 (4.3 GiB) TX errors 0 dropped 0 overruns 0 carrier 0 collisions 0 br-7d53774d62c8: flags=4099<UP,BROADCAST,MULTICAST> mtu 1500 inet 172.31.200.1 netmask 255.255.255.0 broadcast 172.31.200.255 ether 02:42:18:13:c2:d1 txqueuelen 0 (Ethernet) RX packets 0 bytes 0 (0.0 B) RX errors 0 dropped 0 overruns 0 frame 0 TX packets 0 bytes 0 (0.0 B) TX errors 0 dropped 0 overruns 0 carrier 0 collisions 0 docker0: flags=4163<UP,BROADCAST,RUNNING,MULTICAST> mtu 1500 inet 172.17.0.1 netmask 255.255.0.0 broadcast 172.17.255.255 inet6 fd17::1 prefixlen 64 scopeid 0x0<global> inet6 fe80::1 prefixlen 64 scopeid 0x20<link> inet6 fe80::42:6fff:feaa:aae1 prefixlen 64 scopeid 0x20<link> ether 02:42:6f:aa:aa:e1 txqueuelen 0 (Ethernet) RX packets 3720971 bytes 4414205020 (4.1 GiB) RX errors 0 dropped 0 overruns 0 frame 0 TX packets 1546794 bytes 688495753 (656.6 MiB) TX errors 0 dropped 0 overruns 0 carrier 0 collisions 0 eth0: flags=4419<UP,BROADCAST,RUNNING,PROMISC,MULTICAST> mtu 1500 inet6 fe80::4ecc:6aff:fe6d:b221 prefixlen 64 scopeid 0x20<link> ether 4c:cc:6a:6d:b2:21 txqueuelen 1000 (Ethernet) RX packets 1929172 bytes 756811557 (721.7 MiB) RX errors 0 dropped 52 overruns 0 frame 0 TX packets 4817604 bytes 4665284252 (4.3 GiB) TX errors 0 dropped 0 overruns 0 carrier 0 collisions 0 device interrupt 20 memory 0xfb400000-fb420000 lo: flags=73<UP,LOOPBACK,RUNNING> mtu 65536 inet 127.0.0.1 netmask 255.0.0.0 inet6 ::1 prefixlen 128 scopeid 0x10<host> loop txqueuelen 1000 (Local Loopback) RX packets 92855 bytes 18026544 (17.1 MiB) RX errors 0 dropped 0 overruns 0 frame 0 TX packets 92855 bytes 18026544 (17.1 MiB) TX errors 0 dropped 0 overruns 0 carrier 0 collisions 0 veth008b021: flags=4163<UP,BROADCAST,RUNNING,MULTICAST> mtu 1500 inet6 fe80::4c29:23ff:fe1f:6df3 prefixlen 64 scopeid 0x20<link> ether 4e:29:23:1f:6d:f3 txqueuelen 0 (Ethernet) RX packets 1112 bytes 1379724 (1.3 MiB) RX errors 0 dropped 0 overruns 0 frame 0 TX packets 6226 bytes 1221527 (1.1 MiB) TX errors 0 dropped 0 overruns 0 carrier 0 collisions 0 veth101c5a4: flags=4163<UP,BROADCAST,RUNNING,MULTICAST> mtu 1500 inet6 fe80::a0a3:13ff:fe2a:f801 prefixlen 64 scopeid 0x20<link> ether a2:a3:13:2a:f8:01 txqueuelen 0 (Ethernet) RX packets 163 bytes 19923 (19.4 KiB) RX errors 0 dropped 0 overruns 0 frame 0 TX packets 5303 bytes 968467 (945.7 KiB) TX errors 0 dropped 0 overruns 0 carrier 0 collisions 0 veth1defc4b: flags=4163<UP,BROADCAST,RUNNING,MULTICAST> mtu 1500 inet6 fe80::9018:2cff:feeb:400 prefixlen 64 scopeid 0x20<link> ether 92:18:2c:eb:04:00 txqueuelen 0 (Ethernet) RX packets 2869 bytes 69385968 (66.1 MiB) RX errors 0 dropped 0 overruns 0 frame 0 TX packets 12127 bytes 1746656 (1.6 MiB) TX errors 0 dropped 0 overruns 0 carrier 0 collisions 0 veth2bb588f: flags=4163<UP,BROADCAST,RUNNING,MULTICAST> mtu 1500 inet6 fe80::48b8:bcff:fe90:6205 prefixlen 64 scopeid 0x20<link> ether 4a:b8:bc:90:62:05 txqueuelen 0 (Ethernet) RX packets 49 bytes 4003 (3.9 KiB) RX errors 0 dropped 0 overruns 0 frame 0 TX packets 5175 bytes 922882 (901.2 KiB) TX errors 0 dropped 0 overruns 0 carrier 0 collisions 0 veth3763cde: flags=4163<UP,BROADCAST,RUNNING,MULTICAST> mtu 1500 inet6 fe80::7cd8:1eff:fe23:281d prefixlen 64 scopeid 0x20<link> ether 7e:d8:1e:23:28:1d txqueuelen 0 (Ethernet) RX packets 25 bytes 1846 (1.8 KiB) RX errors 0 dropped 0 overruns 0 frame 0 TX packets 5201 bytes 920114 (898.5 KiB) TX errors 0 dropped 0 overruns 0 carrier 0 collisions 0 veth3cafa97: flags=4163<UP,BROADCAST,RUNNING,MULTICAST> mtu 1500 inet6 fe80::1c07:4bff:fe12:a763 prefixlen 64 scopeid 0x20<link> ether 1e:07:4b:12:a7:63 txqueuelen 0 (Ethernet) RX packets 26 bytes 1916 (1.8 KiB) RX errors 0 dropped 0 overruns 0 frame 0 TX packets 5160 bytes 916304 (894.8 KiB) TX errors 0 dropped 0 overruns 0 carrier 0 collisions 0 veth4f334c3: flags=4163<UP,BROADCAST,RUNNING,MULTICAST> mtu 1500 inet6 fe80::4e2:87ff:fe56:d56b prefixlen 64 scopeid 0x20<link> ether 06:e2:87:56:d5:6b txqueuelen 0 (Ethernet) RX packets 25 bytes 1846 (1.8 KiB) RX errors 0 dropped 0 overruns 0 frame 0 TX packets 5172 bytes 917296 (895.7 KiB) TX errors 0 dropped 0 overruns 0 carrier 0 collisions 0 veth76cf176: flags=4163<UP,BROADCAST,RUNNING,MULTICAST> mtu 1500 inet6 fe80::9877:22ff:fe84:4ac9 prefixlen 64 scopeid 0x20<link> ether 9a:77:22:84:4a:c9 txqueuelen 0 (Ethernet) RX packets 54 bytes 4585 (4.4 KiB) RX errors 0 dropped 0 overruns 0 frame 0 TX packets 5165 bytes 922327 (900.7 KiB) TX errors 0 dropped 0 overruns 0 carrier 0 collisions 0 veth917b0fd: flags=4163<UP,BROADCAST,RUNNING,MULTICAST> mtu 1500 inet6 fe80::6c33:fcff:fe67:753f prefixlen 64 scopeid 0x20<link> ether 6e:33:fc:67:75:3f txqueuelen 0 (Ethernet) RX packets 7002 bytes 6963248 (6.6 MiB) RX errors 0 dropped 0 overruns 0 frame 0 TX packets 2978 bytes 562652 (549.4 KiB) TX errors 0 dropped 0 overruns 0 carrier 0 collisions 0 vethb9e6800: flags=4163<UP,BROADCAST,RUNNING,MULTICAST> mtu 1500 inet6 fe80::d823:7cff:fe26:bc50 prefixlen 64 scopeid 0x20<link> ether da:23:7c:26:bc:50 txqueuelen 0 (Ethernet) RX packets 272845 bytes 24683640 (23.5 MiB) RX errors 0 dropped 0 overruns 0 frame 0 TX packets 245238 bytes 521066078 (496.9 MiB) TX errors 0 dropped 0 overruns 0 carrier 0 collisions 0 vethc205716: flags=4163<UP,BROADCAST,RUNNING,MULTICAST> mtu 1500 inet6 fe80::a85b:3ff:feea:fac8 prefixlen 64 scopeid 0x20<link> ether aa:5b:03:ea:fa:c8 txqueuelen 0 (Ethernet) RX packets 92098 bytes 8838175 (8.4 MiB) RX errors 0 dropped 0 overruns 0 frame 0 TX packets 73810 bytes 7836864 (7.4 MiB) TX errors 0 dropped 0 overruns 0 carrier 0 collisions 0 vethd7569b0: flags=4163<UP,BROADCAST,RUNNING,MULTICAST> mtu 1500 inet6 fe80::c1b:94ff:fe00:382d prefixlen 64 scopeid 0x20<link> ether 0e:1b:94:00:38:2d txqueuelen 0 (Ethernet) RX packets 4231337 bytes 4417078024 (4.1 GiB) RX errors 0 dropped 0 overruns 0 frame 0 TX packets 1232190 bytes 160587844 (153.1 MiB) TX errors 0 dropped 0 overruns 0 carrier 0 collisions 0 vethdbb5ea1: flags=4163<UP,BROADCAST,RUNNING,MULTICAST> mtu 1500 inet6 fe80::60a9:2ff:fec8:b817 prefixlen 64 scopeid 0x20<link> ether 62:a9:02:c8:b8:17 txqueuelen 0 (Ethernet) RX packets 25 bytes 1846 (1.8 KiB) RX errors 0 dropped 0 overruns 0 frame 0 TX packets 5109 bytes 912146 (890.7 KiB) TX errors 0 dropped 0 overruns 0 carrier 0 collisions 0 virbr0: flags=4099<UP,BROADCAST,MULTICAST> mtu 1500 inet 192.168.122.1 netmask 255.255.255.0 broadcast 192.168.122.255 ether 52:54:00:4f:9e:e4 txqueuelen 1000 (Ethernet) RX packets 0 bytes 0 (0.0 B) RX errors 0 dropped 0 overruns 0 frame 0 TX packets 0 bytes 0 (0.0 B) TX errors 0 dropped 0 overruns 0 carrier 0 collisions 0 wg0: flags=209<UP,POINTOPOINT,RUNNING,NOARP> mtu 1420 inet 10.253.0.1 netmask 255.255.255.255 destination 10.253.0.1 inet6 fc00:253::1 prefixlen 128 scopeid 0x0<global> unspec 00-00-00-00-00-00-00-00-00-00-00-00-00-00-00-00 txqueuelen 1000 (UNSPEC) RX packets 3704 bytes 429384 (419.3 KiB) RX errors 0 dropped 0 overruns 0 frame 0 TX packets 11373 bytes 13111268 (12.5 MiB) TX errors 9 dropped 0 overruns 0 carrier 0 collisions 0 unraid-diagnostics-20230709-1748.zip
-
由于新插的一张网卡,然后在flash里设置了开机不加载新插入的网卡的驱动,但设置完后发现默认的路由掉了,导致无法访问unraid无法访问外网,现在只能通过停止阵列运行添加命令()才能恢复默认路由。希望社区哪位大佬能解决一下怎么修复默认路由的问题,现在一旦重启就默认路由就会丢失。 此为设置开机不加载新插网卡驱动 默认路由丢失
-
其实我删除掉那个插件目录,然后重启一下也是解决掉了那个问题。
-
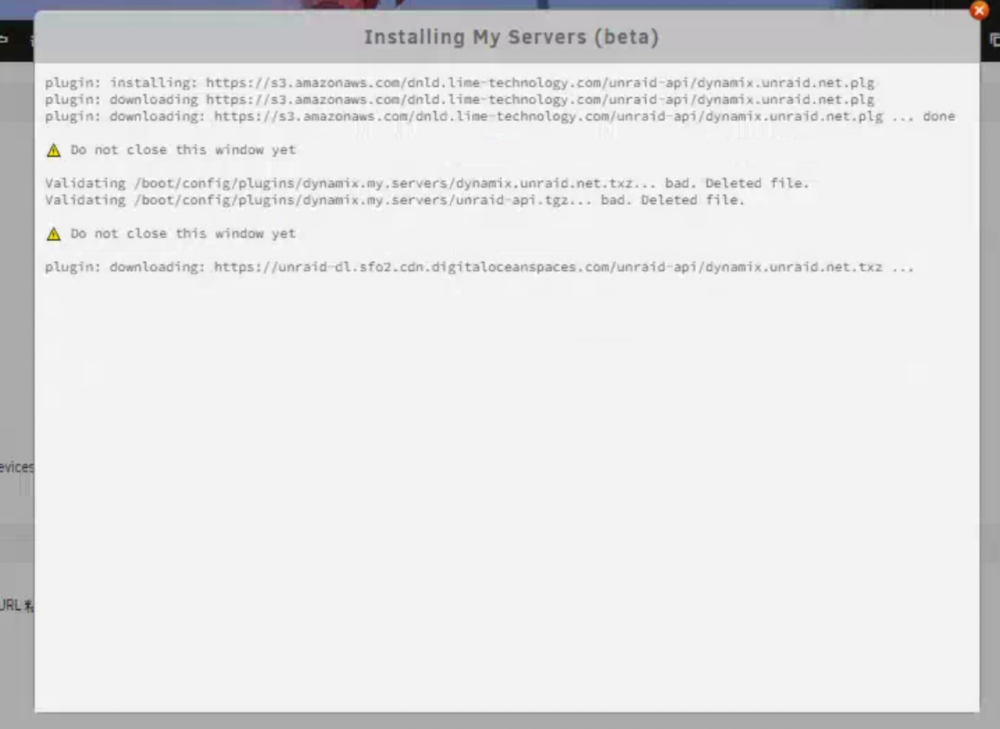
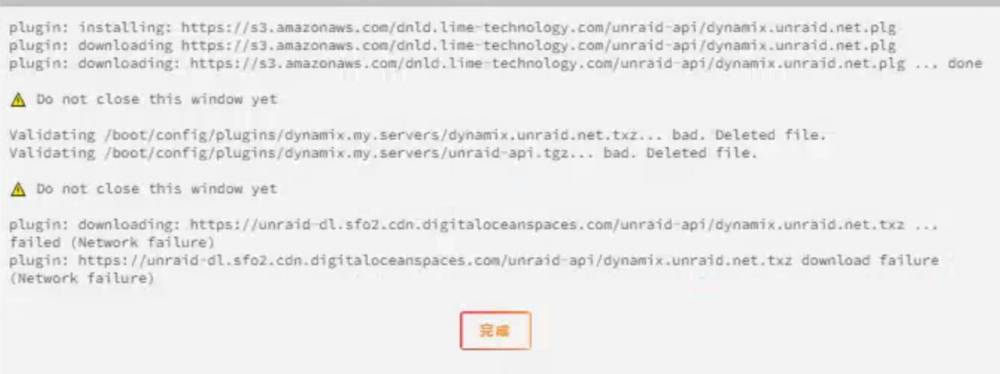
标题可能描述有点误差,其实是下载官网推荐的插件,然后因为网络原因导致下载失败,然后在web里显示出错误,导致没法显示在web右上角本该显示出的信息以及在工具栏里没法显示注册的按钮。 下面两张图为出现错误前后的下载插件的web下载显示,


-





