





KillerK
Members
-
Joined
-
Last visited
-
Confirmed bug... https://github.com/unraid/api/issues/1914
-
Hi @JorgeB sorry to be a pain but I think this post would be better in the 112-unraid-api-support section rather than this one, are you able to move it please?
-
My first time playing with the API and Connect. Connecting to unraid.net seems to work but the gui states errors but I cannot find the associated logs to know the detail. Also had issues connecting an OIDC Provider which I've not yet resolved but it was a cert validation issue. I noticed the timestamps in the graphql-api.log were adrift from the system time, before I lose more time tshooting my OIDC stuff I'm bothered about the time drift. NTP is configured and working, hardware and software clocks are in sync. syslog timestamps all as expected. root@blackrack:/# echo "System Time: $(date)"; echo "Hardware Time: $(hwclock --show)" System Time: Fri Mar 13 20:58:10 GMT 2026 Hardware Time: 2026-03-13 20:58:10.218973+00:00 root@blackrack:/# logger "Test timestamp" root@blackrack:/# tail -n1 /var/log/syslog Mar 13 20:58:14 blackrack root: Test timestamp Yet for the API... root@blackrack:/# unraid-api stop [PM2] [unraid-api](0) ✓ root@blackrack:/# rm /var/log/graphql-api.log root@blackrack:/# echo "System Time: $(date)"; echo "Hardware Time: $(hwclock --show)" System Time: Fri Mar 13 20:59:01 GMT 2026 Hardware Time: 2026-03-13 20:59:01.975691+00:00 root@blackrack:/# unraid-api start Starting the Unraid API [PM2][WARN] Applications unraid-api not running, starting... [PM2][WARN] App unraid-api has option 'wait_ready' set, waiting for app to be ready... [PM2] App [unraid-api] launched (1 instances) +--- unraid-api namespace : default version : 4.29.2+c39b0b26 pid : 608133 pm2 id : 0 status : online mode : fork restarted : 0 uptime : 1s memory usage : 224.9mb error log : /var/log/graphql-api.log watching : no PID file : /var/log/.pm2/pids/unraid-api-0.pid root@blackrack:/# tail -n5 /var/log/graphql-api.log [20:03:07 INFO NestApplication]: Nest application successfully started {"apiVersion":"4.29.2+c39b0b26","logger":"api","context":"NestApplication"} [20:03:07 INFO api]: Server listening on /var/run/unraid-api.sock {"apiVersion":"4.29.2+c39b0b26","logger":"api"} [20:03:07 INFO api]: Nest Server is now listening {"apiVersion":"4.29.2+c39b0b26","logger":"api"} [20:03:07 INFO app]: Startup complete in 582ms {"apiVersion":"4.29.2+c39b0b26"} [20:03:08 INFO MothershipGraphqlClientService]: Connected to wss://mothership.unraid.net/ws {"apiVersion":"4.29.2+c39b0b26","logger":"api","context":"MothershipGraphqlClientService"} Any help appreicated.
-
Thank you, worked a charm!
-
I want to proactively replace the disks in my special vdev mirror as the current ones are old. The new disks are larger in size and I have the space to add these into the chassis without removing the old drives. Checking is this guide (https://forums.unraid.net/topic/46802-faq-for-unraid-v6/#comment-480419) sill valid and does it apply for special vdevs? Thanks
-
I only started looking at flash usage because of system performance or more specifically the unraid UI being laggy. It's an assumption but I believe this was triggered as I had overridden unraids default zfs max arc limit to more fully utilise the available ram. Then once the system was being loaded that's when I noted the increasing read counts. The way the fastusr note in the changelog reads about flash usage its not a simple if x do y and infers their is an amount read which is acceptable but doesn't clarify this. Hence my question.
-
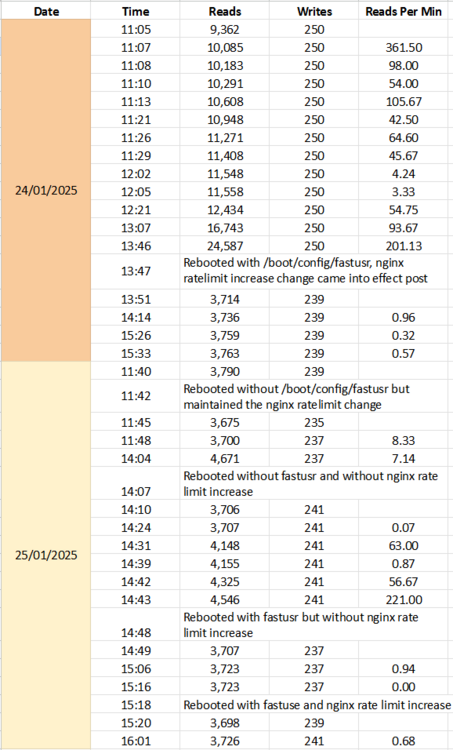
Concluding this thread now and answering a couple of my own questions hoping others might find it useful. What is classed as excessive? In my testing anything over 1 read per minute of the flash drive would be excessive. Where my results above a concern? Yes, as they exceeded the above and at worst were over 200 reads per minute. The resolution was to apply the /boot/config/fastusr config which @Kilrah kindly confirmed. I did retest my scenarios today by again removing the nginx rate limit alteration and re-ran with and without the fastusr fix. I my usecase I pushed the ZFS Arc to the max, kept the server busy with various activities and managed to replicate the issue by then browsing the unraid UI which by then slow which then started to notch up the read counter on the flash drive.
-
So addional question if I may. I realised there is something else I am/was messing with in addition to the ZFS Max Arc limit. I'd temporarily removed a boot time modification I'd previously made to nginx's rate limiting so this was back to stock during the time period I was seeing the high flash usage. I forgot about this when I added the /boot/config/fastusr file and rebooted about 30 mins ago but I'm now seeing a much improved as in reduced read amount on the flash storage. I know I've muddied the water with the 2 changes at the same time but could the rate limit change be involved here, the below is in my /boot/config/go file... /usr/bin/sed -i "s;zone=authlimit:1m rate=30r/m;zone=authlimit:1m rate=60r/s;g" /etc/nginx/nginx.conf
-
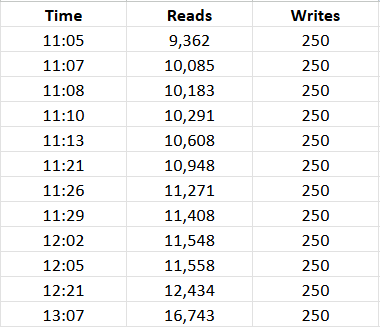
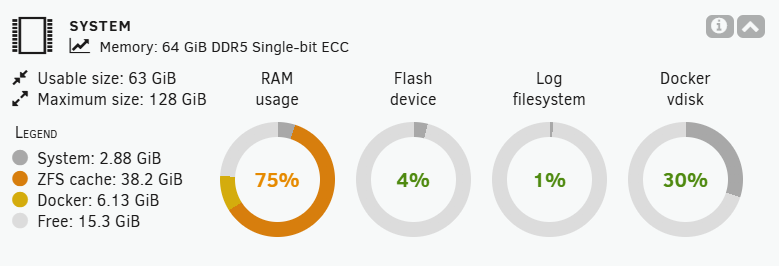
I noted this item in the 7.0.0 changelog, have never thought about it nor looked at it previously. Fortunately/unfortunately I'm now curious so I guess my first question is...What is classed as "excessive"? I decided to manually capture the below to create a baseline of sorts and I also did a little forum surfing. So my second question... Are the results that I've captured today concerning? For the 1 hour up to 13:07 I ran the below... # inotifywatch -r -t 3600 /boot Establishing watches... Finished establishing watches, now collecting statistics. total access close_nowrite open filename 84684 28230 28227 28227 /boot/config/shares/ 60702 22978 18870 18854 /boot/config/ 43866 35444 4211 4211 /boot/ 37377 12459 12459 12459 /boot/config/plugins/dynamix/ 4796 2398 1199 1199 /boot/config/plugins/dynamix/notifications/agents/ 4796 2398 1199 1199 /boot/config/plugins/dynamix/notifications/ 2464 1120 672 672 /boot/config/plugins/dockerMan/templates/limetech/ 2464 1568 448 448 /boot/config/plugins/dockerMan/ 2240 1344 448 448 /boot/config/plugins/dockerMan/templates/ 1659 553 553 553 /boot/config/plugins/ipmi/ 1344 896 224 224 /boot/config/plugins/dockerMan/templates-user/ 342 114 114 114 /boot/config/plugins/gpustat/ 100 88 6 6 /boot/config/plugins/ 27 9 9 9 /boot/config/plugins/community.applications/ 18 6 6 6 /boot/config/plugins/zfs.master/ 15 5 5 5 /boot/config/plugins/compose.manager/ 4 2 1 1 /boot/config/wireguard/ As of typing my dashboard reports the below, this is largely typical from my observations... The only change I've implemented recently other than the upgrade to 7 is to increase my ZFS Arc Max limit and to add a L2 Arc to one of my pools. I've not implemented the fix mentioned in the change log, from my read it sound like a worthwhile activity as 500MB RAM is nothing really, I'm just interested to get a proper view on the above. Thanks, K
-
Odd, I made sure last night the docker-compose.override.yml files were updated and rebooted the server earlier today after making some zfs changes. However now after doing a down and up the containers are correctly reporting. Apprecaite the help.
-
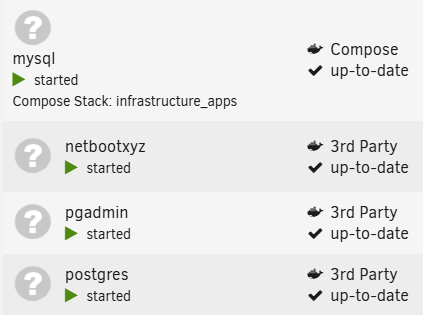
So one of my stacks is called 'other_apps' because I'm a creative type 🤔 It has 5 containers described, 3 of which correctly report as part of the stack on the 'Docker' UI page but 2 don't. Interestingly or not the 2 that don't are the last 2 additions (and the last 2 in the below insert) but were added a while back and not together at the same time. # cat /boot/config/plugins/compose.manager/projects/other_apps/docker-compose.override.yml services: myadmin: labels: net.unraid.docker.managed: 'composeman' net.unraid.docker.icon: '' net.unraid.docker.webui: '' net.unraid.docker.shell: '' esphome: labels: net.unraid.docker.managed: 'composeman' net.unraid.docker.icon: '' net.unraid.docker.webui: '' net.unraid.docker.shell: '' bab_wordpress: labels: net.unraid.docker.managed: 'composeman' net.unraid.docker.icon: '' net.unraid.docker.webui: '' net.unraid.docker.shell: '' pgadmin: labels: net.unraid.docker.managed: 'composeman' net.unraid.docker.icon: '' net.unraid.docker.webui: '' net.unraid.docker.shell: '' netbootxyz: labels: net.unraid.docker.managed: 'composeman' net.unraid.docker.icon: '' net.unraid.docker.webui: '' net.unraid.docker.shell: '' There is a clear difference you can see via docker inspect also... # docker inspect mysql | grep net.unraid "net.unraid.docker.icon": "", "net.unraid.docker.managed": "composeman", "net.unraid.docker.shell": "", "net.unraid.docker.webui": "" # docker inspect pgadmin | grep net.unraid # docker inspect netbootxyz | grep net.unraid Now I am guilty of bypassing the UI and using SSH to administer my containers including updating the compose files and starting/downing stacks. However even after manually renewing the config via the UI this isn't being corrected unless there is some linkage to a reboot I've not yet tried?
-
Hi, have noticed a couple of things since upgrading to unraid 7. The 'Docker' tab in the UI doesn't show correctly that containers are part of a compose stack. Some do and some dont but all my containers belong to 1 of 6 stacks. I've re-saved the compose file via the UI to regenerate the docker-compose.override.yml files in the projects directory but the below is still happening, obviously no actual functionality issues and all cosmetic. I've started to receive this message when starting a stack, is this the compose pluging or docker where I need to research? matter Migrated sysctl "net.ipv6.conf.eth0.accept_ra_rt_info_max_plen" to DriverOpts{"com.docker.network.endpoint.sysctls":"net.ipv6.conf.IFNAME.accept_ra_rt_info_max_plen=64"} Any pointers appreicated. Thanks K
-
Sorry if this is dumb but I *think* I've backed up my IPMI configuration previous as I have file in my backup folder called IPMI_CONFIG_BACKUP.bin. But for the life of me I can't remember how I obtained it neither can I now re-find anything in the unraid UI or docs which detail it. Any help apprecaited?
-
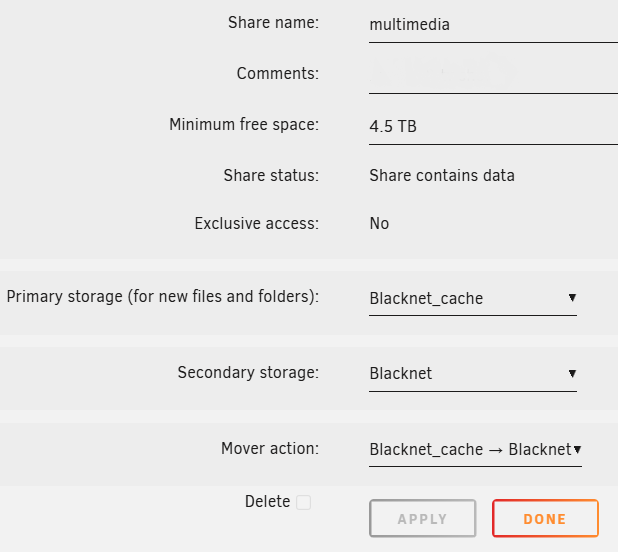
So I have a zpool called 'blacknet' which is the original primary storage for a share called 'multimedia'. I've just created a new zpool called 'blacknet_cache' and have amended the 'multimedia' share as per the below... So I then do the following... # cd /mnt/user/multimedia/ # mkdir share_test # cd share_test/ # touch tester.test # ls -l total 1 -rw-rw-rw- 1 root root 0 Jan 20 13:26 tester.test # ls -l /mnt/blacknet_cache/ total 0 # ls -l /mnt/blacknet/multimedia/ total 1 drwxrwxrwx 2 root root 3 Jan 20 13:26 share_test/ # ls -l /mnt/blacknet/multimedia/share_test/ total 1 -rw-rw-rw- 1 root root 0 Jan 20 13:26 tester.test This shows that new folders and files are still being directly written to the blacknet zpool which is configured as the secondary storage for the share. The mover process is currently set to run every 2 hours and hasn't run here yet so thats not the problem. The only other nuance I have which could be involved here is that previously I created a zfs dataset called multimedia on the blacknet pool with a mountpoint of /mnt/blacknet/multimedia. Could this be causeing this behaviour? EDIT: Creating a new share and works as expected with data first written to blacknet_cache and the mover then moves it to blacknet when triggered. So my problem only relates to a pre-existing share.
-
All my shares just used primary storage and had exclusive access = yes, however the recent upgrade to 7.0.0 allowed me to free up some old sata ssd's which I was using as the Array device and were doing nothing. I want to test a shares performance by adding these newly available drives as the primary storage aka cache for a pre-existing share. I can amend the share configuration with no issue selecting the new pool as primary and the old/original pool as secondary. This saves, the /mnt/user directory no longer symlinks to the pool device so exclusive access for the share now = no, so far so good. I suspect my test case is wrong, should I be writing new files/folders to the share name under /mnt/user and should I expect them to appear in /mnt/new-primary-cache-pool until the mover process runs which then moves them to the old/original pool device under /mnt?


