UsefulTowel
Members
-
Joined
-
Last visited
-
can someone help me in resetting the root password. I've tried all the recommended solutions: Adding --skip-grant-tables to Post Arguments results in an error. Adding mysql_safe --skip-grant-tables or mariadbd-safe --skip-grant-tables makes the container not start. I've modified the custom.cnf file to add skip-grant-tables to the mysqld block, this lets the container start but still can't access mysql to reset the password. Any more suggestions? Do I just have to nuke the install and start over? If so how can I backup my databases?
-
Noticed multiple errors in logs after recent 7.1.0 update. No issues other than some sluggishness in the GUI and maybe random full CPU usage, way more than before. Any idea what's going on here? May 11 22:10:59 Yoda kernel: xhci_hcd 0000:00:14.0: Timeout while waiting for setup device command May 11 22:11:00 Yoda kernel: usb 2-2: device not accepting address 6, error -62 May 11 22:11:00 Yoda kernel: usb usb2-port2: unable to enumerate USB device May 11 22:11:06 Yoda kernel: xhci_hcd 0000:00:14.0: Timeout while waiting for setup device command May 11 22:11:11 Yoda kernel: xhci_hcd 0000:00:14.0: Timeout while waiting for setup device command May 11 22:11:11 Yoda kernel: usb 2-2: device not accepting address 7, error -62 May 11 22:11:17 Yoda kernel: xhci_hcd 0000:00:14.0: Timeout while waiting for setup device command May 11 22:11:22 Yoda kernel: xhci_hcd 0000:00:14.0: Timeout while waiting for setup device command May 11 22:11:23 Yoda kernel: usb 2-2: device not accepting address 8, error -62 May 11 22:11:23 Yoda kernel: usb usb2-port2: attempt power cycle May 11 22:11:29 Yoda kernel: xhci_hcd 0000:00:14.0: Timeout while waiting for setup device command May 11 22:11:34 Yoda kernel: xhci_hcd 0000:00:14.0: Timeout while waiting for setup device command May 11 22:11:34 Yoda kernel: usb 2-2: device not accepting address 9, error -62
-
just to clarify the fan stats for intel arc cards is not working atm right? Unless you’re running the Unraid beta?
-
this worked to get the handbrake icon displaying under active apps in the widget, thanks no fan output with the other command but I'm not running the beta. I'm on 7.0.1 sensors i915-pci-* i915-pci-0300 Adapter: PCI adapter in0: 0.00 V power1: N/A (max = 43.00 W) energy1: 206.19 kJ
-
I did. The file exists and shows data when transcoding with Plex but nothing when transcoding with handbrake.
-
ok did all that. cat /tmp/gpuappsint does not return any data when transcoding with handbrake cat /tmp/gpudata* {"period":{"duration":1033.364198,"unit":"ms"},"frequency":{"requested":0,"actual":0,"unit":"MHz"},"interrupts":{"count":0,"unit":"irq\/s"},"rc6":{"value":100,"unit":"%"},"power":{"GPU":0,"Package":36.8953,"unit":"W"},"engines":{"Render\/3D":{"busy":0,"sema":0,"wait":0,"unit":"%"},"Blitter":{"busy":0,"sema":0,"wait":0,"unit":"%"},"Video":{"busy":0,"sema":0,"wait":0,"unit":"%"},"VideoEnhance":{"busy":0,"sema":0,"wait":0,"unit":"%"}},"clients":[]}{"period":{"duration":1031.889601,"unit":"ms"},"frequency":{"requested":2457.627248,"actual":1369.332532,"unit":"MHz"},"interrupts":{"count":1829.653093,"unit":"irq\/s"},"rc6":{"value":0,"unit":"%"},"engines":{"Render\/3D":{"busy":0,"sema":0,"wait":0,"unit":"%"},"Blitter":{"busy":0,"sema":0,"wait":0,"unit":"%"},"Video":{"busy":49.077978,"sema":0,"wait":0,"unit":"%"},"VideoEnhance":{"busy":18.486236,"sema":0,"wait":0,"unit":"%"},"Compute":{"busy":0,"sema":0,"wait":0,"unit":"%"}},"clients":{"4294093786":{"name":"ghb","pid":"873510","engine-classes":{"Render\/3D":{"busy":"0.000000","unit":"%"},"Blitter":{"busy":"0.000000","unit":"%"},"Video":{"busy":"99.620272","unit":"%"},"VideoEnhance":{"busy":"37.607616","unit":"%"},"Compute":{"busy":"0.000000","unit":"%"}}}}}
-
sorry I misunderstood. after running the command do I just refresh the page or is there a timeframe I should wait? not sure if the dashboard has it's own independent refresh cycle
-
ran the first command and rebooted. this is while handbrake is transcending cat /tmp/gpudata* {"period":{"duration":1026.682297,"unit":"ms"},"frequency":{"requested":0,"actual":0,"unit":"MHz"},"interrupts":{"count":0,"unit":"irq\/s"},"rc6":{"value":99.999827,"unit":"%"},"power":{"GPU":0,"Package":35.629225,"unit":"W"},"engines":{"Render\/3D":{"busy":0,"sema":0,"wait":0,"unit":"%"},"Blitter":{"busy":0,"sema":0,"wait":0,"unit":"%"},"Video":{"busy":0,"sema":0,"wait":0,"unit":"%"},"VideoEnhance":{"busy":0,"sema":0,"wait":0,"unit":"%"}},"clients":[]}{"period":{"duration":1035.718774,"unit":"ms"},"frequency":{"requested":2448.541113,"actual":1369.097515,"unit":"MHz"},"interrupts":{"count":1816.130061,"unit":"irq\/s"},"rc6":{"value":0,"unit":"%"},"engines":{"Render\/3D":{"busy":0,"sema":0,"wait":0,"unit":"%"},"Blitter":{"busy":0,"sema":0,"wait":0,"unit":"%"},"Video":{"busy":49.107224,"sema":0,"wait":0,"unit":"%"},"VideoEnhance":{"busy":18.411326,"sema":0,"wait":0,"unit":"%"},"Compute":{"busy":0,"sema":0,"wait":0,"unit":"%"}},"clients":{"4294840973":{"name":"ghb","pid":"126323","engine-classes":{"Render\/3D":{"busy":"0.000000","unit":"%"},"Blitter":{"busy":"0.000000","unit":"%"},"Video":{"busy":"99.799229","unit":"%"},"VideoEnhance":{"busy":"37.365854","unit":"%"},"Compute":{"busy":"0.000000","unit":"%"}}}}} the command cat /tmp/gpuappsint does not return any data when only handbrake is transcoding. it will return when plex is though.
-
Placed this file as instructed (overwrote current file) and refreshed page. Plex transcode is now displaying some stats, power draw still appears bugged. Stats also now display for handbrake transcodes but no icon is displayed in the active apps section.
-
this was with a plex transcode running cat /tmp/gpudata* {"period":{"duration":1026.272759,"unit":"ms"},"frequency":{"requested":0,"actual":0,"unit":"MHz"},"interrupts":{"count":0,"unit":"irq\/s"},"rc6":{"value":0,"unit":"%"},"power":{"GPU":0,"Package":10.779239,"unit":"W"},"engines":{"Render\/3D":{"busy":0,"sema":0,"wait":0,"unit":"%"},"Blitter":{"busy":0,"sema":0,"wait":0,"unit":"%"},"Video":{"busy":0,"sema":0,"wait":0,"unit":"%"},"VideoEnhance":{"busy":0,"sema":0,"wait":0,"unit":"%"}},"clients":[]}{"period":{"duration":1025.721333,"unit":"ms"},"frequency":{"requested":1644.696221,"actual":419.217175,"unit":"MHz"},"interrupts":{"count":175.486259,"unit":"irq\/s"},"rc6":{"value":0,"unit":"%"},"engines":{"Render\/3D":{"busy":0,"sema":0,"wait":0,"unit":"%"},"Blitter":{"busy":0,"sema":0,"wait":0,"unit":"%"},"Video":{"busy":0,"sema":0,"wait":0,"unit":"%"},"VideoEnhance":{"busy":0,"sema":0,"wait":0,"unit":"%"},"Compute":{"busy":0,"sema":0,"wait":0,"unit":"%"}},"clients":{"4294715287":{"name":"Plex Transcoder","pid":"252009","engine-classes":{"Render\/3D":{"busy":"0.000000","unit":"%"},"Blitter":{"busy":"0.000000","unit":"%"},"Video":{"busy":"6.521858","unit":"%"},"VideoEnhance":{"busy":"2.221890","unit":"%"},"Compute":{"busy":"0.000000","unit":"%"}}}}}
-
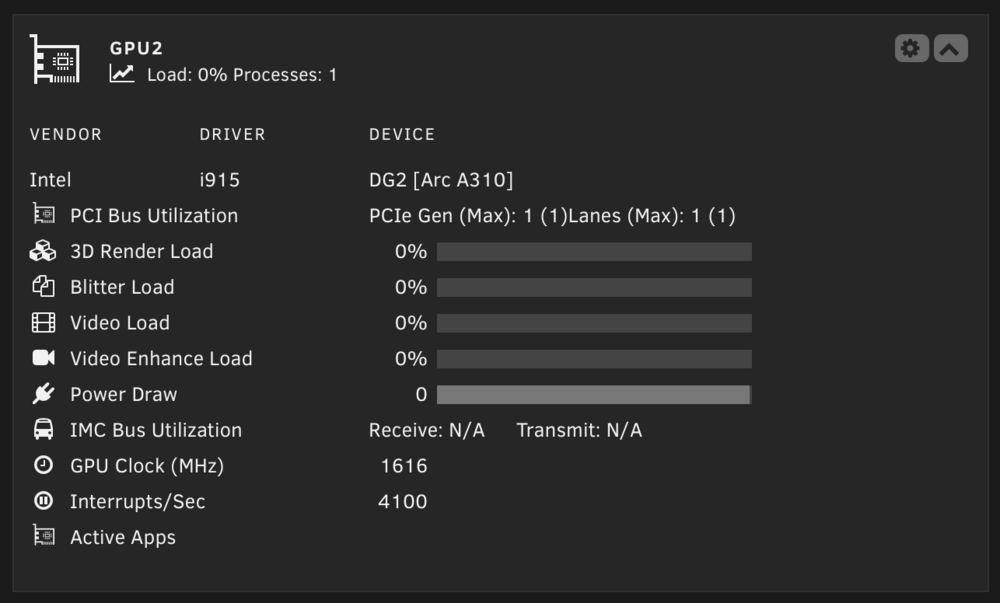
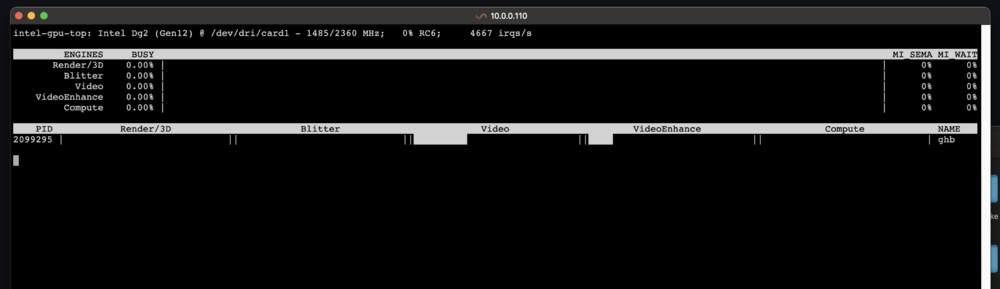
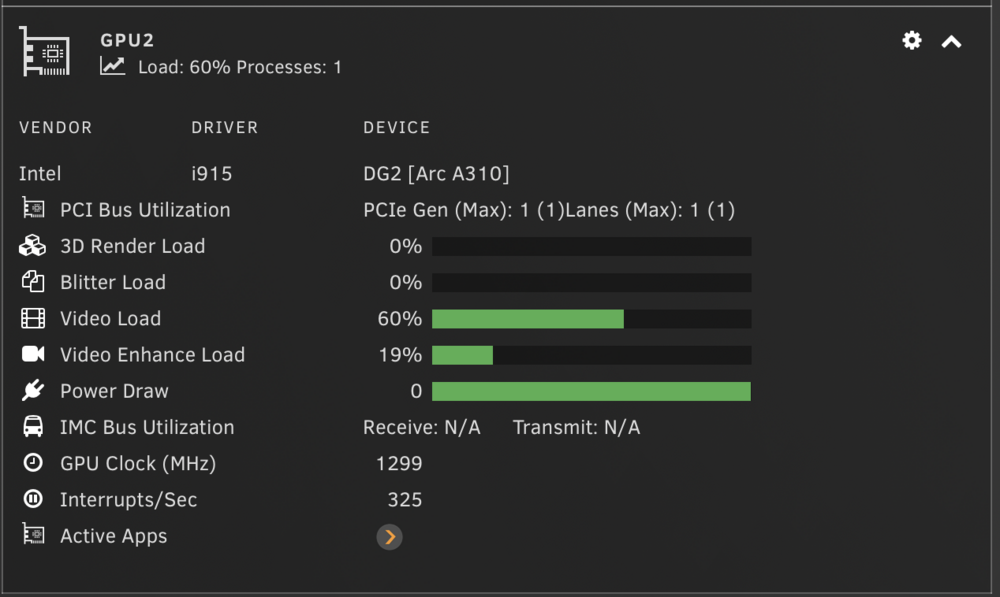
I'm having the same issue but with my Arc A310 gpu. It will sometimes show the Plex icon when transcoding but not the handbrake and none of the stats ever update. The Power Draw bar will fill but no number displayed for it or any other metric. intel_gpu_top will show some load for "video" and "video enhance" but only on the bottom, barely (if any) load on the top section. Attached images are while running a transcode in handbrake