DavidIrwin
Members
-
Joined
-
Last visited
-
I've just tried to let a patch install for the first time... and looks like the mover part of the patch failed: Installing /boot/config/plugins/unraid.patch/7.0.0/20250128204439-pr271.patch... patching file emhttp/plugins/dynamix.vm.manager/templates/Custom.form.php patching file emhttp/plugins/dynamix/include/FileTree.php patching file emhttp/plugins/dynamix/include/ShareList.php patching file emhttp/plugins/dynamix/scripts/diagnostics patching file sbin/mover Hunk #1 FAILED at 72. 1 out of 1 hunk FAILED -- saving rejects to file sbin/mover.rej Failed to install patch 20250128204439-pr271.patch Aborting What should i do to resolve this? I do have CA Mover Tuning plugin installed. Is that no longer compatible?
-
Hi, Not an unRAID expert, but recently I have noticed that my server seems to be serving data a little slower than normal (actually noticed poor Plex server performance mostly), and I think this stems from something a little odd happening with a process always consuming CPU time which I do not expect. This is taken from the processes list in Settings: root 3964 63.7 0.7 1153420 121572 ? Ssl Sep20 1638:55 /usr/local/sbin/shfs /mnt/user -disks 15 -o noatime,allow_other -o remember=0 I have at this point stopped all of my dockers, and removed any plugins I do not need, and the server has been rebooted relatively recently (2 days ago). Is anyone able to point me in the right direction to get this sorted? My server always used to sit with CPU usage idling "normally" at 5-10% and is now nearer 25% with everything stopped. Diagnostics attached. davidserver-diagnostics-20210922-1440.zip
-
I would really apprecaite seeing some form of progress on the Mover to show how long it is likely to run or a count of files to be moved or something.
-
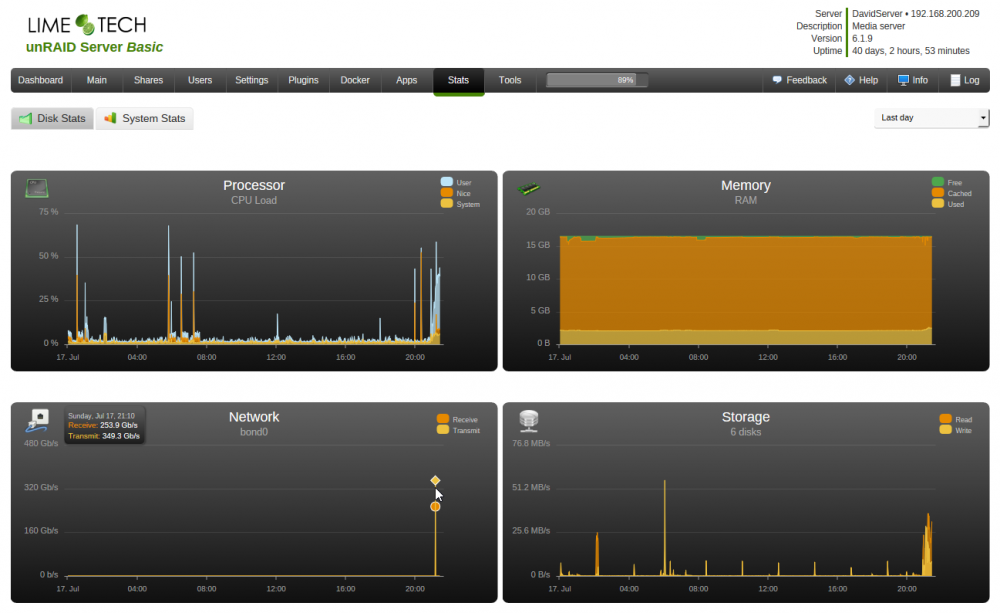
Hi, I'm a relatively new unRAID user, but to monitor my setup I decided to add the Dynamix System Statistics plugin (alongside some others) to ensure my server is running as it should be. Today I saw something a little odd on the Network graph (screenshot attached). As you can see the peaks show values above 200Gb/s. My network is two 1Gbit connections configured as bond for failover, and my internet connection is only 40Mb/10Mb so there is no way that level of network traffic should have been generated. The server is an HP MicroServer Gen8 with 4x SATA HDD (3d,1p), 1xSATA SSD Cache. If you need any more details please ask me but I'm curious how this stat anomaly has happened and would be happy to provide more details if this would help fix a possible problem. Thanks David