


Merijeek
Members
-
Joined
-
Last visited
Everything posted by Merijeek
-
OK, so to be clear, the misunderstanding here is that the delays are strictly there for containers that auto start when the disk array itself is started?
-
OK, I don't restart the array all THAT often. I was basing my complaint on my stopping all containers and then hitting the 'start all' button. Is that...incorrect?
-
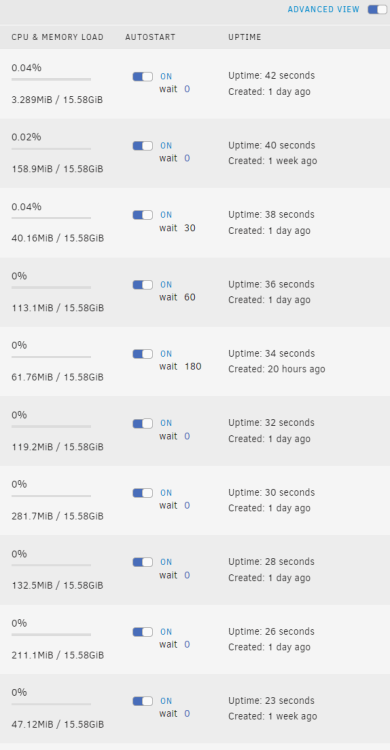
Version 6.12.4. Like many people, I need some containers to wait for others before starting up to avoid issues. So I put them in order, and I did some delays. My understanding is that they'd boot top-down, and delay when they hit a delay. But as you can see from my delays and uptimes, that definitely isn't happening. Can someone explain what I'm doing wrong here?
-
Awesome, that did it. Thanks a bunch.
-
@ich777 - One more question on the OpenVPN container. I'd like to be able to have one of my Docker containers that get network via the OVPN container to be able to access something on my local 192.168.1.0/24 subnet. It looks like that isn't possible. Can you suggest a setting that might allow that?
-
Yeah, that was just a shot from before I did it. They're there and I can reach the containers behind it.
-
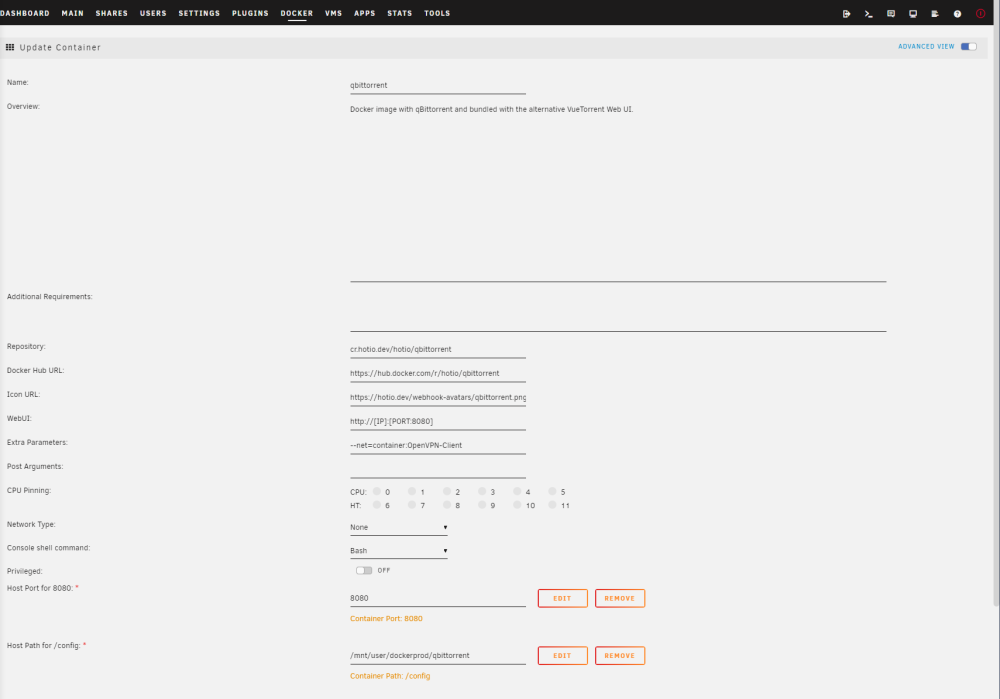
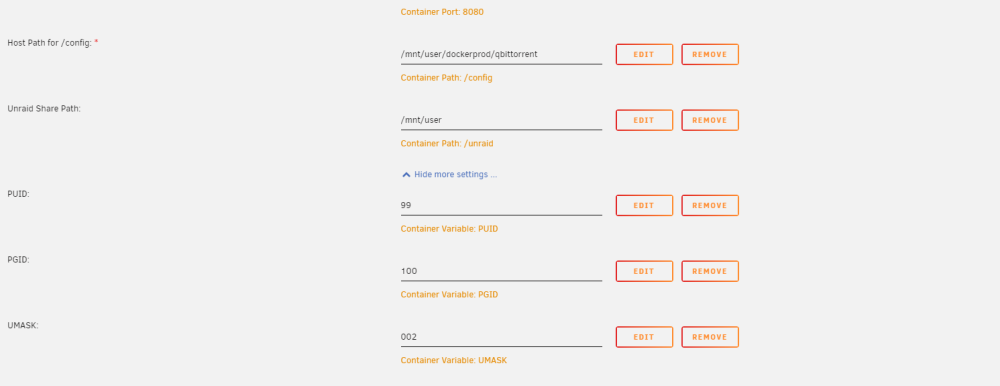
Here's some shots of my advanced QBT setup: As you can see, not much to it. However, I did add the FIREWALL variable to the OpenVPN container and so far I seem to be showing good: So...I'll throw a few more things in there and check back and see what I can see.
-
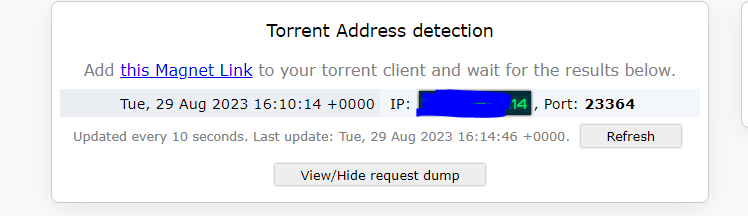
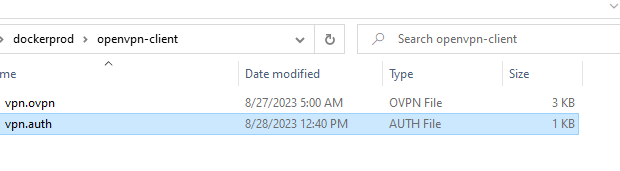
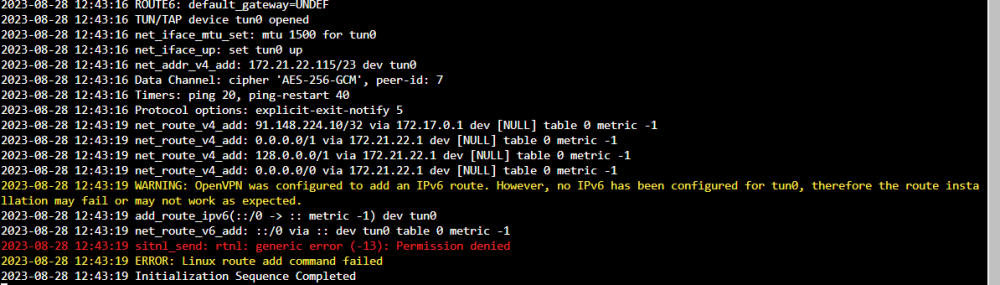
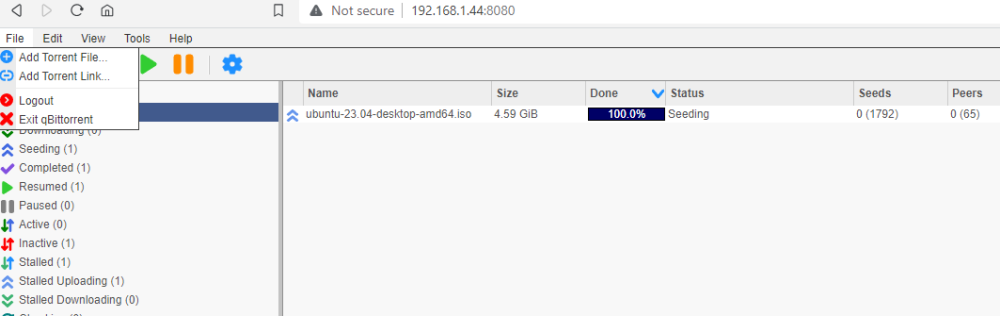
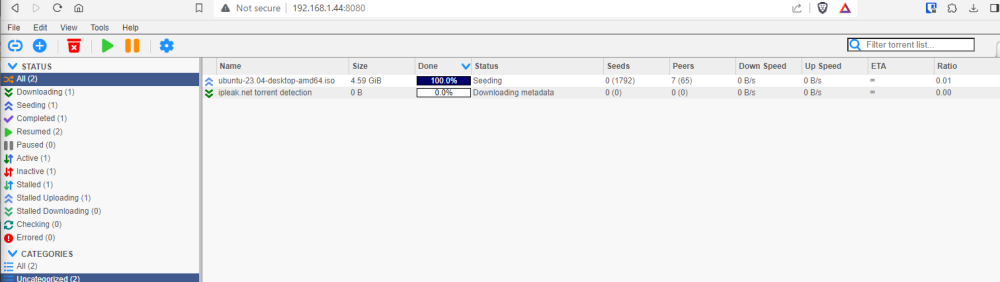
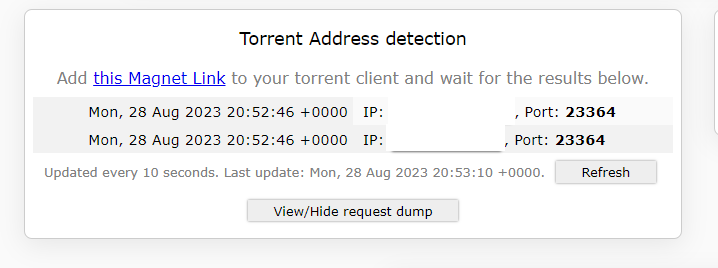
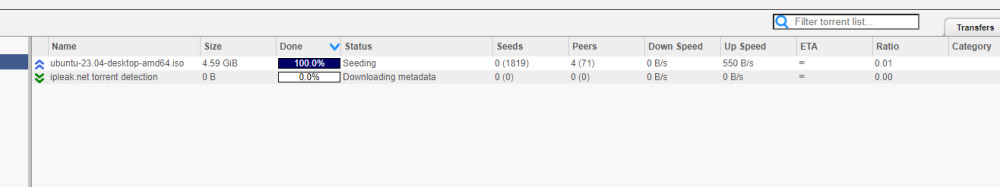
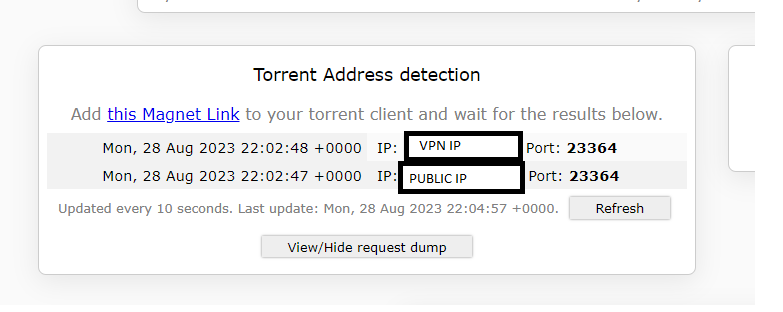
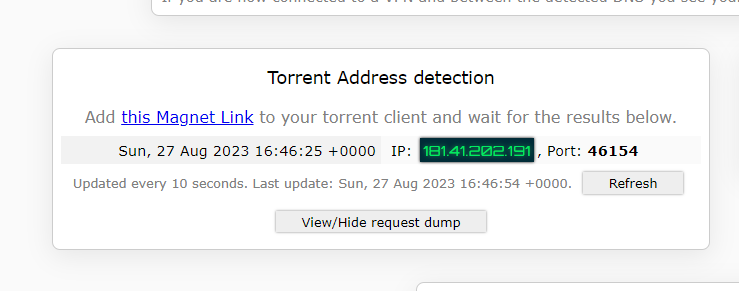
I don't know. I appear to have broken it via all the experimenting I was going. As far as me doing something differently, anything is possible, but I don't know how. So this is from scratch Completely basic setup: Created an OVPN file over at PIA, then put it and creds in the right spot: And it looks like it's up after a restart: My QBT and OVPN containers can both ping the outside world via DNS. I've got this happy and good and completely legal torrent that finished a few minutes ago: And I go and visit this site: https://ipleak.net/ and choose the "Torrent Address Detection" button, and then grab the magnet link and pop it into QBT: And when I go back to ipleak, I see: The top one being the VPN address, the bottom one being my own public IP. ....so then he goes ahead and does the same thing. Shuts down all dockers and changes the ovpn.vpn and auth.vpn files to the Privado versions. OVPN file is Privado's: ams-001.default (renamed, of course) Connected: Go back to IPLeak, grab a new magnet and put it into QBT: ...and poof, pretty much instantly Finally, lacking any better ideas, I change the DNS that the OVPN container is using. ....and boom, same as above. Meanwhile, on my extra Windows machine running the PIA client, I go through the same tests, and only my PIA VPN IP ever shows up in the ipleak site. I'm not saying I'm not possibly doing something wrong here, but I don't see how I can be.
-
As you can see above, I did. However, while doing all my screwing around, I can't even route through the OVPN container. Just not sure it's worth the effort. I've been trying to get everything off a windows box by shifting all this stuff to docker containers on the Unraid server. But it's turning out to be quite the headache. I'll start over one more time with the Privado setup through this container and see what we see.
-
Well, that's not great. Any thoughts? Or maybe just something not great with PIA? I grabbed a Privado accound, and am seeing the same thing: I swapped to a Netherlands server and I get the same thing more or less I'm even using the Privado VN DNS and getting that.
-
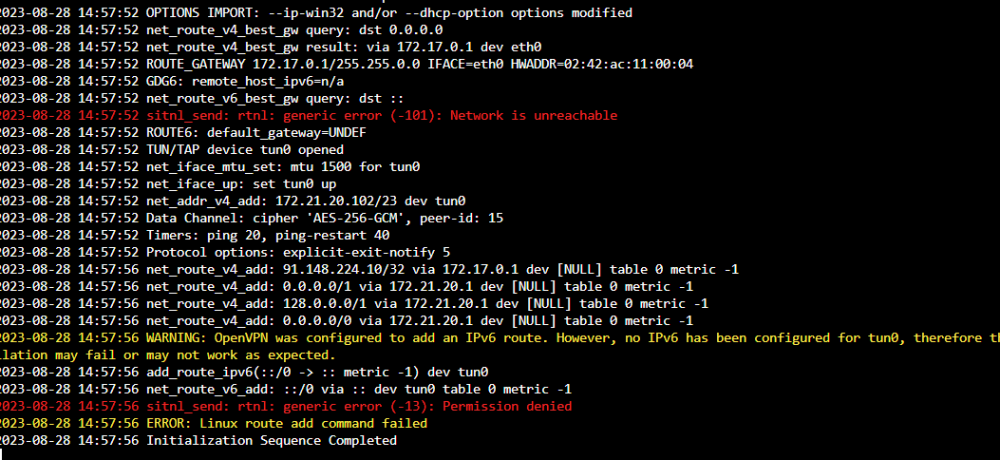
OK well, some progress! Note: The above was actually from the OpenVPN container itself. I had to add some packages to get it working from another container, but finally got there:
-
So then I tried this: With line 109 being the: " done <<< "$result_txt""
-
And tried it without the -
-
You'd think but nope, swing and a miss:
-
Well, this is where me being totally useless in Docker and mostly useless in Linux comes in. So...I'll just watch to hear from you when you're back.
-
Yeah, I haven't worked out a way to do things from inside a container. I'm getting this when I run your command: root@b43d57320d68:/# curl https://raw.githubusercontent.com/macvk/dnsleaktest/master/dnsleaktest.sh -o dnsleaktest.sh % Total % Received % Xferd Average Speed Time Time Time Current Dload Upload Total Spent Left Speed 100 3273 100 3273 0 0 38042 0 --:--:-- --:--:-- --:--:-- 38505 The output file isn't interesting from what I can tell:
-
I had the same settings as our guy above, so there was this: --sysctl net.ipv6.conf.all.disable_ipv6=1 Which I would ASSUME kills IPv6. But I know nothing about the internal workings of docker containers, so if there's something else I should be setting, let me know and I'll be happy to give it a try. As far as how it works to detect it, I.... 1. Go to the site https://ipleak.net/ from my Windows PC (which is running the PIA VPN client) 2. Click the Torrent Address detection: Activate button that creates a custom .magnet link for me to download 3. I go to the QB web IP and paste the magnet link into the UI Then their page shows something like this: But in my case, it was actually showing two things - the above VPN IP and my own Comcast IP.
-
For what it's worth, I'm experiencing exactly the same thing. Trying Binhex and routing it via this container now to see what I can see.
-
I try to be good, but man 336 is a lot of pages. I've resurrected a saved config (as I'd stopped using this particular docker for a while) and on install I'm getting this in a loop. 2021-04-08 15:38:31,292 DEBG 'start-script' stdout output: [warn] Unable to successfully download PIA json payload from URL 'https://10.5.112.1:19999/getSignature' using token '(token hidden)' I'm sure there's a simple solution here, but I can't seem to find it.
-
Well, hell, I didn't even know that was as thing. I have no idea how I had a specified version when I didn't even know that was something that could be done. Thanks for the help, that did it and I'm up and running now.
-
OK, well, in that case I did follow the force instructions. I'm showing: 1.3.15_18_ge050905b2-1-04. I run the force update and I see: ...ending with: ...and then just the same loop: 020-10-02 09:44:07,841 DEBG 'start-script' stdout output: [warn] PIA endpoint 'ca-montreal.privacy.network' is not in the list of endpoints that support port forwarding, DL/UL speeds maybe slow [info] Please consider switching to one of the endpoints shown below 2020-10-02 09:44:07,841 DEBG 'start-script' stdout output: [info] List of PIA endpoints that support port forwarding:- [info] ca-toronto.privateinternetaccess.com [info] ca-montreal.privateinternetaccess.com [info] ca-vancouver.privateinternetaccess.com 2020-10-02 09:44:07,841 DEBG 'start-script' stdout output: [info] de-berlin.privateinternetaccess.com [info] de-frankfurt.privateinternetaccess.com [info] france.privateinternetaccess.com [info] czech.privateinternetaccess.com [info] spain.privateinternetaccess.com [info] ro.privateinternetaccess.com [info] israel.privateinternetaccess.com 2020-10-02 09:44:07,870 DEBG 'start-script' stdout output: [info] Attempting to curl http://209.222.18.222:2000/?client_id=490c17333dbc8f1811cf0120ce36b8f421d35b0a84a9159ee97a5f84ae137acf... 2020-10-02 09:44:07,974 DEBG 'start-script' stdout output: [warn] Response code 000 from curl != 2xx [warn] Exit code 7 from curl != 0 [info] 12 retries left [info] Retrying in 10 secs... 2020-10-02 09:44:18,079 DEBG 'start-script' stdout output: [warn] Response code 000 from curl != 2xx [warn] Exit code 7 from curl != 0 [info] 11 retries left [info] Retrying in 10 secs... 2020-10-02 09:44:29,245 DEBG 'start-script' stdout output: [warn] Response code 000 from curl != 2xx [warn] Exit code 7 from curl != 0 [info] 10 retries left [info] Retrying in 10 secs... 2020-10-02 09:46:00,444 DEBG 'start-script' stdout output: [warn] Response code 000 from curl != 2xx [warn] Exit code 7 from curl != 0 [info] 9 retries left [info] Retrying in 10 secs... 2020-10-02 09:46:10,551 DEBG 'start-script' stdout output: [warn] Response code 000 from curl != 2xx [warn] Exit code 7 from curl != 0 [info] 8 retries left [info] Retrying in 10 secs... 2020-10-02 09:46:40,666 DEBG 'start-script' stdout output: [warn] Response code 000 from curl != 2xx [warn] Exit code 7 from curl != 0 [info] 7 retries left [info] Retrying in 10 secs... 2020-10-02 09:46:50,775 DEBG 'start-script' stdout output: [warn] Response code 000 from curl != 2xx [warn] Exit code 7 from curl != 0
-
Thanks. Looks like I'd already updated (at one point I did a remove/add) so I guess I'm on the newest. Now I'm getting this in a loop: 2020-10-01 10:07:20,844 DEBG 'start-script' stdout output: [info] Successfully retrieved external IP address 154.21.20.59 2020-10-01 10:07:20,929 DEBG 'start-script' stdout output: [info] Curl successful for https://www.privateinternetaccess.com/vpninfo/servers?version=82, response code 200 2020-10-01 10:07:21,047 DEBG 'start-script' stdout output: [warn] PIA endpoint 'us-seattle.privacy.network' is not in the list of endpoints that support port forwarding, DL/UL speeds maybe slow [info] Please consider switching to one of the endpoints shown below 2020-10-01 10:07:21,048 DEBG 'start-script' stdout output: [info] List of PIA endpoints that support port forwarding:- [info] ca-toronto.privateinternetaccess.com [info] ca-montreal.privateinternetaccess.com [info] ca-vancouver.privateinternetaccess.com [info] de-berlin.privateinternetaccess.com [info] de-frankfurt.privateinternetaccess.com [info] france.privateinternetaccess.com [info] czech.privateinternetaccess.com [info] spain.privateinternetaccess.com [info] ro.privateinternetaccess.com [info] israel.privateinternetaccess.com 2020-10-01 10:07:21,085 DEBG 'start-script' stdout output: [info] Attempting to curl http://209.222.18.222:2000/?client_id=ac9125af77316821ac9536c06a53908e9116eee011f230a55bf8f377c79b470c... 2020-10-01 10:07:24,294 DEBG 'start-script' stdout output: [warn] Response code 000 from curl != 2xx [warn] Exit code 7 from curl != 0 [info] 12 retries left [info] Retrying in 10 secs... 2020-10-01 10:07:41,509 DEBG 'start-script' stdout output: [warn] Response code 000 from curl != 2xx [warn] Exit code 7 from curl != 0 [info] 11 retries left [info] Retrying in 10 secs...
-
Apparently, I don't know how to force an update...can someone tell me the command for that?
-
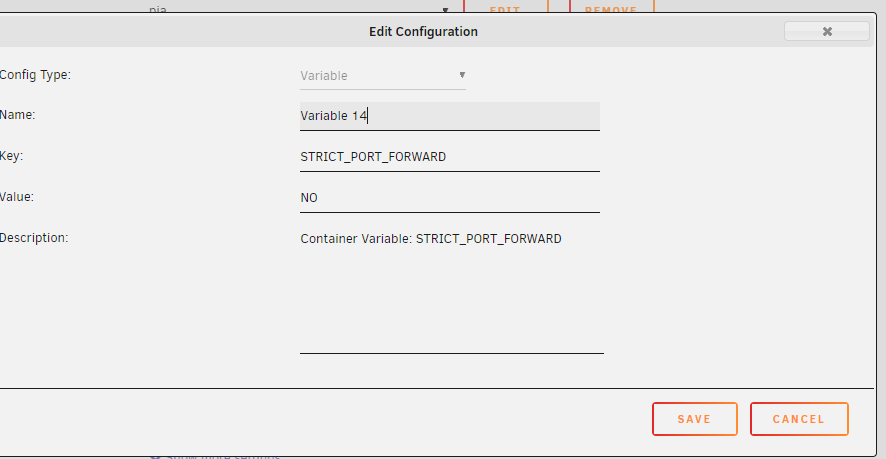
I don't seem to have that variable anywhere in my config, as near as I can tell. Assuming we're talking about on the container edit page. So I added this. Does it look correct? So far I'm not having any luck. If I'm supposed to be setting this somewhere else, please point me in the right direction. Currently, my loop looks like: 2020-09-12 12:14:09,954 DEBG 'start-script' stdout output: [info] Attempting to curl http://209.222.18.222:2000/?client_id=9306ff7cab8d20a1424b59bbd466d0e4e77436db1f17d448c7fe93e01a5035a5... 2020-09-12 12:14:10,884 DEBG 'start-script' stdout output: [warn] Response code 000 from curl != 2xx [warn] Exit code 52 from curl != 0 [info] 12 retries left [info] Retrying in 10 secs... 2020-09-12 12:14:26,263 DEBG 'start-script' stdout output: [warn] Response code 000 from curl != 2xx [warn] Exit code 52 from curl != 0 [info] 11 retries left [info] Retrying in 10 secs... 2020-09-12 12:14:36,666 DEBG 'start-script' stdout output: [warn] Response code 000 from curl != 2xx [warn] Exit code 52 from curl != 0 [info] 10 retries left 2020-09-12 12:14:36,666 DEBG 'start-script' stdout output: [info] Retrying in 10 secs... ...and after ~10-15 minutes it started working. Weird.
-
So...the impression that I'm getting is that, if using port forwarding, PIA is hosed indefinitely. But I'm not using any port forwarding, and I seem to be in a failed connection loop in my binhex-delugevpn log. Am I misreading things, or do I have a different problem from everyone else?


