


atribe
Community Developer
-
Joined
-
Last visited
Everything posted by atribe
-
That one worked too. Try untelegraf. It's the same image, it just uses environment variables. Sent from my Pixel XL using Tapatalk
-
I don't have any others. Just tried apache with no luck. Any suggested app's to try? Try watchtower, its a simple app that updates your other docker images to the latest versions. That worked. It's running. Try influxdb. It maps ports and volumes, so its the next step of testing. Sent from my Pixel XL using Tapatalk
-
I don't have any others. Just tried apache with no luck. Any suggested app's to try? Try watchtower, its a simple app that updates your other docker images to the latest versions.
-
Is the problem specific to this the telegraf container? Can you get something else to work?
-
I'd suggest removing the container and then removing the image. docker rm telegraf Then run docker images Then docker rmi <the image id, something like a352b......> You really only need the first 4 or so letters of the image id, then it will do a match and find it. Then refresh the unraid docker web interface and pull down a new community app.
-
@pokmiuhy Your log says that telegraf: Can you make sure that there are no other contains with that name? If you open up to the command prompt (putty or if you have a monitor on your unRAID box) you can type docker ps -a . This will show all containers. If there are any that are named telegraf you can type docker rm telegraf to remove it. If that doesn't work post the new logs.
-
It looks like the command to start the container has everything in there twice. Check in the advanced view that the ports, volumes, and environment variables are only defined once. If they are only there once, I'd day so a restart because that is really strange behavior. Sent from my Pixel XL using Tapatalk
-
Oh good. I had a similar issue when influxdb was on a different server than telegraf. The time was out of sync between them and it cause the data to show up at weird times. I had to set them both to use the same local ntp server so they were always in sync and that fixed it.
-
The only change I could see is the way I have disk=$tagname and value=$val. (Makes it so you only need one query in Grafana to get all the data.) in the last function. This is mine: function sendDB($val, $tagname) { $curl = "curl -i -XPOST 'http://tygra.tribe.home:8086/write?db=telegraf' --data-binary 'disktemp,host=unraid,region=us-west,disk=".$tagname." " ."value=".$val."'"; $execsr = exec($curl); } ?> However, I ran the code that it runs on my box and the temperature output is different for different hard drives. The script is actually only working for 3 of my drives. They all have smartctl -A /dev/sbx output that looks like: 194 Temperature_Celsius 0x0022 118 093 000 Old_age Always - 25 The drives that aren't displaying temp in Grafana are have output like this: 194 Temperature_Celsius 0x0002 250 250 000 Old_age Always - 24 (Min/Max 10/43) or 194 Temperature_Celsius 0x0022 026 040 000 Old_age Always - 26 (0 15 0 0 0) What I'm pretty sure is happening is that the line preg_match("/Temperature.+(\d\d)$/im", $output, $match); doesn't match the two bottom patterns. It's late and I'm going to bed, but either you can figure out the proper match or I'll try tomorrow. Thanks for helping me find a problem with my plots.
-
For HDD Temps I use the scripts in this forum post: https://lime-technology.com/forum/index.php?topic=52220 As for your error I'm not sure. Did you modify it?
-
You can use something like Grafana to be the front end. Or you can run a query against the web api. I tried this query in my browser and it worked: http://tygra.tribe.home:8086/query?pretty=true&db=telegraf&q=SELECT%20*%20FROM%20cpu%20WHERE%20time%20%3E%20now()%20-%201h Where tygra.tribe.home points to the ip of my unRAID box.
-
My files are root:root. I get the same error with spigot builds, but I don't know anything about spigot. It all works with standard jars or even forge jars for me.
-
Yeah, I'm aware of the update issue. No idea on what is causing it. Sent from my Pixel XL using Tapatalk
-
I'm not sure, the easiest way will be to create a Mineos-node in a different location and then inspect the folder structures and determine if they are compatible. You could post he structures here if you need help determining.
-
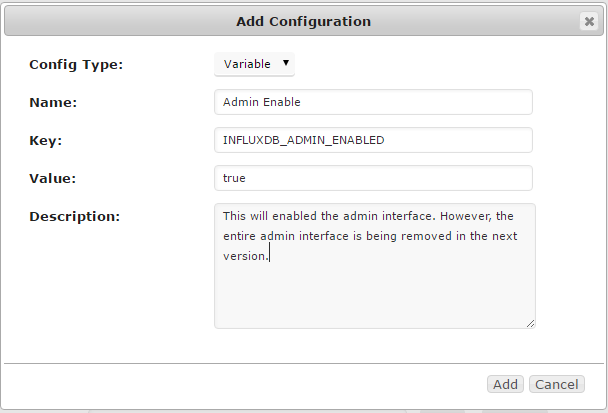
Dangit. Ok, well, at least it's not just me. I just learned about influxdb/telegraf/grafana and was all excited and I'm sitting here smashing my head against my desk over why I can't even get InfluxDB to load. Any ideas to anyone still on here? I finally figured this out. I started looking (albeit lazily) when wreave posted and wanted to find an answer before posting. Well, I found the answer. The influxdb admin interface has been deprecated. To enable the admin interface you can add an environment variable as shown in the attached image. However, like the changelog says the admin interface will be completely removed in the next release.
-
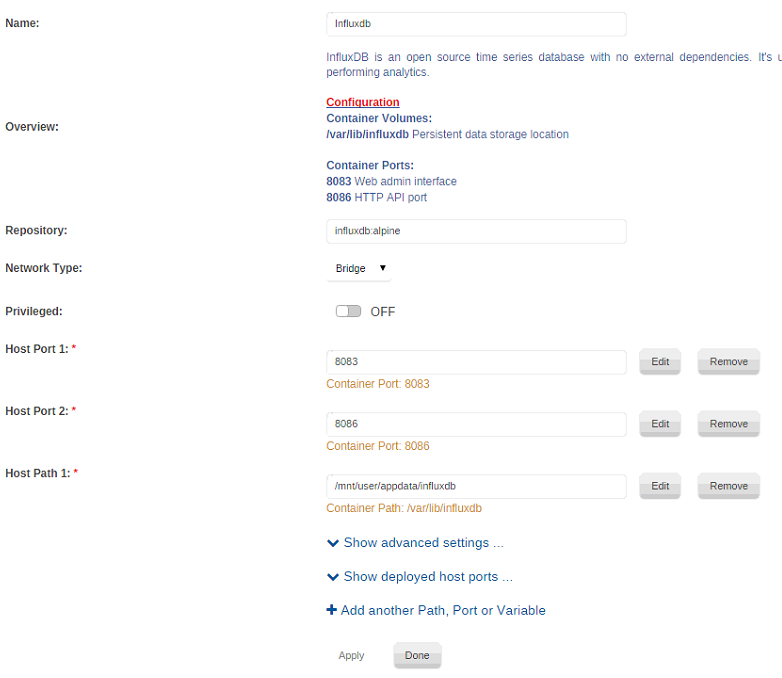
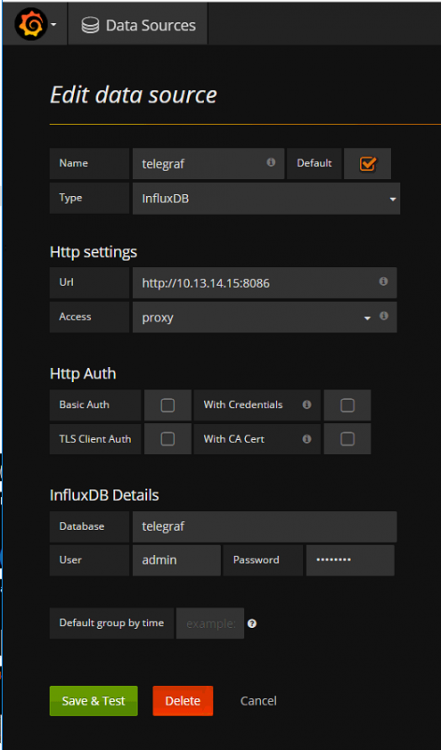
@wreave, you just open the ports in the service you want to connect to and then have the other service connect to those ports. For example: I have influxdb running on my unRAID box. It has port 8086 open as in the influxdb setup.png attachment. I have grafana also running on my unRAID box. It connects to ip of unRAID and the influxdb port for its default datasource, as shown in the Grafana Setup.png. Its really that simple. Let me know if you have any further questions. That helps a lot, last questions I hope. Does the Glances docker auto export to InfluxDB or do I have to do something special? Also the web interface for InfluxDB refuses to connect, any ideas? Thanks again You will need to modify the glances config file as explained here: http://glances.readthedocs.io/en/stable/gw/influxdb.html. But it also says you need to start glances with the influxdb flag. I think a better way would be to use Telegraf to get stats on your unRAID box. Have you looked into Telegraf before? Its my preferred method.
-
@wreave, you just open the ports in the service you want to connect to and then have the other service connect to those ports. For example: I have influxdb running on my unRAID box. It has port 8086 open as in the influxdb setup.png attachment. I have grafana also running on my unRAID box. It connects to ip of unRAID and the influxdb port for its default datasource, as shown in the Grafana Setup.png. Its really that simple. Let me know if you have any further questions.
-
The telegraf docker has a mapping to the configuration file located at: /mnt/user/appdata/telegraf/telegraf.conf If you look in that file at the input plugin section you'll see all of the inputs, the active input plugins are the ones that aren't commented out. You can look at the documentation for each input plugin on the github repo at: https://github.com/influxdata/telegraf/tree/master/plugins/inputs the cpu and other system plugins are at https://github.com/influxdata/telegraf/tree/master/plugins/inputs/system.
-
Rainman, glad you figured it out. Sorry, I missed your first message in the clutter of my inbox. To update anything in the grafana.ini you can map a volume to it, or you can use more environment variables. See http://docs.grafana.org/installation/configuration/, basically you use the format of GF_<SectionName>_<KeyName> = some value, just like you did for the plugins.
-
Haven't tried pocketmine. If it works on normal mineos node it should work here too.
-
What version of unRaid? @Squid, I'm glad you saw this, because I have no idea.
-
@Viaduct, that is awesome? Could you share the script? Maybe post it on GitHub or something? Also, your crontab command? I want to try this. It looks amazing.
-
Ah so it is. I'll have to fix that.
-
I never set up an icon, so that's why it looks like that.
-
A how to guide would probably be a good idea. I'll see if I can come up with something soon.


