


RedXon
Members
-
Joined
-
Last visited
-
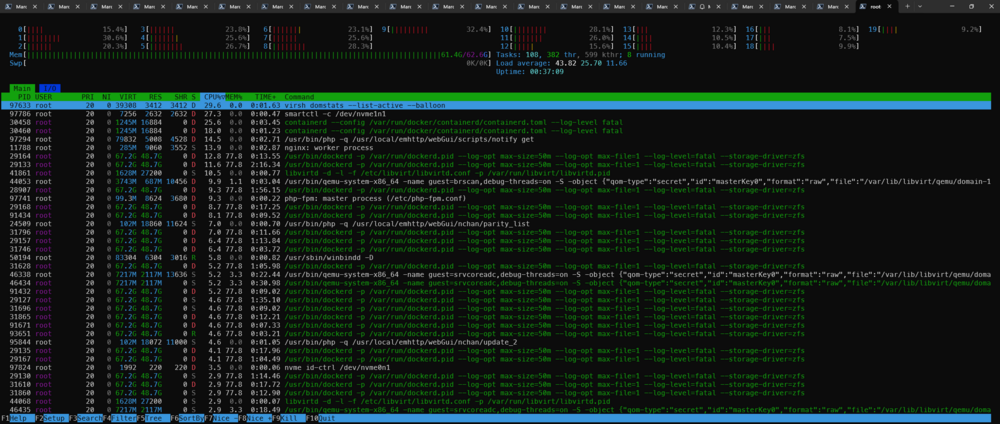
Alright, just another status update (for you, anyone interested and anyone seeing this post in the future with a similar problem). After the overlay2 didn't bring the desired effect, I switched back to a docker image. I tested it for what is now aproximately just under 24 hours and it seems to be good. I see the dockerd processes in htop but they each consume just 0.1% memory, where before (with natie and overlay2 docker storage in a folder) it would creep up until it was well over 40% memory and rising until it would just crash and be killed by the linux oom-killer. I don't have all the containers up yet just the ones I did the testing before (so the arr suite, plex, nextcloud and some databases) and so far so good. I just started the LLM containers, my GIT, immich and some others again so I'm sitting at 39 running containers with just about 45% memory usage and 39% usage of the docker.img file. Seems to be working so far. The reason I intially switched away from docker.img maybe for some background is that a few years ago (I've been using Unraid since about 2016 or longer I guess) I got fed up with the way unRaid handeled containers, the Appstore etc. as I was used to working with compose and at that point also kubernetes. So I switched all my containers to a few VMs and run everything with compose. On the VMs naturally I could use docker volumes among other things as the volumes would be in a folder, not in an image with limited file size. The VMs did have downsied though, as mounting the array in the VM was always not an ideal solution for some tasks. A bit later I figured out a good workflow for me to run compose directly on unRaid so I switched everything back to running on the host itself although with compose. Because I missed some docker volumes and I did have many images (with that many containers that I had at the time) my docker.img got full very fast, which is why I switched to the folder method as I thought it was better than the other one. But now that I have fixed almost all of the docker volumes to folder mounts on /mnt/cache/appdata though I should not run in to the problem of a full docker image again I hope. So fingers crossed this will work for good now. And still while writing this long paragraph (which to be fair probably no one asked for and will skip anyway) I started the rest of all the containers I was running before (so at the time my problems started) and so far I can report no memory leaks or high CPU load as I had before. The dockerd service is sitting happily at an average of 1-2% CPU load and 0.1-0.2% memory load as it did like before the problems started. I will investigate for a few more days and mark as solved if it doesn't happen again. So TL;DR for anyone else I guess: If you're running ZFS cache on unRaid 7.1.x and using a docker folder seeing this task use a lot of ressources in htop: /usr/bin/dockerd -p /var/run/dockerd.pid --log-opt max-size=500m --log-opt max-file=1 --log-level=fatal --storage-driver=btrs Then you might as well try to switch to a docker image again and see if it works. Some other users reported having this issue when the container mounts were not on /mnt/cache/appdata but on /mnt/user/appdata instead, pointing to the fact that the dockerd process is not happy with having slow I/O, so another option for the affected would be to check that and also storage integrity.
-
Unfortunately it only seemed to get better with overlay2 instead of native. It was working just fine for a while but now my dockerd process is using over 40GBs again. Might need to check if a change back to the docker image could resolve this. Very weird behaviour. At the moment dockerd is filling ram and making the WebUI unrespsonive. The weird thing is I still haven't figured out where these 40Gigs usage come from, not from the containers it seems, as I managed to limit all the containers that run at the moment and they can consume a maximum of 20GB of memory in total and up until dockerd has put the server OOM again were using around 12 Gigs. So something else is clearly going on.
-
Thank you, with the limited test with just some selected containers it seems to work for now after switching to overlay2 for now. However I just saw that memory limit don't seem to work on Unraid when using compose, I get this error for now, but need to check further: Your kernel does not support swap limit capabilities or the cgroup is not mounted. Memory limited without swap. So I'll see how that goes after I restart most of my "important" compose files.
-
Ah I see let me try that. Funnily enough this wasn't an issue before but good to know. I switched from image to folder recently as my image kept getting full as I have a lot of images and my configs weren't always ideal with docker volumes, most of which I switched to folder mounts since. Also, something to consider, i don't really use the appstore much, almost all of which I run is running directly with docker-compose.
-
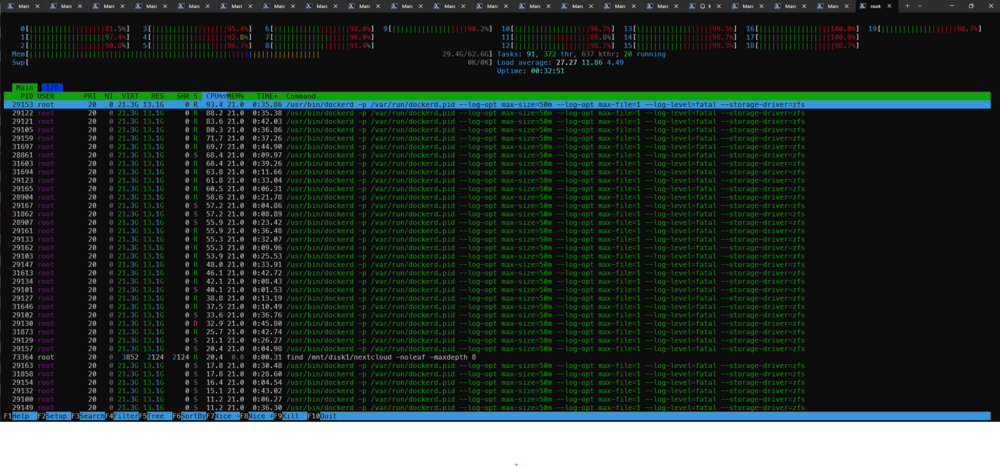
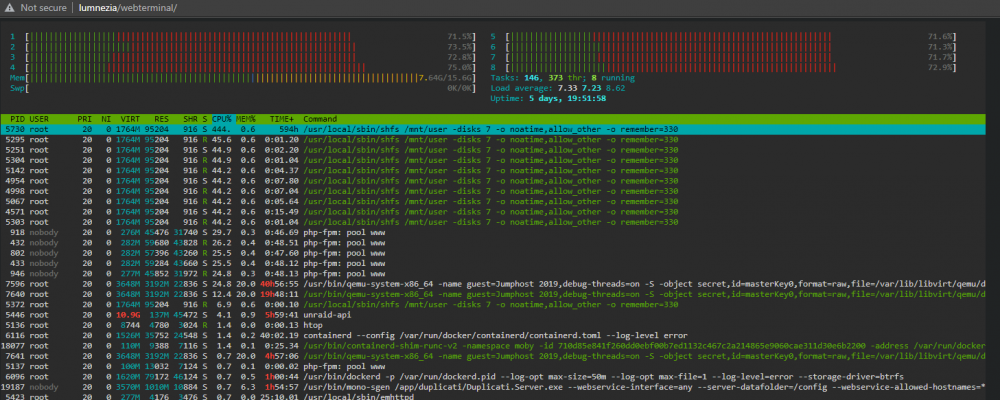
Turns out it aparently isn't one of my containers. This is the output from htop when no container is started: I think this somehow has messed up my docker config. I don't use a docker image but I use a docker folder, I might need to try and back this up and start over. Edit: Getting worse, a few minutes later it has filled up my ram again and is crashing the WebUI and other things:
-
Just did that, it seems better but not perfect yet. I limited all my containers to reasonable values and while I didn't run in to complete OOM errors still the WEBUI got unrespsonsive after some time and the docker.d process got very high memory and CPU usage. I also didn't run the ones I suspect were using much memory like llm containers etc. It was running fine for a while and Plex and many other things were running but yeah, I definitely saw much higher load than just 2 days ago (and the last few months before this) and this seemed to all be caused by the dockerd process. Also many other weird things happen and my logs are filled with many errors from other things including GPUs etc. Docker stats however showed that all containers stayed well under their memory limit and calculating that it seemed fine, but still the dockerd processes kept creeping up. Now running a memory check and collecting other logs to investigate more. Something is clearly very wrong. The fact that everything worked perfectly with no errors etc. for many months where I didn't change or start any new containers is a bit concerning. Yes, I do run a lot of containers but they were running for quite a while but this is leading me to think maybe something is wrong with hardware maybe and I want that ruled out first. So next step for me is memory check, then I'll check and replace the flash drive to see if anything could be wrong there to rule out any defects there. The disks and filesystems seem to be fine so far but I'll be double checking that. This morning my docker.log file was filled with these lines repeating: 2025/06/06 03:09:05 http: superfluous response.WriteHeader call from go.opentelemetry.io/contrib/instrumentation/net/http/otelhttp.(*respWriterWrapper).WriteHeader (wrap.go:88) time="2025-06-06T03:09:06.239570146+02:00" level=error msg="post event" error="context deadline exceeded" time="2025-06-06T03:09:06.511020566+02:00" level=error msg="ttrpc: received message on inactive stream" stream=1503 2025/06/06 03:09:22 http: superfluous response.WriteHeader call from go.opentelemetry.io/contrib/instrumentation/net/http/otelhttp.(*respWriterWrapper).WriteHeader (wrap.go:88) So that seems to still be some memory leak somewhere. So my plan of action: Check Hardware Check disks, file system etc. Try even smaller subsets of containers than before Go from here Thank you for your help so far.
-
Hi all I suddenly run into this problem as following: Today my server suddenly was not responsive and I had to hard reset. After the boot I ran into the issue again, but this time was able to see the culprit: /usr/bin/dockerd -p /var/run/dockerd.pid --log-opt max-size=500m --log-opt max-file=1 --log-level=fatal --storage-driver=btrs This task was using almost all of my CPU and increasing Memory minute by minute until it finally crashed. After that the webui and the server was unresponsive on SSH and also WebUI or direct console access. I rebootet again and tried to stop some containers etc. but the same thing happened. This time though SSH came back, the WebUI never did but I was able to collect diagnostics through this: I have run with these containers for a long time and today is the first time this happened. What could be the issue? Should I replace the flash drive? Cache SSD? Anything? The SMART values seem to look okay. However in the syslog I can clearly see the out of memory error. With the worst offenders there seem to be dockerd but also meilisearch so I will try to reboot without that momentarily. Does anyone see anything else out of order here? Thanks redstore-diagnostics-20250604-2205.zip
-
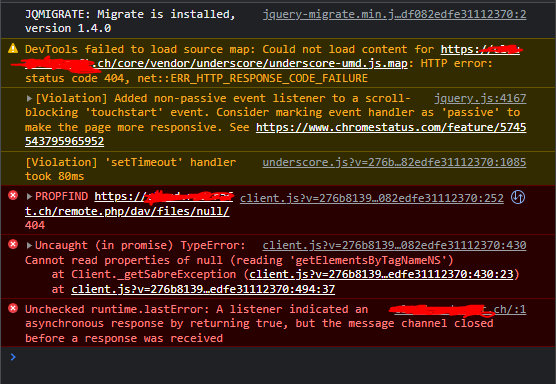
I'm having some problems with loading my files in the WebUI. It works fine with the Desktop Client and even works fine with the iOS app on my phone, but not in the WebUI, even when using different browsers and different PCs. I just get a spinning loading wheel indefinitely and in the browser console this is visible, does anyone know what this could be? Maybe a DB or Webserver issue? I'm on the latest container and the latest version (10.11)
-
Yeah, I have followed pretty much this guide. At the moment I have a IPSEC Site to Site VPN running between these Sites, but I am hoping for better performance when using Wireguard (IPSEC maxes out at about 35mbit/s in this particular hardware). Of course I have shut down the IPSEC VPN before setting up the Wireguard VPN to avoid problems with these. It was quite the ride as I was using jumphosts on either site to have access to the configurations. As I said, I am not sure if the issue lies with unraid or with the routers itself. If it helps, here are the configs (redacted a bit)... Config on unraid 1 [Interface] #Site2Site PrivateKey=redacted Address=10.253.0.1 ListenPort=51821 PostUp=logger -t wireguard 'Tunnel WireGuard-wg0 started' PostUp=iptables -t nat -A POSTROUTING -s 10.253.0.0/24 -o br0 -j MASQUERADE PostDown=logger -t wireguard 'Tunnel WireGuard-wg0 stopped' PostDown=iptables -t nat -D POSTROUTING -s 10.253.0.0/24 -o br0 -j MASQUERADE PostUp=ip -4 route flush table 200 PostUp=ip -4 route add default via 10.253.0.1 table 200 PostUp=ip -4 route add 192.168.0.0/24 via 192.168.0.1 table 200 PostDown=ip -4 route flush table 200 PostDown=ip -4 route add unreachable default table 200 PostDown=ip -4 route add 192.168.0.0/24 via 192.168.0.1 table 200 [Peer] #Unraid2 PublicKey=redacted PresharedKey=redacted Endpoint=redacted.tld:51822 AllowedIPs=10.253.0.0/24, 192.168.1.0/24 Config on unraid 2: [Interface] #Site2Site PrivateKey=redacted Address=10.253.0.2 ListenPort=51822 PostUp=logger -t wireguard 'Tunnel WireGuard-wg0 started' PostUp=iptables -t nat -A POSTROUTING -s 10.253.0.0/24 -o br0 -j MASQUERADE PostDown=logger -t wireguard 'Tunnel WireGuard-wg0 stopped' PostDown=iptables -t nat -D POSTROUTING -s 10.253.0.0/24 -o br0 -j MASQUERADE PostUp=ip -4 route flush table 200 PostUp=ip -4 route add default via 10.253.0.2 table 200 PostUp=ip -4 route add 192.168.1.0/24 via 192.168.1.1 table 200 PostDown=ip -4 route flush table 200 PostDown=ip -4 route add unreachable default table 200 PostDown=ip -4 route add 192.168.1.0/24 via 192.168.1.1 table 200 [Peer] #Unraid 1 PublicKey=redacted PresharedKey=redacted Endpoint=redacted.tld:51821 AllowedIPs=10.253.0.0/24, 192.168.0.0/24 Thanks for any input!
-
I am sure that I am doing something completely stupid and there is an easy fix, but after some hours of troubleshooting I'd rather ask here for a change: So, I am trying to set up site to site VPN with unRaid. And for some reason it works only from and to the servers but not beyond, could be a routing issue, could be firewall but I don't get what exactly is blocking what. To make it quick: Network1: 192.168.0.0/24, Network2: 192.168.1.0/24 Unraid1: 192.168.0.2, Unraid2: 192.168.1.2 So what works is: Connecting from one unRaid server to the other unraid Server and vice versa Connecting and pinging from unraid 2 server to any client on network 1 Connecting and pinging from unraid 1 server to any client on network 2 Connecting and pinging from any client on network 1 to unraid 2 Pinging the tunnel address of unraid 1 from any client on network 2 Pinging the tunnel address of unraid 2 from any client on network 1 What doesn't work: Pinging from any client other than unraid 2 on network 2 to anything on network 1 Pinging from any client on network 1 to any client on network 2 other than unraid 2 So I hope it is understandable. Basically I cannot get to network 1 from network 2 beyond unraid 2, as if the server is blocking it somehow. I have set up routing and the rest exactly like in the tutorial. Any Ideas?
-
Hi I have this weird issue where unraid reports that my log is full and also that my /var/log directory or mountpoint is getting full but when I check in there, there are no large files, there is nothing which would make it full. What can this be? I am at a loss of ideas because this sometimes freezes my system as well. Here are my findings. I also checked all the subfolders. root@Azeroth:/var/log# tree -s . ├── [ 0] btmp ├── [ 0] cron ├── [ 0] debug ├── [ 0] faillog ├── [ 0] lastlog ├── [ 120] libvirt │ ├── [ 378] libvirtd.log │ ├── [ 40] qemu │ ├── [ 0] virtlockd.log │ └── [ 0] virtlogd.log ├── [ 0] mcelog ├── [ 0] messages ├── [ 40] nfsd ├── [ 60] nginx │ └── [ 3438] error.log ├── [ 24] packages -> ../lib/pkgtools/packages ├── [ 100] pkgtools │ ├── [ 240] removed_packages │ │ ├── [ 1198] atop-2.2-x86_64-2 │ │ ├── [ 2338] community.applications-2022.03.13-x86_64-1-upgraded-2022-03-18,09:08:57 │ │ ├── [ 2414] community.applications-2022.03.17a-x86_64-1-upgraded-2022-03-23,14:52:02 │ │ ├── [ 2414] community.applications-2022.03.22a-x86_64-1-upgraded-2022-05-11,14:43:13 │ │ ├── [ 952] dynamix.file.manager-upgraded-2022-03-21,10:52:39 │ │ ├── [ 0] dynamix.file.manager-upgraded-2022-03-29,16:27:48 │ │ ├── [ 1713] dynamix.unraid.net │ │ ├── [ 2668] fix.common.problems-2022.03.13-x86_64-1-upgraded-2022-03-21,10:52:41 │ │ ├── [ 0] fix.common.problems-2022.03.18-x86_64-1-upgraded-2022-03-29,16:27:46 │ │ └── [ 2668] fix.common.problems-2022.03.29-x86_64-1-upgraded-2022-05-11,14:43:11 │ ├── [ 60] removed_scripts │ │ └── [ 829] atop-2.2-x86_64-2 │ └── [ 40] removed_uninstall_scripts ├── [ 580] plugins │ ├── [ 33] NerdPack.plg -> /boot/config/plugins/NerdPack.plg │ ├── [ 35] ca.backup2.plg -> /boot/config/plugins/ca.backup2.plg │ ├── [ 47] ca.update.applications.plg -> /boot/config/plugins/ca.update.applications.plg │ ├── [ 47] community.applications.plg -> /boot/config/plugins/community.applications.plg │ ├── [ 35] dvb-driver.plg -> /boot/config/plugins/dvb-driver.plg │ ├── [ 47] dynamix.active.streams.plg -> /boot/config/plugins/dynamix.active.streams.plg │ ├── [ 43] dynamix.cache.dirs.plg -> /boot/config/plugins/dynamix.cache.dirs.plg │ ├── [ 45] dynamix.file.manager.plg -> /boot/config/plugins/dynamix.file.manager.plg │ ├── [ 42] dynamix.schedules.plg -> /boot/config/plugins/dynamix.schedules.plg │ ├── [ 41] dynamix.ssd.trim.plg -> /boot/config/plugins/dynamix.ssd.trim.plg │ ├── [ 44] dynamix.system.info.plg -> /boot/config/plugins/dynamix.system.info.plg │ ├── [ 45] dynamix.system.stats.plg -> /boot/config/plugins/dynamix.system.stats.plg │ ├── [ 44] dynamix.system.temp.plg -> /boot/config/plugins/dynamix.system.temp.plg │ ├── [ 43] dynamix.unraid.net.plg -> /boot/config/plugins/dynamix.unraid.net.plg │ ├── [ 38] file.activity.plg -> /boot/config/plugins/file.activity.plg │ ├── [ 44] fix.common.problems.plg -> /boot/config/plugins/fix.common.problems.plg │ ├── [ 37] networkstats.plg -> /boot/config/plugins/networkstats.plg │ ├── [ 38] nvidia-driver.plg -> /boot/config/plugins/nvidia-driver.plg │ ├── [ 35] open.files.plg -> /boot/config/plugins/open.files.plg │ ├── [ 36] plexstreams.plg -> /boot/config/plugins/plexstreams.plg │ ├── [ 31] rclone.plg -> /boot/config/plugins/rclone.plg │ ├── [ 40] tips.and.tweaks.plg -> /boot/config/plugins/tips.and.tweaks.plg │ ├── [ 55] unRAIDServer.plg -> /usr/local/emhttp/plugins/unRAIDServer/unRAIDServer.plg │ ├── [ 48] unassigned.devices-plus.plg -> /boot/config/plugins/unassigned.devices-plus.plg │ ├── [ 43] unassigned.devices.plg -> /boot/config/plugins/unassigned.devices.plg │ ├── [ 34] unbalance.plg -> /boot/config/plugins/unbalance.plg │ └── [ 37] user.scripts.plg -> /boot/config/plugins/user.scripts.plg ├── [ 40] pwfail ├── [ 25] removed_packages -> pkgtools/removed_packages ├── [ 24] removed_scripts -> pkgtools/removed_scripts ├── [ 34] removed_uninstall_scripts -> pkgtools/removed_uninstall_scripts ├── [ 160] samba │ ├── [ 100] cores │ │ ├── [ 40] nmbd │ │ ├── [ 40] smbd │ │ └── [ 40] winbindd │ ├── [ 5556] log.nmbd │ ├── [ 1602] log.smbd │ ├── [ 680] log.wb-AZEROTH │ ├── [ 2822] log.winbindd │ └── [ 680] log.winbindd-idmap ├── [ 23] scripts -> ../lib/pkgtools/scripts ├── [ 0] secure ├── [ 21] setup -> ../lib/pkgtools/setup ├── [ 0] spooler ├── [ 60] swtpm │ └── [ 60] libvirt │ └── [ 40] qemu ├── [ 60] unraid-api │ └── [ 0] stderr.log ├── [ 0] vfio-pci └── [ 7296] wtmp 25 directories, 59 files Also my df -h command root@Azeroth:/var/log# df -h Filesystem Size Used Avail Use% Mounted on rootfs 16G 9.2G 6.5G 59% / tmpfs 32M 2.9M 30M 9% /run /dev/sda1 15G 1.3G 14G 9% /boot overlay 16G 9.2G 6.5G 59% /lib/firmware overlay 16G 9.2G 6.5G 59% /lib/modules devtmpfs 8.0M 0 8.0M 0% /dev tmpfs 16G 0 16G 0% /dev/shm cgroup_root 8.0M 0 8.0M 0% /sys/fs/cgroup tmpfs 384M 384M 8.0K 100% /var/log tmpfs 1.0M 0 1.0M 0% /mnt/disks tmpfs 1.0M 0 1.0M 0% /mnt/remotes tmpfs 1.0M 0 1.0M 0% /mnt/rootshare /dev/md1 7.3T 6.9T 465G 94% /mnt/disk1 /dev/md2 7.3T 6.5T 845G 89% /mnt/disk2 /dev/md3 7.3T 6.4T 924G 88% /mnt/disk3 /dev/md4 3.7T 2.8T 932G 75% /mnt/disk4 /dev/md5 3.7T 3.1T 649G 83% /mnt/disk5 /dev/md6 3.7T 2.8T 932G 75% /mnt/disk6 /dev/md7 7.3T 6.6T 788G 90% /mnt/disk7 /dev/md8 3.7T 2.8T 918G 76% /mnt/disk8 /dev/md9 3.7T 2.8T 878G 77% /mnt/disk9 /dev/md10 7.3T 6.4T 935G 88% /mnt/disk10 /dev/sdc1 1.2T 887G 223G 80% /mnt/cache shfs 55T 47T 8.1T 86% /mnt/user0 shfs 55T 47T 8.1T 86% /mnt/user /dev/loop2 80G 20G 59G 25% /var/lib/docker /dev/loop3 1.0G 4.4M 904M 1% /etc/libvirt tmpfs 3.2G 0 3.2G 0% /run/user/0 Does anyone have any idea why that could be the case? If it matters, I have a syslog server to which the syslog is getting transmitted but all it's receiving is: Azeroth rsyslogd: file '/var/log/syslog'[5] write error - see https://www.rsyslog.com/solving-rsyslog-write-errors/ for help OS error: No space left on device [v8.2102.0 try https://www.rsyslog.com/e/2027 ] Local Syslog server as well as mirror to flash is disabled. Also, as you might see in the diagnostics, CPU and RAM is pinned at 100% at the moment but TOP or HTOP isn't reflecting that. Diagnostics as follows: azeroth-diagnostics-20220531-1647.zip
-
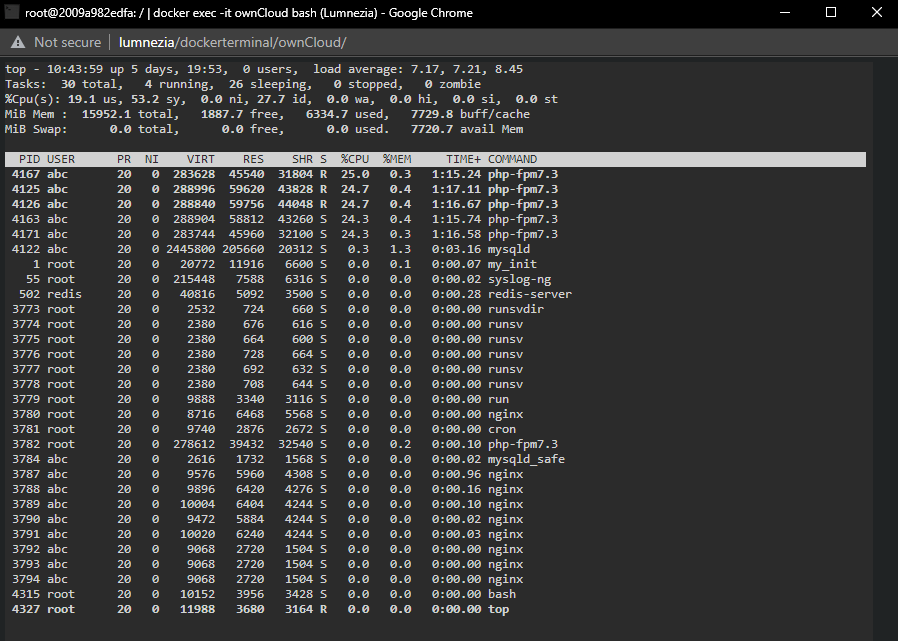
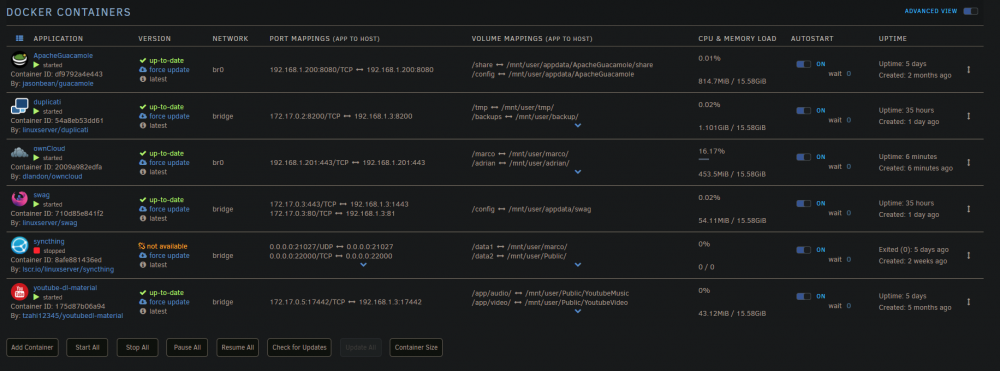
EDIT: Nevermind, I got it solved... turned out one of my users had a very very large folder with many very very little files in his shared owncloud folder. This was causing very high CPU as owncloud was constantly trying to scan that folder but never got very far because it always changed. I moved the folder out and told him not to do that again and CPU is back to normal again... I tried to Pin and not Pin. If I pin I get high load just on the pinned ports obviously but if I don't pin I get high load on all the ports. Let me give you some examples: This is CPU load in system. Normally when running like this it was about 10-15% load. When I stop owncloud it goes down to that, once owncloud is running CPU load is always at about 75%. Htop in unRaid gives me this: Now, of course it could be that the SHFS load in there is not from ownCloud but it stops as soon as I stop the container so something weird is going on. Also, this is what TOP looks inside of ownCloud. With this on my docker overview: But yeah, seems like a weird problem to have. Thank you so much for looking at it tough! I love this container and would love to get it working flawless again.
-
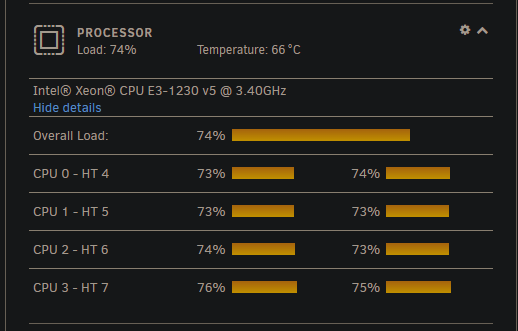
Hi So what I noticed recently is that PHP-FPM uses a lot of CPU on my server, so much in fact that it slows down other containers. This should not be the case. I can pin the container to only use certain cores but then the UI slows down a lot. Why is that the case? So, in TOP in the container I can see 4 PHP-FPM instanced which all use up to 30% CPU which then in turn leads to a overall system usage of about 70% on my server. I don't recall that being that way in the past so did anything change? It happens like this in PHP 7.3 and 7.4 (can't use 7.2 as I am on the newest version). Is there a way to use an alternative to FPM or is it a known bug? As I understand it OwnCloud doesn't recommend the usage of FPM for OwnCloud. Thanks
-
So, after I posted a few times already with strange crashes, freezes and kernel panics I can not get the issue resolved. It's getting really frustrating to the point on where I am close on giving up with unRaid, although I don't know if other OSses would behave better. So the log on it's dying grasp are down below, here are the steps I did so far: - Turned of macvlan and switched to ipvlan. Also I tried all the solutions in the thread about this issue. As far as I can tell i didn't get any call traces. - I replaced the ram, because I wasn't sure if that was the issue. Now I have 32GB of ECC ram in there and still it crashes... - Repaired the filesystem on the cache drive because I had some errors from there. No more errors from that but still... So in summary I resolved all my other issues I could have had but still it crashes after an uptime of 5-10 days. Really frustrating. What else could I do? Motherboard issue? CPU issue? The CPU and Motherboard was in my windows PC for a long time and I didn't have any issues with it. Also when I moved it to my unraid box I didn't have any issues for a while, it only really started a few months ago. Logs: "Azeroth kernel: RAX: 0000000000017bc0 RBX: 0000000000000000 RCX: ffffffff81801047" "Azeroth kernel: RDX: 0000000000000000 RSI: 0000000000000000 RDI: fffffe00000d6758" "Azeroth kernel: RIP: 0010:exc_page_fault+0x17/0x101" "Azeroth kernel: RAX: 0000000000017bc0 RBX: 0000000000000000 RCX: ffffffff81801047" "Azeroth kernel: RDX: 0000000000000000 RSI: 0000000000000000 RDI: fffffe00000d6688" "Azeroth kernel: R10: 0000000000000000 R11: 0000000000000000 R12: 0000000000000000" "Azeroth kernel: asm_exc_page_fault+0x1e/0x30" "Azeroth kernel: Code: 83 e9 85 7e 00 44 89 e6 48 89 ef 5d 41 5c e9 80 04 00 00 41 56 41 55 41 54 49 89 f4 55 48 89 fd 0f 20 d0 0f 1f 40 00 49 89 c5 <65> 48 8b 04 25 c0 7b 01 00 48 8b 80 a8 03 00 00 0f 0d 48 78 66 90" "Azeroth kernel: R13: 0000000000017bc0 R14: 0000000000000000 R15: 0000000000000000" "Azeroth kernel: ? native_iret+0x7/0x7" "Azeroth kernel: RBP: fffffe00000d6688 R08: 0000000000000000 R09: 0000000000000000" "Azeroth kernel: RBP: fffffe00000d6758 R08: 0000000000000000 R09: 0000000000000000" "Azeroth kernel: R10: 0000000000000000 R11: 0000000000000000 R12: 0000000000000000" "Azeroth kernel: RSP: 0000:fffffe00000d6730 EFLAGS: 00010083" "Azeroth kernel: asm_exc_page_fault+0x1e/0x30" "Azeroth kernel: RAX: 0000000000017bc0 RBX: 0000000000000000 RCX: ffffffff81801047" "Azeroth kernel: RIP: 0010:exc_page_fault+0x17/0x101" "Azeroth kernel: RDX: 0000000000000000 RSI: 0000000000000000 RDI: fffffe00000d65b8" "Azeroth kernel: RAX: 0000000000017bc0 RBX: 0000000000000000 RCX: ffffffff81801047" "Azeroth kernel: Code: 83 e9 85 7e 00 44 89 e6 48 89 ef 5d 41 5c e9 80 04 00 00 41 56 41 55 41 54 49 89 f4 55 48 89 fd 0f 20 d0 0f 1f 40 00 49 89 c5 <65> 48 8b 04 25 c0 7b 01 00 48 8b 80 a8 03 00 00 0f 0d 48 78 66 90" "Azeroth kernel: ? native_iret+0x7/0x7" "Azeroth kernel: RBP: fffffe00000d64e8 R08: 0000000000000000 R09: 0000000000000000" "Azeroth kernel: R13: 0000000000017bc0 R14: 0000000000000000 R15: 0000000000000000" "Azeroth kernel: RBP: fffffe00000d65b8 R08: 0000000000000000 R09: 0000000000000000" "Azeroth kernel: R10: 0000000000000000 R11: 0000000000000000 R12: 0000000000000000" "Azeroth kernel: RSP: 0000:fffffe00000d6660 EFLAGS: 00010083" "Azeroth kernel: Code: 83 e9 85 7e 00 44 89 e6 48 89 ef 5d 41 5c e9 80 04 00 00 41 56 41 55 41 54 49 89 f4 55 48 89 fd 0f 20 d0 0f 1f 40 00 49 89 c5 <65> 48 8b 04 25 c0 7b 01 00 48 8b 80 a8 03 00 00 0f 0d 48 78 66 90" "Azeroth kernel: R13: 0000000000017bc0 R14: 0000000000000000 R15: 0000000000000000" "Azeroth kernel: RDX: 0000000000000000 RSI: 0000000000000000 RDI: fffffe00000d64e8" "Azeroth kernel: ? native_iret+0x7/0x7" "Azeroth kernel: asm_exc_page_fault+0x1e/0x30" "Azeroth kernel: RSP: 0000:fffffe00000d6590 EFLAGS: 00010083" "Azeroth kernel: RSP: 0000:fffffe00000d64c0 EFLAGS: 00010083" "Azeroth kernel: RIP: 0010:exc_page_fault+0x17/0x101" "Azeroth kernel: R10: 0000000000000000 R11: 0000000000000000 R12: 0000000000000000" "Azeroth kernel: RDX: 0000000000000000 RSI: 0000000000000000 RDI: fffffe00000d6418" "Azeroth kernel: RDX: 0000000000000000 RSI: 0000000000000000 RDI: fffffe00000d6348" "Azeroth kernel: Code: 83 e9 85 7e 00 44 89 e6 48 89 ef 5d 41 5c e9 80 04 00 00 41 56 41 55 41 54 49 89 f4 55 48 89 fd 0f 20 d0 0f 1f 40 00 49 89 c5 <65> 48 8b 04 25 c0 7b 01 00 48 8b 80 a8 03 00 00 0f 0d 48 78 66 90" "Azeroth kernel: R10: 0000000000000000 R11: 0000000000000000 R12: 0000000000000000" "Azeroth kernel: Code: 83 e9 85 7e 00 44 89 e6 48 89 ef 5d 41 5c e9 80 04 00 00 41 56 41 55 41 54 49 89 f4 55 48 89 fd 0f 20 d0 0f 1f 40 00 49 89 c5 <65> 48 8b 04 25 c0 7b 01 00 48 8b 80 a8 03 00 00 0f 0d 48 78 66 90" "Azeroth kernel: R10: 0000000000000000 R11: 0000000000000000 R12: 0000000000000000" "Azeroth kernel: RAX: 0000000000017bc0 RBX: 0000000000000000 RCX: ffffffff81801047" "Azeroth kernel: RSP: 0000:fffffe00000d63f0 EFLAGS: 00010083" "Azeroth kernel: Code: 83 e9 85 7e 00 44 89 e6 48 89 ef 5d 41 5c e9 80 04 00 00 41 56 41 55 41 54 49 89 f4 55 48 89 fd 0f 20 d0 0f 1f 40 00 49 89 c5 <65> 48 8b 04 25 c0 7b 01 00 48 8b 80 a8 03 00 00 0f 0d 48 78 66 90" "Azeroth kernel: R13: 0000000000017bc0 R14: 0000000000000000 R15: 0000000000000000" "Azeroth kernel: RIP: 0010:exc_page_fault+0x17/0x101" "Azeroth kernel: asm_exc_page_fault+0x1e/0x30" "Azeroth kernel: ? native_iret+0x7/0x7" "Azeroth kernel: RAX: 0000000000017bc0 RBX: 0000000000000000 RCX: ffffffff81801047" "Azeroth kernel: RBP: fffffe00000d6418 R08: 0000000000000000 R09: 0000000000000000" "Azeroth kernel: RSP: 0000:fffffe00000d6320 EFLAGS: 00010083" "Azeroth kernel: RIP: 0010:exc_page_fault+0x17/0x101" "Azeroth kernel: ? native_iret+0x7/0x7" "Azeroth kernel: R13: 0000000000017bc0 R14: 0000000000000000 R15: 0000000000000000" "Azeroth kernel: asm_exc_page_fault+0x1e/0x30" "Azeroth kernel: RIP: 0010:exc_page_fault+0x17/0x101" "Azeroth kernel: RBP: fffffe00000d6348 R08: 0000000000000000 R09: 0000000000000000" "Azeroth kernel: RIP: 0010:exc_page_fault+0x17/0x101" "Azeroth kernel: asm_exc_page_fault+0x1e/0x30" "Azeroth kernel: R13: 0000000000017bc0 R14: 0000000000000000 R15: 0000000000000000" "Azeroth kernel: RBP: fffffe00000d61a8 R08: 0000000000000000 R09: 0000000000000000" "Azeroth kernel: RDX: 0000000000000000 RSI: 0000000000000000 RDI: fffffe00000d6278" "Azeroth kernel: RIP: 0010:exc_page_fault+0x17/0x101" "Azeroth kernel: asm_exc_page_fault+0x1e/0x30" "Azeroth kernel: asm_exc_page_fault+0x1e/0x30" "Azeroth kernel: RDX: 0000000000000000 RSI: 0000000000000000 RDI: fffffe00000d61a8" "Azeroth kernel: RBP: fffffe00000d6278 R08: 0000000000000000 R09: 0000000000000000" "Azeroth kernel: R10: 0000000000000000 R11: 0000000000000000 R12: 0000000000000000" "Azeroth kernel: RSP: 0000:fffffe00000d6180 EFLAGS: 00010083" "Azeroth kernel: RAX: 0000000000017bc0 RBX: 0000000000000000 RCX: ffffffff81801047" "Azeroth kernel: ? native_iret+0x7/0x7" "Azeroth kernel: ? native_iret+0x7/0x7" "Azeroth kernel: Code: 83 e9 85 7e 00 44 89 e6 48 89 ef 5d 41 5c e9 80 04 00 00 41 56 41 55 41 54 49 89 f4 55 48 89 fd 0f 20 d0 0f 1f 40 00 49 89 c5 <65> 48 8b 04 25 c0 7b 01 00 48 8b 80 a8 03 00 00 0f 0d 48 78 66 90" "Azeroth kernel: RAX: 0000000000017bc0 RBX: 0000000000000000 RCX: ffffffff81801047" "Azeroth kernel: R13: 0000000000017bc0 R14: 0000000000000000 R15: 0000000000000000" "Azeroth kernel: Code: 83 e9 85 7e 00 44 89 e6 48 89 ef 5d 41 5c e9 80 04 00 00 41 56 41 55 41 54 49 89 f4 55 48 89 fd 0f 20 d0 0f 1f 40 00 49 89 c5 <65> 48 8b 04 25 c0 7b 01 00 48 8b 80 a8 03 00 00 0f 0d 48 78 66 90" "Azeroth kernel: R10: 0000000000000000 R11: 0000000000000000 R12: 0000000000000000" "Azeroth kernel: RSP: 0000:fffffe00000d6250 EFLAGS: 00010083" "Azeroth kernel: RIP: 0010:exc_page_fault+0x17/0x101" "Azeroth kernel: R10: 0000000000000000 R11: 0000000000000000 R12: 0000000000000000" "Azeroth kernel: Call Trace:" "Azeroth kernel: asm_exc_page_fault+0x1e/0x30" "Azeroth kernel: <ENTRY_TRAMPOLINE>" "Azeroth kernel: RSP: 0000:fffffe00000d60b0 EFLAGS: 00010083" "Azeroth kernel: CS: 0010 DS: 0000 ES: 0000 CR0: 0000000080050033" "Azeroth kernel: R13: 0000000000017bc0 R14: 0000000000000000 R15: 0000000000000000" "Azeroth kernel: RDX: 0000000000000000 RSI: 0000000000000000 RDI: fffffe00000d60d8" "Azeroth kernel: R10: 0000000000000000 R11: 0000000000000000 R12: 0000000000000000" "Azeroth kernel: Code: 83 e9 85 7e 00 44 89 e6 48 89 ef 5d 41 5c e9 80 04 00 00 41 56 41 55 41 54 49 89 f4 55 48 89 fd 0f 20 d0 0f 1f 40 00 49 89 c5 <65> 48 8b 04 25 c0 7b 01 00 48 8b 80 a8 03 00 00 0f 0d 48 78 66 90" "Azeroth kernel: CR2: fffffe00000d5ff8 CR3: 00000001d6090000 CR4: 00000000003506e0" "Azeroth kernel: FS: 000014566f33f600(0000) GS:ffff8887fe900000(0000) knlGS:ffff8887fe900000" "Azeroth kernel: RAX: 0000000000017bc0 RBX: 0000000000000000 RCX: ffffffff81801047" "Azeroth kernel: ? native_iret+0x7/0x7" "Azeroth kernel: R13: 0000000000000000 R14: 0000000000000000 R15: 0000000000000000" "Azeroth kernel: RBP: fffffe00000d60d8 R08: 0000000000000000 R09: 0000000000000000" "Azeroth kernel: Code: dc e8 92 d3 8a ff 48 89 ef e8 97 65 89 ff e8 c9 d3 8a ff 5c 65 c6 05 83 e9 85 7e 00 44 89 e6 48 89 ef 5d 41 5c e9 80 04 00 00 <41> 56 41 55 41 54 49 89 f4 55 48 89 fd 0f 20 d0 0f 1f 40 00 49 89" "Azeroth kernel: RSP: 0000:fffffe00000d6000 EFLAGS: 00010083" "Azeroth kernel: RAX: 0000000081801047 RBX: 0000000000000000 RCX: ffffffff81801047" "Azeroth kernel: RBP: 0000000000000000 R08: 0000000000000000 R09: 0000000000000000" "Azeroth kernel: RDX: 0000000000000000 RSI: 0000000000000000 RDI: fffffe00000d6008" "Azeroth kernel: double fault: 0000 [#1] SMP NOPTI" "Azeroth kernel: Hardware name: System manufacturer System Product Name/CROSSHAIR VI HERO, BIOS 7601 10/16/2019" "Azeroth kernel: traps: PANIC: double fault, error_code: 0x0" "Azeroth kernel: RIP: 0010:exc_page_fault+0x0/0x101" "Azeroth kernel: CPU: 4 PID: 11633 Comm: fuser Tainted: P W O 5.14.15-Unraid #1" Thank you
-
I am on 6.10 RC for a while now which has not changed this behaviour. Unfortunately this prticular server is in a network which does not support VLANs. I will probably upgrade this network to something that supports VLANs but not at the moment unfortunately. I do however use a custom docker net so the containers have an internal IP in the 172.18.0.0/16 range and the external IP (not external on the WAN but external on the LAN) of the server.


