





MrLondon
Members
-
Joined
-
Last visited
Everything posted by MrLondon
-
Hi in Grafana, there is the + button on the the left side, if you hover over this you can see Import, here you can select the json file you downloaded from the first page.
-
Have you looked at this Tutorial which is actually really good https://technicalramblings.com/blog/how-to-setup-grafana-influxdb-and-telegraf-to-monitor-your-unraid-system/
-
Certainly well deserved with your great contributions Sent from my iPhone using Tapatalk
-
falconexe I just upgraded to 1.4 and changed the values to work on my system as I don't have user0 so had to change all to /mnt/user and then changed the cpu stuff to sensors like we did last week. Just with the system power is this possible with the sensors plugin? Fantastic release by the way. Keep up the amazing work.
-
looking fantastic, can't wait to test it out.
-
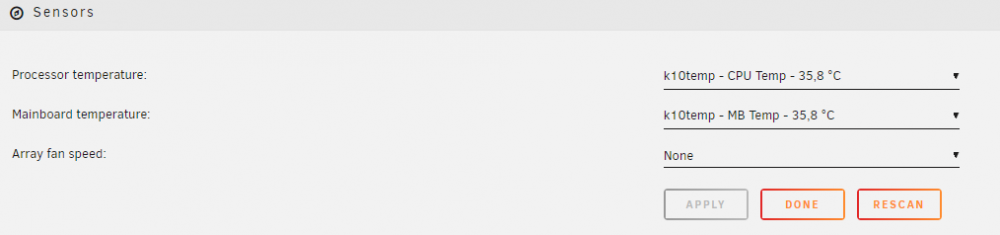
Actually this is the correct setting, I now updated my setup to this after checking in unraid under system temp and there it list the same chip asmmag05 showed.
-
sure we can do that
-
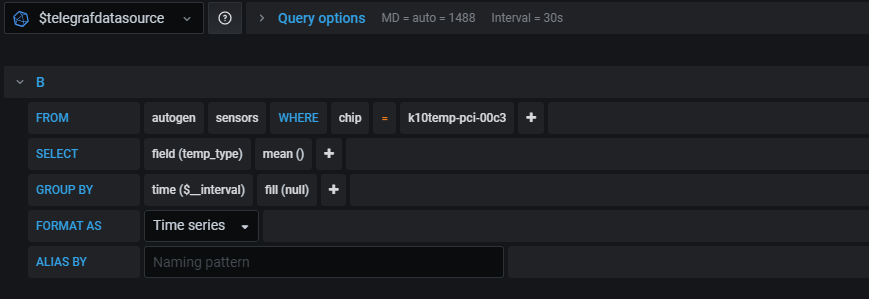
I guess here it would be helpful for someone with another AMD motherboard to post their settings because I looked and I cannot see anything obvious that will show me the cpu temp here, there are lots of values but nothing screams CPU temp.
-
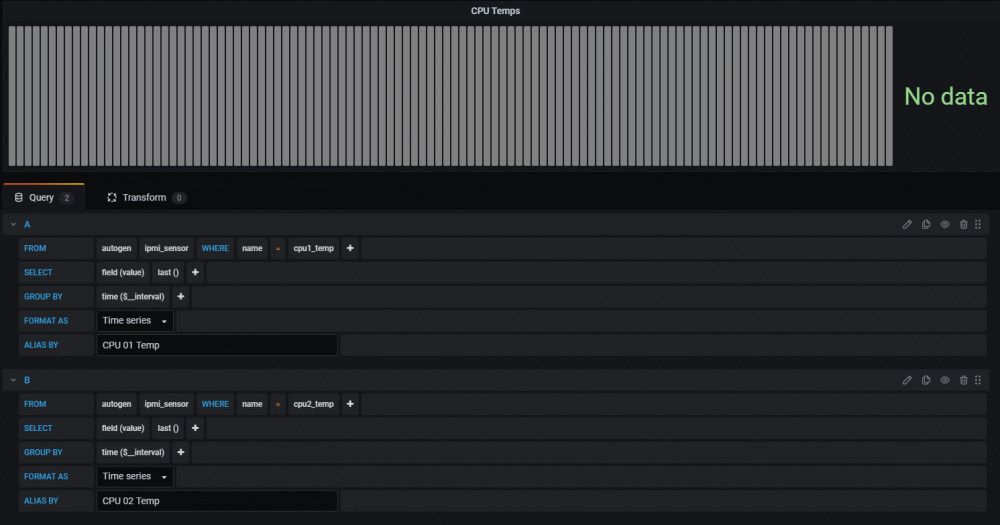
sorry another noob question, in the GUI I see the cpu temps at the top but that still references the ipmi_sensor which I know my motherboard does not support but the dropdown does not show sensors, any suggestion.
-
Thanks for the kind offer. I was able to reduce the sizes of some of the graphs already. The only thing I still have to work on is the temps are still not displayed but I don't know if that has something to do with AMD. I will wait for your 1.4 as you mention that you will change certain things in there for the sensors plugin.
-
Frist of all I must say you have done amazing work in such a short period of time. Always happy to assist with noob questions and that is greatly appreciated. As this is your baby I would say whatever is best for you going forward should be what is best to not consume your entire life. I of course I understand the different view points here. I am amazed how much information can be seen in this panel, yes because I only have a 24 inch screen I have to scrawl but I can easily live with that. I cannot wait how this continues and look forward to 1.4 and 1.5.
-
looking fantastic, somehow 24" inch screen seem soon too small, I wonder if you got it correct with your 43" screen.
-
you were correct, I seem to have stopped the dockers in the incorrect order, when I used your order the values now have populated with all the drives. thanks again for the great assistance, much appreciated.
-
you were correct, somehow the uncomment to attributes was back to having a #, I have removed it and now I have more information but it is still only showing the information for 2 drives not all 17. in the docker i have this line /bin/sh -c 'apk update && apk upgrade && apk add ipmitool && apk add smartmontools && apk add lm_sensors && telegraf'

-
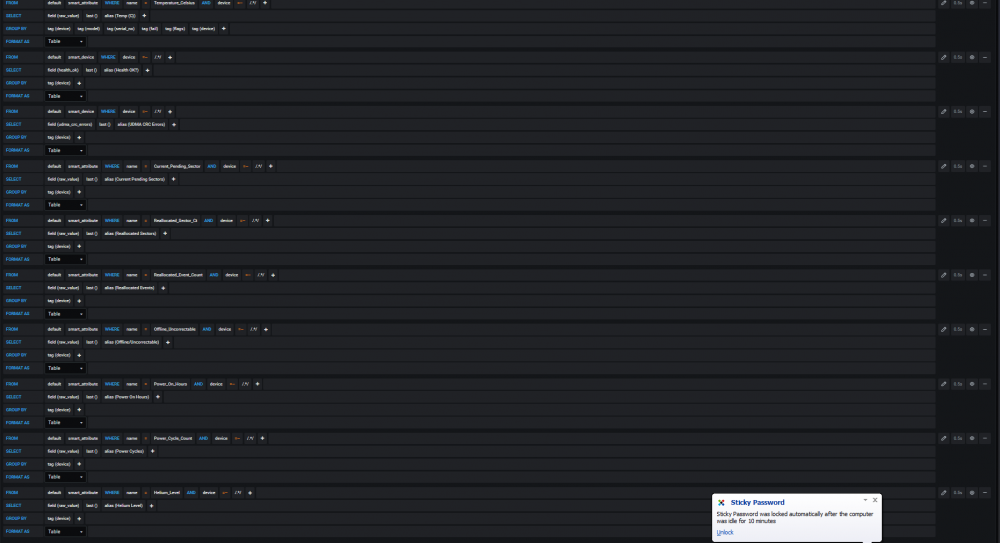
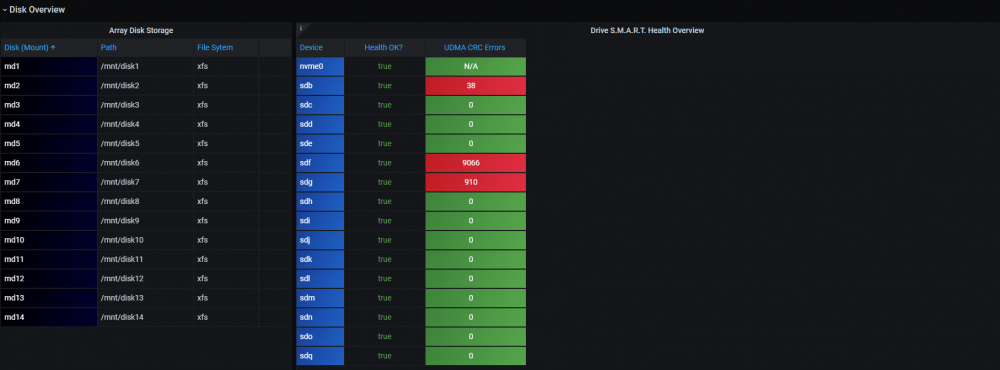
something is strange. I have 17 drives in the system 2 parity, 1 cache and 14 data drives but my table does not list them all and I don't have all the headers you are showing in your table, how is this possible?

-
Hi thanks for the reply, I am using a AMD motherboard and the temp is shown in unraid itself. It is a Asrock B450 motherboard with 2600 amd processor. Here is the explore screen you requested
-
I followed these steps and updated the advanced settings of the telegraf docker and restarted all 3 docker containers but the cpu temps and other sensors are still not shown, I have also run the apk add lm_sensors and that seems to also have worked. How quickly am I meant to see any output in Grafana? Also my smart dics heath output does not look like the sample screenshots, is there something I need to still change?
-
how should I change this or should I now just leave it alone?
-
Yes I have a NVME cache drive, I have selected the drives at the top of the grafana for cache/array/parity.
-
I manually edited them all to /mnt/user as on my array I don't see that directory with 6.8.3
-
I have 14 array drives and 2 parity drives.
-
I found the reason for the no data as it was pointing to /mnt/user0 which is not present on my system, mine is all /mnt/user so changed that and now it shows the total sizes and growth.
-
here is the pastebin for the telegraf.conf https://pastebin.com/pLFzYB5Y
-
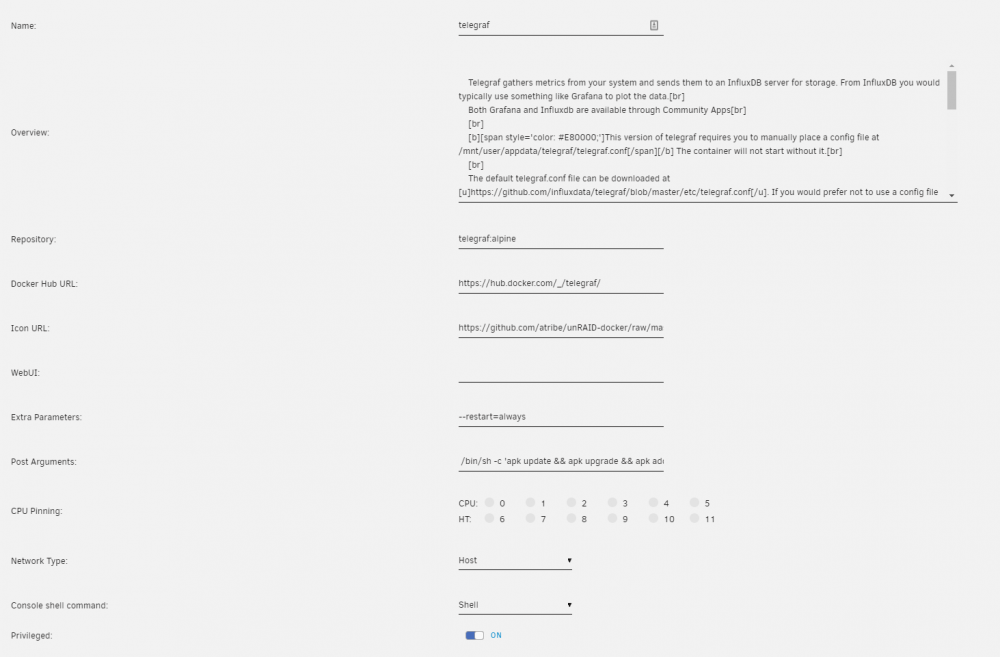
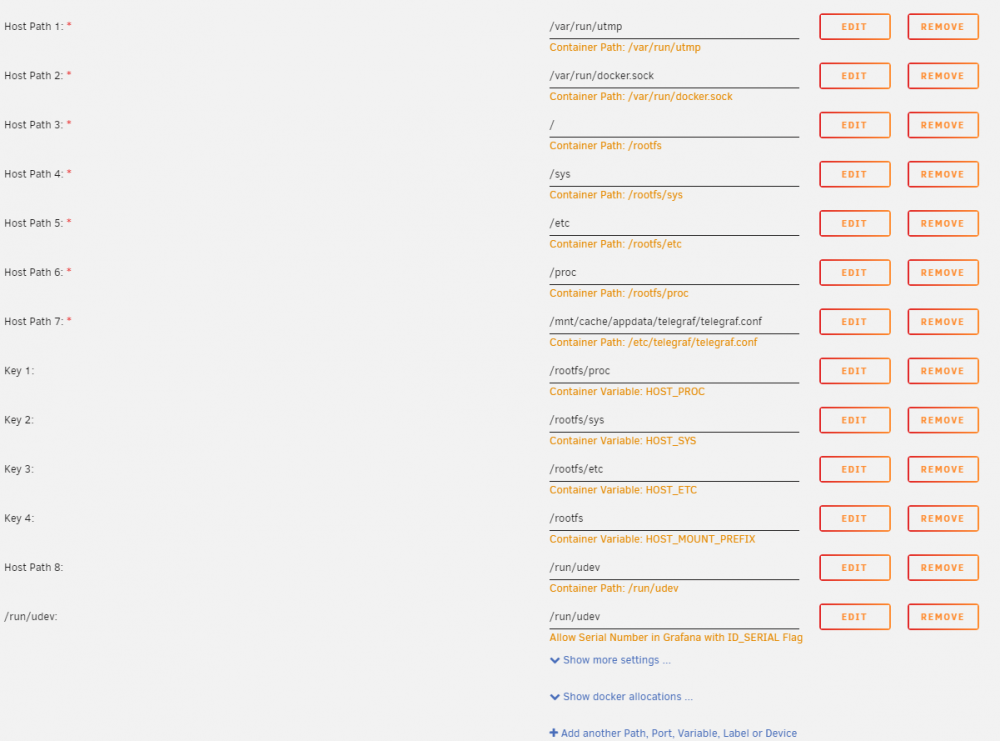
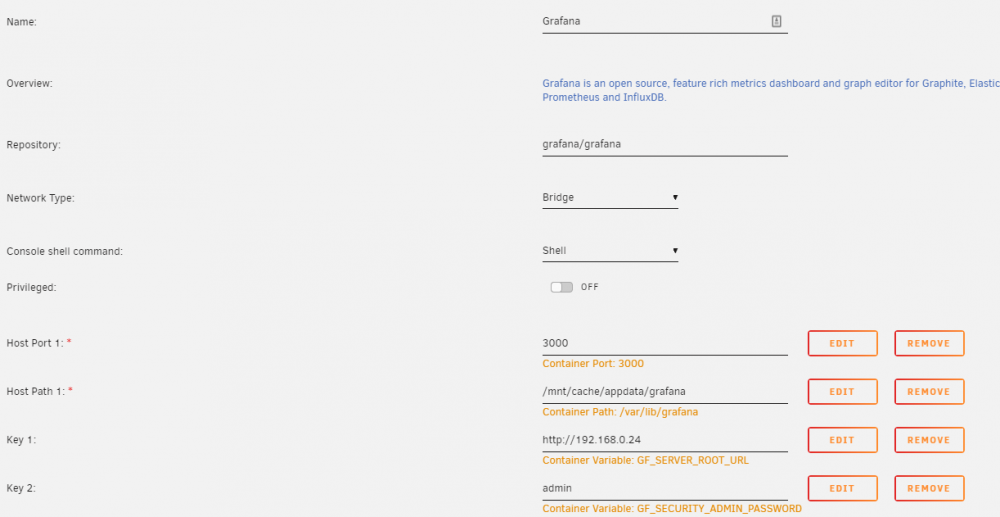
Thanks again GilbN for the assistance, I found the conf file for telegraf but I am not sure where the conf file for grafana is stored as it is not under appdata/grafana telegraf.zip
-
sorry the docker configuration or the conf files for both?




