geonerdist
Members
-
Joined
-
Last visited
Everything posted by geonerdist
-
That's sort of what I was guessing, just surprised that I have not seen this warning until recently. Just sort of started happening.
-
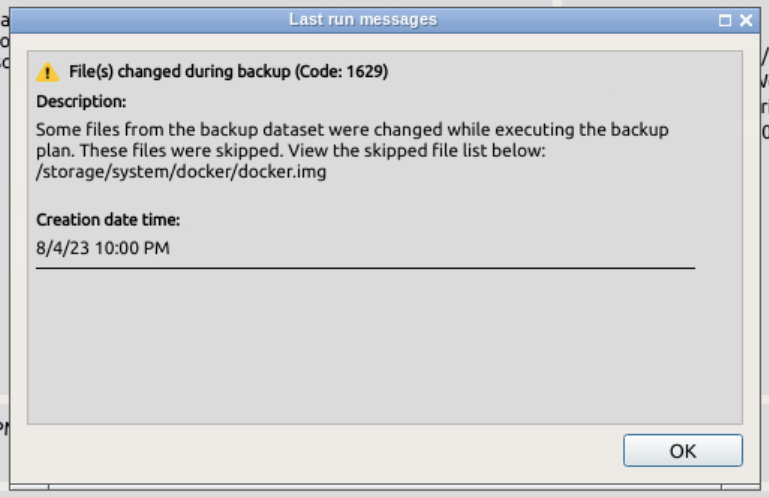
I've recently started experiencing the following error. Does anyone know if this is a Cloudberry or Unraid issue? I have done a bit of Googling but cannot seem to find a resolution for this.
-
Windows is still running check disk on my new drive. I've got the old drive plugged in to a USB 2.0 port and ran several short SMART tests in unraid (this would cause UD to hang before) without issues and currently running my backup. Must be a USB 3.0 thing. Anyways thanks again!
-
Sounds like a plan. Thanks.
-
This and the last one were external USB disks. Last one was from Seagate and this one is from WD. I'm beginning to think maybe it's not the disks or cables (using different cables this time too). What are the chances it could be the USB ports? I was going to try one of my front USB ports on my server when I have some time later.
-
well isn't that some luck! probably explains why the Windows check disk I ran over night was stuck on 6% this morning. Thanks!
-
Well Unassigned Devices seems to have hung again. We previously thought that my external drive that is my local backup of the server was causing it to hang because of disk errors. Tonight I attached a new disk that passed a smart test and it looks like the whole thing is about to hang again. One core is maxing out and it's moving around until everything is locked up. tower-diagnostics-20200311-1750.zip
-
Well now the saga continues. I unmounted the disk and remembered it was plugged in with a USB extension. Got rid of that and plugged it directly in to the server. Tried both USB3.0 ports (and a USB 2.0 after downloading the attached diagnostics) and am unable to mount and it throws warnings in the log. I'm going to plug it in to my windows machine and see what happens. tower-diagnostics-20191215-0350.zip
-
It is one of these.
-
Thanks for making the clarification. Potentially there could be some issues with the drive enclosure and not the drive itself, previously there were smart errors. So now I’m confused. @dlandonand @Squid is there anything else I can do to help troubleshoot this? I’m considering tuning another full smart scan on this drive again and try to get diagnostics via terminal.
-
I managed to get UD to hang, tried downloading diagnostics before I rebooted but it would never download the zip file. Previously errors were found on my seagate external drive that seemed to be the culprit and I am just hoping we can confirm that the drive is indeed bad and I need to get rid of it. I started to do a full smart scan of that drive yesterday and let it run. This morning UD was hung up. So I think that's probably the issue but wanted to be sure. tower-diagnostics-20191213-1658.zip
-
Thanks! I updated UD and have not seen it hang yet.
-
Good catch, thanks....better brush up on my smart report skills. Would it matter if I pulled the diagnostics after I had rebooted and uninstalled -UD? I'm going to see if it'll hang again and get diagnostics downloaded before it becomes completely unresponsive. Thanks again!
-
Thought I attached it to my original response. tower-diagnostics-20191127-2342.zip
-
@mustava Did you ever find out what was the issue? I was running 6.5.3 for a long time and every time I tried to upgrade this would happen. I started with a new USB device to see if that was the issue and this started again but I was able to catch some signs that it was UD. I didn't see any replies or solutions to this. I have since uninstalled UD.
-
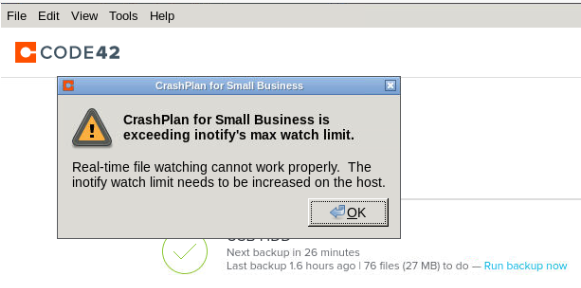
I did a quick search of the forum for this, has any one had this occur? I don't see an advanced parameter that can be updated like the memory allocation one. For searching purposes, "CrashPlan for Small Business is exceeding inotify's max watch limit." and "Real-time file watching cannot work properly. The inotify watch limit needs to be increased on the host."
-
I updated the docker without any issues today, just had to sign it and away it went. The new interface is terrible...but so far it's working.
-
Agreed, thanks to all those that have contributed to this. I suppose we shall just have to see how it unfolds.
-
You beat me....well guess I better start reviewing my options again to move cloud backup solutions. I feel like I just did this recently but decided to stick with CrashPlan...that was a mistake.
-
Thanks for checking. My smb-extra.cfg is empty. I cannot seem to locate smb.cfg anywhere under /boot.
-
Any luck? If not is there any else I can get back to you with to help troubleshoot? I have been doing research and it doesn't sound like Windows hides files that begin with a period. It's a Unix/Linux thing...
-
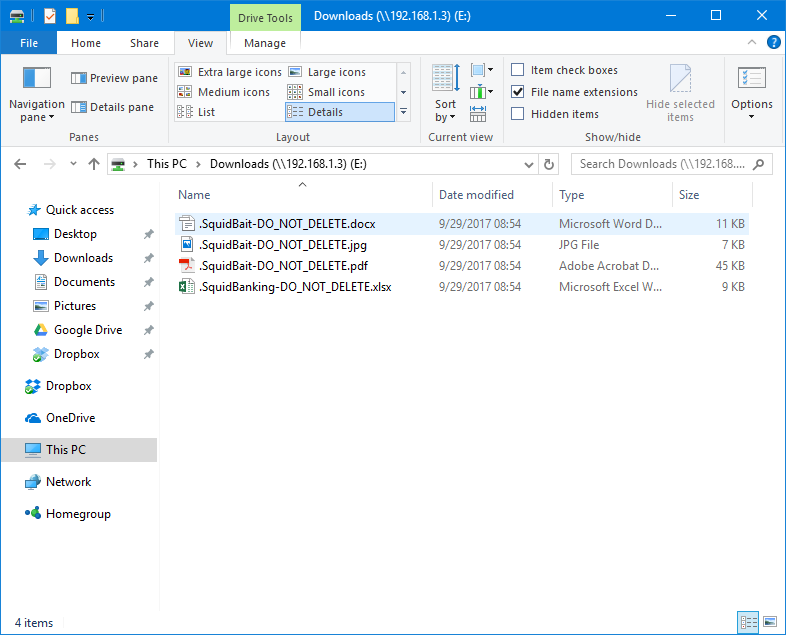
Hmm, any ideas why I still see the bait files when browsing my shares then? I did forget to say that I did select to hide the bait files when I setup the plugin too. I'm also on the current version of unRAID and the plugin.
-
When I first enabled your plugin, I did not realize I had that SMB setting disabled. I'm only running bait files at the root of all my shares. After disabling the plugin and deleting bait files, I stopped the array, turn on hide dot files in SMB settings and re-enabled the plugin. Those bait files are still visible and show hidden files in Windows explorer is not checked. When You say, " Due to a technical problem, the 4 base bait files in the root folder of each bait share cannot at this time be hidden." does that mean all shares or just the bait share created by the plugin? Thanks much!
-
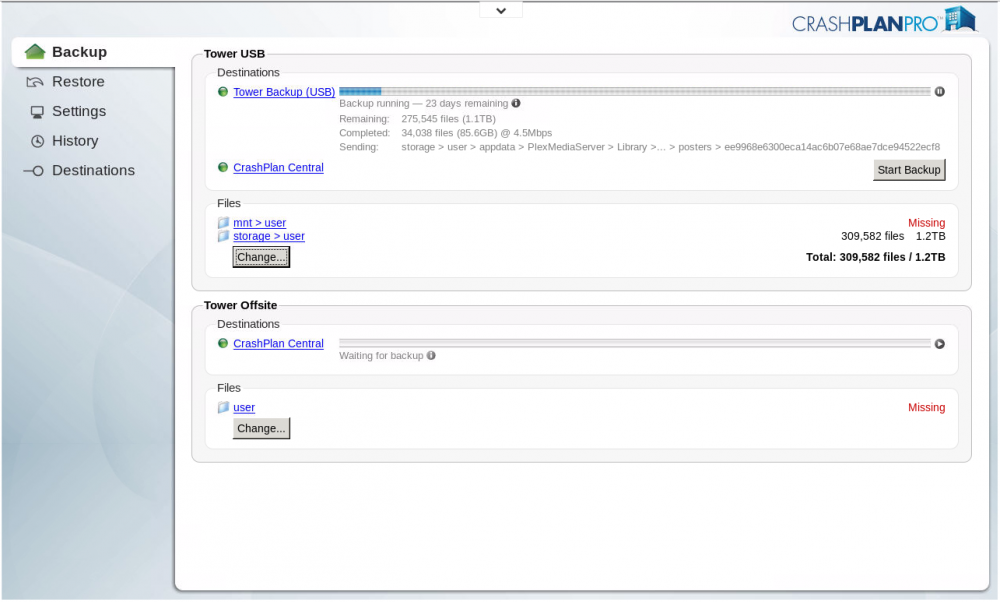
Wanted to let you all know of my results. It did not back up everything again. The used space on my USB HD is still the same. The backup to the cloud completed at some point today. I updated my paths either last night or this morning (I can't remember for sure) and it is done...so it did not attempt to re-upload 1.2TB. Great work on this, much appreciated! EDIT: @Djoss, completely missed your comment when I posted this. Thanks for the reply. It all worked wonderfully. Just kind of caught me off guard when it looked like it was backing up everything again. I have only been using crashplan for a few months now. Anyways thanks a ton.
-
Thank you for providing this docker so quickly. I followed the instructions you provided to migrate my account to Pro. I migrated via CrashPlan's website. Made sure my backups were up to date and stopped the gfjardim docker. I installed your docker and added another path variable to bring in my unassigned device for local backups, I realize now I could have just changed how I mapped storage as you will see in my screenshot. After logging in to CrashPlan Pro I followed the migration steps and both backup sets went through a pretty time consuming synchronization process. I have two back up sets one with the destination set to an external hard drive and another to CrashPlan Central. This way I can pick and choose which shares to only back up locally and which to also send to the cloud. It seems as though after updating the path and starting the backup it is backing up everything all over. I'm holding off on changing my Central backup until I know for sure. I have been watching the used space on that drive via the Unassigned Devices plugin, and it does not seem to be changing, but only time will tell. Is this the de-duping process or is it just looking to make sure that everything that is in the source also in the backup destination? Cheers!