Stroker
Members
-
Joined
-
Last visited
Everything posted by Stroker
-
Thanks for the Info. Sadly appdata is already excluded and the Problems persists on my Side. I will try to fiddle around with the depth a bit. Currently the Plugin is disabled but I had a little more time to investigate the Problem. I will post Updated Logs and my new findings.
-
jh1987 does your Docker log say anything after the successfull deployment of this above Repository config?
-
Sorry this Post will not be a lot of help @cheesemarathon but I expierienced also problems after the last update and wanted to notify persons here over my expierience. I noticed it just today because the WebGUI didn't came up but i didn't change anything on the Container for weeks. I got a "Connection Refused" on the GUI and I got curious. After that i had done a "netstat -tulpn" on the unraid server itself and nothing showed up. Bot no Errors in the Docker log. But a deletion from GUI (with active "also remove image"), a "rm -rf openvpn-as" from the Appdata over the console and reinstall of the Template from the WebGUI worked. I just had no internal config of the Container anymore. @aptalca On my Side it works with the Setup "eth0" on INTERFACE and also HOST Networking as Containerconfig Edit: But this didn't happend with my 2nd Server where the exact same configuration is running... Strange...
-
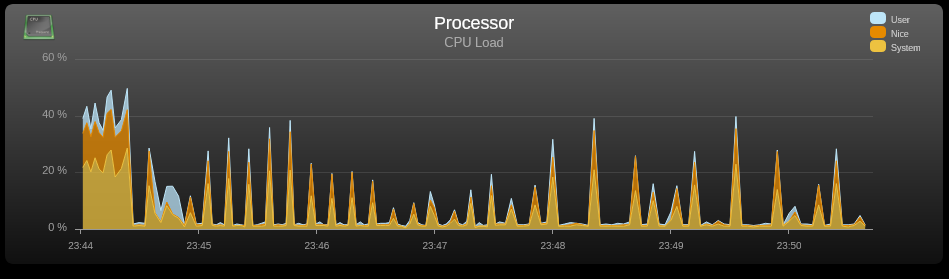
Hey Guys and Girls! for a few Weeks a got a very strange Problem as drescribed in the post here with Screenshots and my diagnostics file. To put it short I get consistent CPU spikes as high as 25 to 40 or nearly 50 % with activated Folder Caching, They appear as often as the setting "Maximum interval between folder scans (sec):" is selected. What was not discribed in the last post was the log of the Plugin itself at /var/log/cache_dirs.log . I have attached this as txt file to this Post and also a fresh Screenshot of the graph in the Statistics Plugin. This is with all settings at default and excluded all Backup or Cache Folders. In this it logs like 5-14% CPU Usage but in the Statistics Plugin I get much higher CPU Use as seen in the referenced Post or the Screenshot. With the unlimited deph I get nearly 122k files. The same Usage and nearly the same Spikes appear when the depth is fixed at 5 with arround 59k files. Should this usage be this much with a i3-3240? Shoudn't it scale accross the load of files? or are this Spikes anormal? Bonienl in the linked post said that he couldn't explain this spikes to himself either but sadly had no idea how to proceed. Does anyone here have any idea how I could troubleshoot this problem further? Best Regards Stroker folder_caching_logs.txt