


insomniak
Members
-
Joined
-
Last visited
Everything posted by insomniak
-
Been having more lockups as of late that requires a hard reset. It was about once a week for the past month and now in the past two days, had one a day. Syslogs attached pulled after each crash and shortened to show the time frame of when it occurred. Also attached diagnostics. Not quite sure what's going on so any help would be appreciated. syslog-192.168.164.2.log syslog-192.168.164.2-2.log afterdark-diagnostics-20230717-1530.zip
-
The NIC is the onboard motherboard one so I'll try to disable I'll give that a try this evening once I'm home. In the mean time, further down in the logs starting at 7:44:01, I had tried to mount the NVME again after a server reboot and it didn't note the same type of log display about the NIC. Main thing I saw was CPU 10 stalls so not sure if that plays into it at all either. Nov 30 07:44:01 afterdark kernel: BTRFS info (device nvme1n1p1): start tree-log replay Nov 30 07:44:12 afterdark flash_backup: adding task: /usr/local/emhttp/plugins/dynamix.my.servers/scripts/UpdateFlashBackup update Nov 30 07:44:30 afterdark kernel: rcu: INFO: rcu_preempt detected expedited stalls on CPUs/tasks: { 10-... } 21156 jiffies s: 3181 root: 0x1/. Nov 30 07:44:30 afterdark kernel: rcu: blocking rcu_node structures (internal RCU debug): l=1:0-15:0x400/. Nov 30 07:44:30 afterdark kernel: Task dump for CPU 10: Nov 30 07:44:30 afterdark kernel: task:kworker/u64:4 state:R running task stack: 0 pid:12618 ppid: 2 flags:0x00004008 Nov 30 07:44:30 afterdark kernel: Workqueue: btrfs-cache btrfs_work_helper Nov 30 07:44:30 afterdark kernel: Call Trace: Nov 30 07:44:30 afterdark kernel: <TASK> Nov 30 07:44:30 afterdark kernel: ? __schedule+0x59e/0x5f6 Nov 30 07:44:30 afterdark kernel: ? _raw_spin_unlock+0x14/0x29 Nov 30 07:44:30 afterdark kernel: ? chksum_update+0x13/0x1e Nov 30 07:44:30 afterdark kernel: ? crc32c+0x2f/0x62 Nov 30 07:44:30 afterdark kernel: ? folio_wait_bit_common+0x1ce/0x241 Nov 30 07:44:30 afterdark kernel: ? ___slab_alloc+0x288/0x590 Nov 30 07:44:30 afterdark kernel: ? __load_free_space_cache+0x215/0x452 Nov 30 07:44:30 afterdark kernel: ? folio_mkclean+0x5c/0xa1 Nov 30 07:44:30 afterdark kernel: ? page_vma_mkclean_one.constprop.0+0x138/0x138 Nov 30 07:44:30 afterdark kernel: ? virt_to_slab+0x5/0x19 Nov 30 07:44:30 afterdark kernel: ? memcg_slab_free_hook+0x4b/0xf9 Nov 30 07:44:30 afterdark kernel: ? sysvec_apic_timer_interrupt+0x92/0xa6 Nov 30 07:44:30 afterdark kernel: ? asm_sysvec_apic_timer_interrupt+0x16/0x20 Nov 30 07:44:30 afterdark kernel: ? native_queued_spin_lock_slowpath+0x81/0x1d0 Nov 30 07:44:30 afterdark kernel: ? do_raw_spin_lock+0x14/0x1a Nov 30 07:44:30 afterdark kernel: ? __btrfs_remove_free_space_cache+0xe/0x2d Nov 30 07:44:30 afterdark kernel: ? load_free_space_cache+0x230/0x2dd Nov 30 07:44:30 afterdark kernel: ? caching_thread+0x7e/0x43d Nov 30 07:44:30 afterdark kernel: ? move_linked_works+0x2f/0x6a Nov 30 07:44:30 afterdark kernel: ? pwq_adjust_max_active+0x88/0xa7 Nov 30 07:44:30 afterdark kernel: ? btrfs_work_helper+0x114/0x2a5 Nov 30 07:44:30 afterdark kernel: ? process_one_work+0x1ab/0x295 Nov 30 07:44:30 afterdark kernel: ? worker_thread+0x18b/0x244 Nov 30 07:44:30 afterdark kernel: ? rescuer_thread+0x281/0x281 Nov 30 07:44:30 afterdark kernel: ? kthread+0xe7/0xef Nov 30 07:44:30 afterdark kernel: ? kthread_complete_and_exit+0x1b/0x1b Nov 30 07:44:30 afterdark kernel: ? ret_from_fork+0x22/0x30 Nov 30 07:44:30 afterdark kernel: </TASK> Nov 30 07:45:02 afterdark kernel: rcu: INFO: rcu_preempt self-detected stall on CPU Nov 30 07:45:02 afterdark kernel: rcu: #01110-....: (60000 ticks this GP) idle=b59/1/0x4000000000000000 softirq=52533/52533 fqs=12875 Nov 30 07:45:02 afterdark kernel: #011(t=60001 jiffies g=89909 q=938305 ncpus=32) Nov 30 07:45:02 afterdark kernel: NMI backtrace for cpu 10
-
I attached the syslog. After checking, the device is still nvme1n1. I'll try the suggestion above if that's the case but hoping the syslog shows something too. syslog-192.168.164.2.log
-
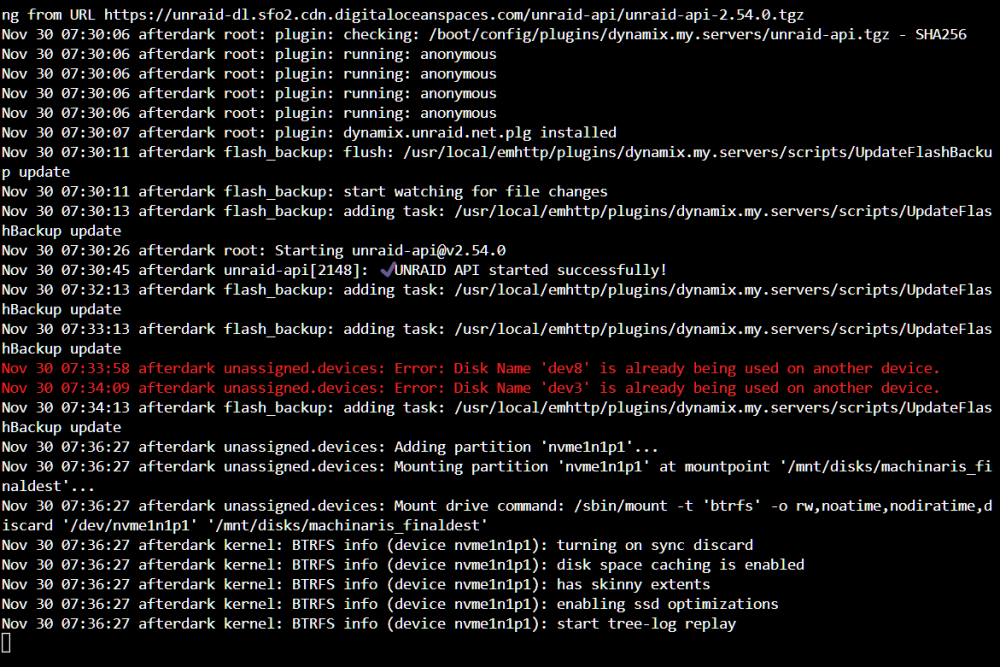
Having an issue where the whole server times out and becomes unresponsive. Narrowed it down to Unassigned Devices since I uninstalled all plugins and reinstalled one at a time. When UD is installed and disks are not mounted yet everything is ok. However when I go to mount a drive, the UI is stuck in "mounting" on that one drive i initiated and the server becomes unresponsive. Cannot SSH in either. I had logs opened and was able to capture the last screenshot. I notice it says that "dev8" and "dev3" are being used so theirs duplicates in UD section. However after I rebooted, there were no more duplicate ID's and trying to mount the drive still lead to the same unresponsiveness. I've attached diagnostics for reference too. This only started happening in the past week so any help is appreciated. afterdark-diagnostics-20221130-0734.zip
-
Had a power outage last night and woke up to the server off. After booting back up, it was going through it's normal parity check, but I'm it then seems to hang after a few minutes. GUI then is unresponsive and trying to login as root via the command line is not possible. Error is that it times out. I've removed all attached USB drives to boot only the array and still nothing. I was able to boot into Safe Mode to run a diagnostics on it which is attached. I don't know if the USB drive failed and if I need to transfer to a new one or not. EDIT: I tried swapping to a new USB drive and was able to boot up fine. However when I go to view the docker tab or docker settings, it becomes unresponsive again so I believe it has to do with dockers. I can navigate the rest of Unraid just fine when the array is not started. afterdark-diagnostics-20221126-1435.zip
-
I just realized the internet connect for Unraid is lost after I tried going to the APPS tab which says "Download of appfeed failed". I'm able to ping all local addresses on the network just fine but cannot reach any external IP addresses. I restarted the server thinking something got hung up but the same issue. I've tried changing DNS to 8.8.8.8 and 1.1.1.1 and none of that works either. Also tried IPv4 only network protocol and changing the address assignment from static to dynamic and still no luck. At a loss as to where to go from here. Diagnostics are attached. Any help is appreciated. afterdark-diagnostics-20221005-1535.zip
-
Had the server seemingly crash overnight. Inadvertently, it locked up all of the devices that were connected to the switch it was on. Desktop PC and Raspberry Pi were not able to connect to the internet. But my network's wifi was working fine. I unplugged the server from the switch and all traffic resumed immediately so not sure if it was an issue with DNS somewhere on the server during the crash. I've attached diagnostics for reference if anyone could help that would be greatly appreciated. afterdark-diagnostics-20220916-1107.zip
-
Hi, I received an MCE Error and posting diagnostics here for some help. afterdark-diagnostics-20220829-1127.zip
-
I saw an MCE log warning and wanted to post my diagnostics here. I didn't have mcelog enabled in Nerd Pack so I enabled it just now but figure I'd post the diagnostis first in case there is anything there. afterdark-diagnostics-20220530-0947.zip
-
Awesome thanks for that suggestion. Found the container that was doing that.
-
In my log there are certain errors that seem to repeat through a loop and I'm not sure what it means. I've attached diagnostics for reference. It mentions a docker0: port # entering blocking states and being disabled. Also has something with eth0 renaming itself and IPv6 addresses. I don't have IPv6 enabled but whenever I access unraid on my local network, instead of my local ipv4 address of 192.168.#.#, it's an ipv6 address instead. What do the log errors relate to? afterdark-diagnostics-20220526-1328.zip
-
Ok, hopefully this freeze up was just random and at least I now have syslog server running in case that'll help diagnose anything else later. Thanks again for your help and I'll leave it as is for now.
-
You might be referring to my other post that you helped me on too. Overtime, if the log filled up to 100% would that cause the GUI to freeze like it did overnight? I'm on a Gigabyte GA-7PESH board. I can look in the BIOS but not quite sure where I would start to find the issue. Any guidance is appreciated.
-
I have a HP 468405-002 SAS Expander so it would be this controller right? If it's starting to die or be an issue, is there another way to test to make sure it is? All of my HDD on the array go through here. Caches are nvme drives which are an ASUS Hyper M.2 via PCI.
-
I woke up to find that the GUI was locked up and not able to access it. None of my dockers were accessible either. I was able to access the disks and shares directly from the machine but it seemed much slower than normal. Ended up having to reboot the server and things seem to be normal now except for the log is starting to fill up quickly. Just found out about syslog server and unfortunately it was not enabled before the reboot. I have that running now in case it happens again. I've attached diagnostics and hopefully this would help pin point what may have caused it. afterdark-diagnostics-20220517-0936.zip
-
I'm going to upgrade my cache drive so i've set all my shares to CACHE:YES and invoked the mover. It took awhile, especially the appdata folder, and now there is about 5GB left in my cache that won't completely move over. I also have about 10GB in my cache_downloads which i used for temp media storage. I had the Mover Tuning Plugin installed, so I removed that and rebooted and tried to invoke the mover again but it's still not fully moving the files off the cache to the array. I read that split level could be bogging it up and I made sure to change them all to split at any level but that didn't help. Any ideas as to why mover isn't touching the left over files on the cache? Diagnostics are attached. EDIT: The last shares that aren't moving that are stuck on the cache drives are appdata and system (cache) and data (cache_download) afterdark-diagnostics-20220510-1528.zip
-
Weird, the mother board is a Gigabyte GA-7PESH2 and it only has the two SATA ports which are being used. I tried unplugging ata1 since it's not being used right now and now it booted up fine without errors which is weird.
-
I had thought that these were the drives correlated to the error but maybe I'm wrong. [9:0:3:0] disk ATA WDC WD100EZAZ-11 0A83 /dev/sdq /dev/sg17 state=running queue_depth=32 scsi_level=7 type=0 device_blocked=0 timeout=30 dir: /sys/bus/scsi/devices/9:0:3:0 [/sys/devices/pci0000:00/0000:00:01.1/0000:02:00.0/host9/port-9:0/expander-9:0/port-9:0:3/end_device-9:0:3/target9:0:3/9:0:3:0] [9:0:4:0] disk ATA WDC WD100EMAZ-00 0A83 /dev/sdr /dev/sg18 state=running queue_depth=32 scsi_level=7 type=0 device_blocked=0 timeout=30 dir: /sys/bus/scsi/devices/9:0:4:0 [/sys/devices/pci0000:00/0000:00:01.1/0000:02:00.0/host9/port-9:0/expander-9:0/port-9:0:4/end_device-9:0:4/target9:0:4/9:0:4:0] [9:0:5:0] disk ATA WDC WD100EMAZ-00 0A83 /dev/sds /dev/sg19 state=running queue_depth=32 scsi_level=7 type=0 device_blocked=0 timeout=30 dir: /sys/bus/scsi/devices/9:0:5:0 [/sys/devices/pci0000:00/0000:00:01.1/0000:02:00.0/host9/port-9:0/expander-9:0/port-9:0:5/end_device-9:0:5/target9:0:5/9:0:5:0] [9:0:6:0] disk ATA WDC WD161KRYZ-01 1H01 /dev/sdt /dev/sg20 state=running queue_depth=32 scsi_level=7 type=0 device_blocked=0 timeout=30 dir: /sys/bus/scsi/devices/9:0:6:0 [/sys/devices/pci0000:00/0000:00:01.1/0000:02:00.0/host9/port-9:0/expander-9:0/port-9:0:6/end_device-9:0:6/target9:0:6/9:0:6:0] Another thing I wanted to note is that mover is going really slow at around 25 - 50 KB/s. Not sure how that would be related or not. I only noticed this because i was going to change out my cache drive and saw that it was getting pretty full so I set the appdata share to CACHE:YES and invoked the mover. I had about 22GB on it since yesterday and it's still got 17GB left after letting it run overnight.
-
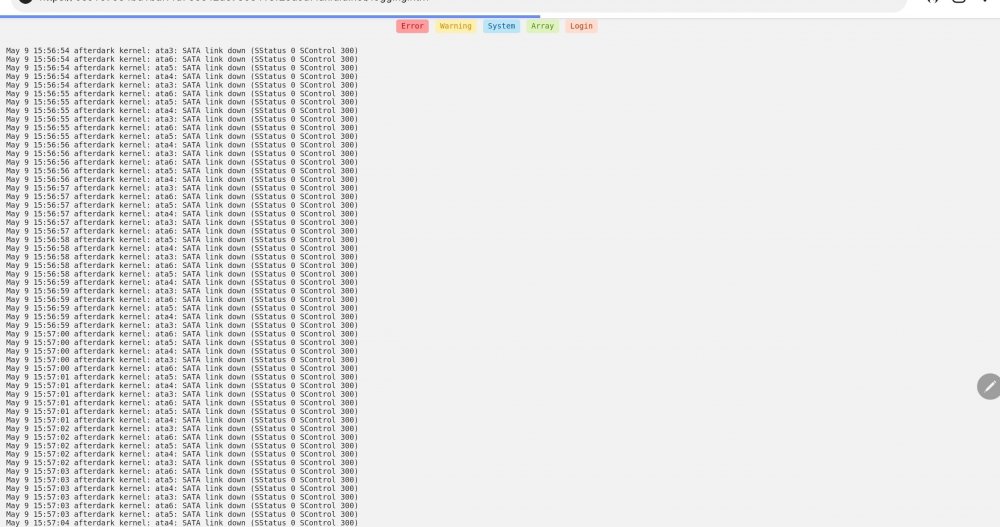
I recently saw my logs start to fill up and see that i'm having a repeated "SATA Link Down" error (pic attached). They cycle through for ata3, ata4, ata5, and ata6. I have my hard drives attached to a SAS expander and I re-seated all SAS to SATA cables on both the expander side and hard drive sides and still get the errors. I have 3 cables total splitting out to 9 drives. First I thought it was a bad cable, that might be connected to the four drives. I checked and each of the errored drives are on different cables. ata 3 is on one cable, ata 4 is on a different cable and ata 5 and 6 are both on the third cable. I thought it could be the PCI slot and so tried a different one but still receiving an error. I had other PCI adapters which I removed thinking that I was taking up too many lanes but that didn't fix it. I'm still able to access all of my disks just fine through CLI and nothing is being emulated. Could the SAS expander be going bad? I'm not too sure what else to check. afterdark-diagnostics-20220509-1603.zip
-
I was in the process of changing out my cache drive so i set all shares to Cache:Yes and invoked the mover to get all shares (e.g. appdata) off of the cache. The server went through the weekly backup and I had to reboot the server and I feel like this messed it up because now all of my docker images are missing. https://imgur.com/a/jLrbpu6 If I try to reinstall from Apps -> Previous Apps, it fails since it says it's already in use by container "containerID#". Should I remove the containers that have the "Lime" icon that's currently on my docker page right now since none of them are working? I don't want to remove them if there's a way to recover them a different way. I've attached my diagnostics for help too. afterdark-diagnostics-20220509-0837.zip
-
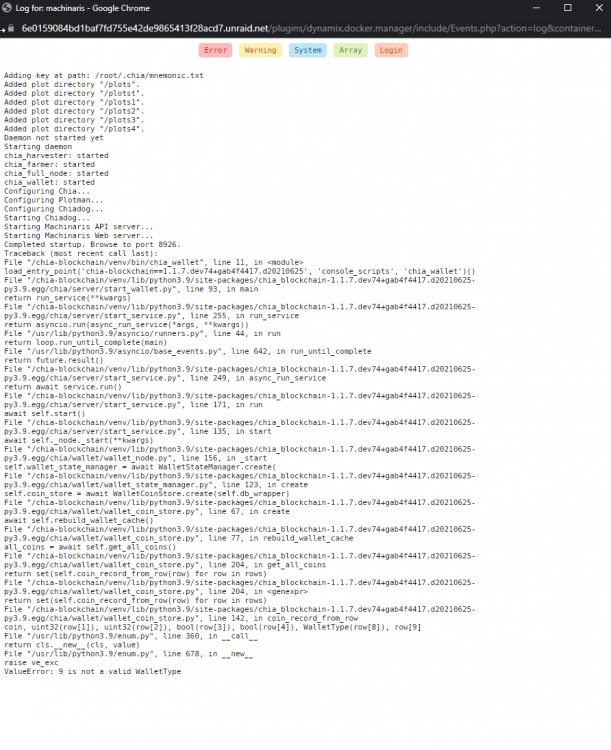
Followed the guide to update and removed all Flax port definitions but am still running into the internal server error. Internal Server Error The server encountered an internal error and was unable to complete your request. Either the server is overloaded or there is an error in the application. In the logs, I'm seeing the following error: ValueError: 9 is not a valid WalletType EDIT: For some reason it fixed itself overnight and starting at 12am it started farming again. WebUI is fine and just successfully installed all of your other forks.
-
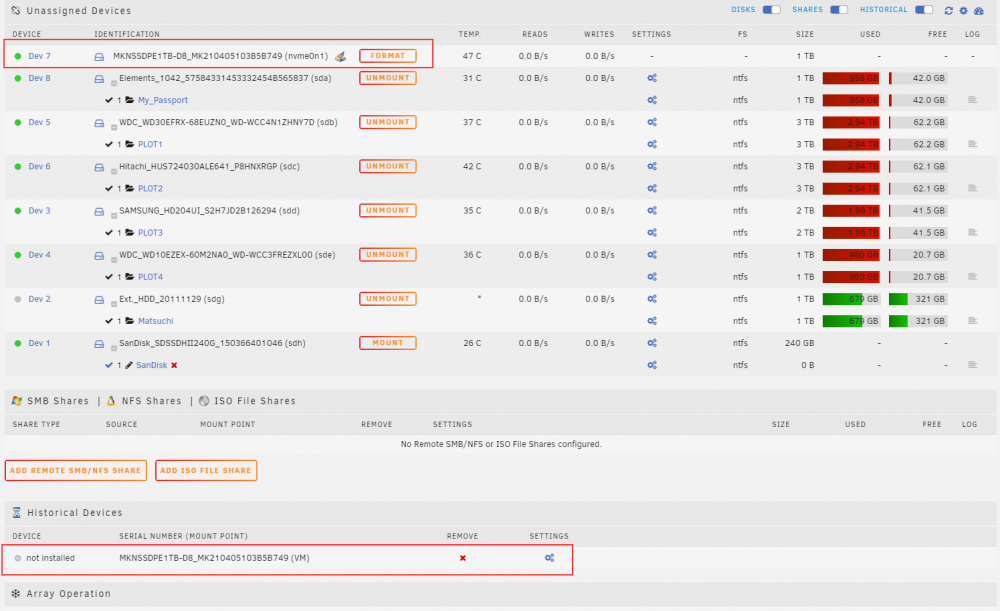
I rebooted the server and one of my Unassigned NVME drives that I used to house a VM is not mounting. Under Historical Devices, the same drive is listed however the Mount Point seems to be different. I don't recall how it was previously but currently the Historical Devices mount point was "VM" and the current one is "nvme0n1". Right now there's only an option to Format or Preclear the drive. I'm not quite sure how to change the mount point or to have it read that drive again.
-
I rebooted the server and one of my Unassigned NVME drives that I used to house a VM is not mounting. Under Historical Devices, the same drive is listed however the Mount Point seems to be different. I don't recall how it was previously but currently the Historical Devices mount point was "VM" and the current one is "nvme0n1". Right now there's only an option to Format or Preclear the drive. I'm not quite sure how to change the mount point or to have it read that drive again.

-
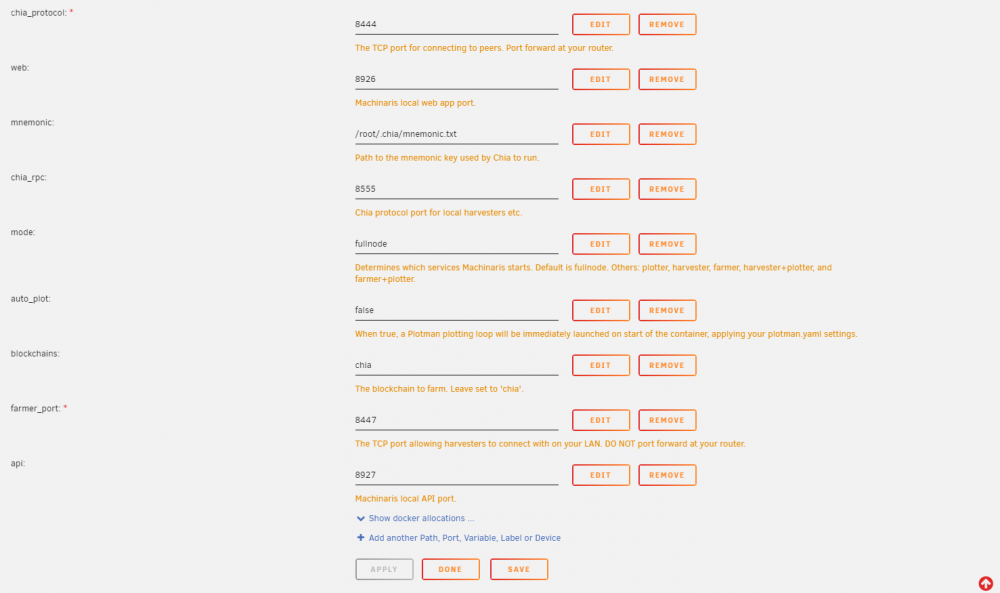
I'm running the TEST version and was able to join a pool successfully. I couldn't find the "-c" flag for the Pool Contract Address in the plotting config. Only see space for the farmer key and pool key. In the development branch on Github, i found a sample config that has the Pool Contract Address field. Can I just add this line to my current config? Then do i just uncomment the "farmer_pk:" and "pool_contract_address:" lines and leave the "pool_pk:" commented since we don't need that?
-
So my weekly appdata backup ran and unfortunately Machinaris still got caught in it and the docker restarted. Selecting "No" on "Update Applications on Restart" within the Backup/Restore Appdata Plugin didn't seem to help.


