





PrisonMike
Members
-
Joined
-
Last visited
Everything posted by PrisonMike
-
Thanks! I followed the guide and reset the errors. FYI, before I reset the errors the output was: root@Tower:~# btrfs dev stats /mnt/cache [/dev/sdg1].write_io_errs 14579960 [/dev/sdg1].read_io_errs 10433665 [/dev/sdg1].flush_io_errs 48340 [/dev/sdg1].corruption_errs 1151794 [/dev/sdg1].generation_errs 0 [/dev/sdf1].write_io_errs 23172219 [/dev/sdf1].read_io_errs 57409 [/dev/sdf1].flush_io_errs 546115 [/dev/sdf1].corruption_errs 3 [/dev/sdf1].generation_errs 0 Side note, should I be scrubbing or balancing on some kind of schedule? This is the first time since using unraid (4-5 years) I ran into this problem. Thanks again!
-
Hello, I was able to restart the array and both drives mounted Scrub returned the following: UUID: f77815f4-da02-4c6a-a168-4f1d83b1ce1c Scrub started: Sun Jul 28 06:59:39 2024 Status: finished Duration: 0:07:51 Total to scrub: 409.95GiB Rate: 891.28MiB/s Error summary: no errors found
-
My mistake, I couldn't remember to get them before or after array start. I attached them to this post. Thanks! tower-diagnostics-20240727-1628.zip
-
*Update*: After posting the diagnostics I started the array and now the cache disks are saying "Unmountable: Unsupported or no file system"
-
Hello, I am looking for some help with my docker containers. I recently had some issues with my docker containers and decided to delete the image. After I deleted the image, some of the containers start and some done. If I manually start them, I get an error 403. I did some searching and I think it may have something to do with logs somehow but not too sure. I have attached my diagnostics. Thanks in advance. tower-diagnostics-20240727-1026.zip
-
Thanks so much for your assistance! This worked after I restarted, everything appears to be working normal now!
-
Hello, here is the result: root@Tower:~# gdisk /dev/sdb GPT fdisk (gdisk) version 1.0.9.1 Caution: invalid main GPT header, but valid backup; regenerating main header from backup! Warning: Invalid CRC on main header data; loaded backup partition table. Warning! One or more CRCs don't match. You should repair the disk! Main header: ERROR Backup header: OK Main partition table: OK Backup partition table: OK Partition table scan: MBR: protective BSD: not present APM: not present GPT: damaged **************************************************************************** Caution: Found protective or hybrid MBR and corrupt GPT. Using GPT, but disk verification and recovery are STRONGLY recommended. **************************************************************************** Command (? for help): Should I repair the GPT table? How is this conducted. Thanks!
-
Hello, it is still sdb. Please see the outputs below /dev/sdb: PTUUID="1616b127-e5f5-4f58-a5ac-0ee54460088b" PTTYPE="gpt" and The primary GPT table is corrupt, but the backup appears OK, so that will be used. Disk /dev/sdb: 3.64 TiB, 4000787030016 bytes, 7814037168 sectors Disk model: WDC WD40EFRX-68N Units: sectors of 1 * 512 = 512 bytes Sector size (logical/physical): 512 bytes / 4096 bytes I/O size (minimum/optimal): 4096 bytes / 4096 bytes Disklabel type: gpt Disk identifier: 1616B127-E5F5-4F58-A5AC-0EE54460088B Device Start End Sectors Size Type /dev/sdb1 64 7814037134 7814037071 3.6T Linux filesystem Thanks again
-
My apologies, I didn't realize that I had to do them after the array started. I have attached the new diagnostics for your review. Thanks again in advance. tower-diagnostics-20240711-0757.zip
-
JorgeB, hello and thanks for your assistance. I have attached my diagnostic zip file to this post. tower-diagnostics-20240619-1116.zip
-
Hello everyone. I restarted my server and noticed DISK 2 was unmountable. I followed THIS guide and got to the point of running the test. I got the below results: Phase 1 - find and verify superblock... Phase 2 - using internal log - zero log... ALERT: The filesystem has valuable metadata changes in a log which is being ignored because the -n option was used. Expect spurious inconsistencies which may be resolved by first mounting the filesystem to replay the log. - scan filesystem freespace and inode maps... sb_fdblocks 181403022, counted 182383607 - found root inode chunk Phase 3 - for each AG... - scan (but don't clear) agi unlinked lists... - process known inodes and perform inode discovery... - agno = 0 - agno = 1 - agno = 2 - agno = 3 - process newly discovered inodes... Phase 4 - check for duplicate blocks... - setting up duplicate extent list... - check for inodes claiming duplicate blocks... - agno = 0 - agno = 3 - agno = 2 - agno = 1 No modify flag set, skipping phase 5 Phase 6 - check inode connectivity... - traversing filesystem ... - traversal finished ... - moving disconnected inodes to lost+found ... Phase 7 - verify link counts... No modify flag set, skipping filesystem flush and exiting. I am a little worried that something bad has happened to the disk, but I have two parity drives so my data should be safe. Should I follow the guide and conduct a repair?
-
Worked for me! Thanks man!!! I had to replace a corrupted SSD and this worked flawlessly.
-
Hello, thanks for the help! Since I have a pool of two cache drives, can I remove the bad one and run the server off of a single cache drive until I can get a new drive?
-
Hello, after trying to run a SMART extended test on CACHE 2 I get the following error "Errors occurred - Check SMART report" please find the smart report attached. Thanks for your assistance. poseidon-smart-20230202-1944.zip
-
Hello @trurl, thank you for your response. I do not see any errors in pool devices. It looks like my log file keeps filling up after a few days. Here is a diagnostic file, request about 8 hours after a reboot. poseidon-diagnostics-20230130-2030.zip
-
Hello, here is a copy of my diagnostics attached to the post. poseidon-diagnostics-20230127-1130.zip
-
Anyone have any suggestions? Did I post the wrong diagnostic? I'm really not sure what to do at this point is my server even salvageable?
-
Hello, unfortunately I am writing because I am having several problems with my unraid server. About a week ago, I was checking the GUI and noted that the cpu was pinned at %100. I waited for a day and checked again. It was still at %100. I tried rebooting and noticed that the cpu wasnt pinned when the docker service wasnt running. So I concluded there was maybe a problem with a docker. I updated some dockers that needed updating but the problem still persisted. In addition I was now not able to access some of my dockers such as sonarr, radarr, prowlarr. But some of my other dockers like audiobookshelf and mealie worked fine. Continuing on, I decided to update unraid to 6.11.5 from 6.9.2. Once I updated the OS nothing different happened. I normally use unraid with a static IP but I noticed that somehow unraid was reporting a mac address to my router (unifi) that the mac address was different but it was still using the same IP (192.168.1.5). So it seemed that unraid was somehow using two different mac addresses and they were both trying to use 192.168.1.5. So I switched to automatic DHCP un unraid and assigned the origional first mac address that I know is the mac for the adapter as 192.168.1.5. That seemed to work and I'm not having the address problem. However, I still could not access the dockers that I needed. So I figured I would delete one and try to reinstall it with unraid backup/restore. That didn't work so i resorted to deleting the vdisk. After deleting the vdisk I restarted the server. After a restart i got an error that the docker service couldnt be started. I looked for other solutions and some said they get this error when the vdisk is too full, so increased the size to 100gb (was 50gb). That didnt work either. I deleted the vdisk (btrfs) several times and cycled the server to no avail. I also tried switching to xfs, which didnt work either. In a final hail mary I rolled the server back to 6.9.2 via the GUI and I am still stuck. I also tried deleting the vdisk and switching to xfs and that didnt work. So I guess the first issue is figuring out why the docker service wont start. Once I figure that out, I can see what was pinning my CPU if even it is docker. Here is a link to the diagnostics: https://www.mediafire.com/file/n2gh16l3fb53xbu/poseidon-diagnostics-20230121-1955.zip/file
-
Hello all, I am now getting a new error in my logs when I try to start the container. Please see my pastebin link for the logs
-
how did you change that?
-
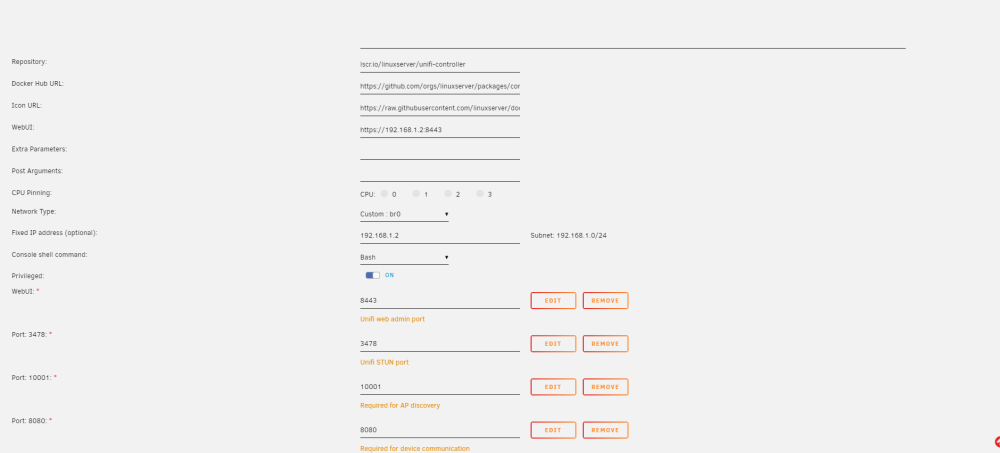
Hello, I am still experiencing the same problem unfortunately. For what its worth I cant reach my USG on the same network at 192.168.1.1 either.
-
Thanks for the reply! I have restored several times and I am still getting the same error!
-
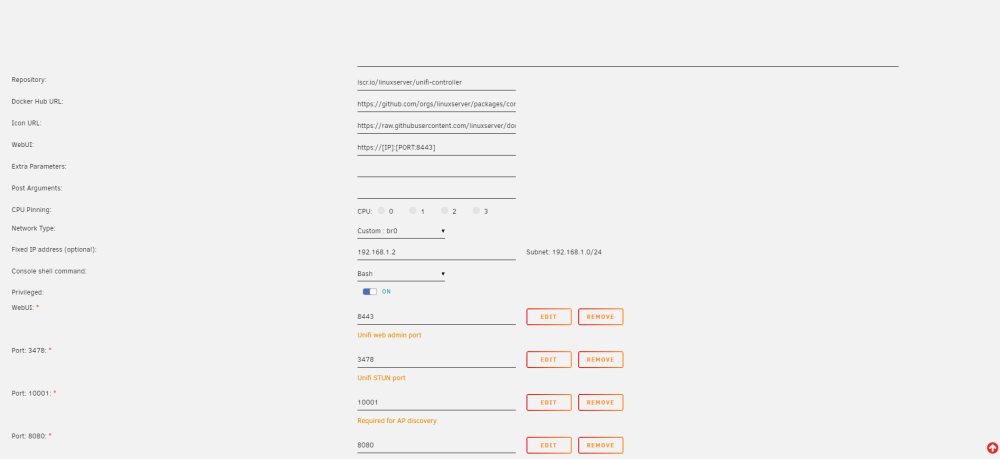
Here is an advanced view. Thanks for your help!
-
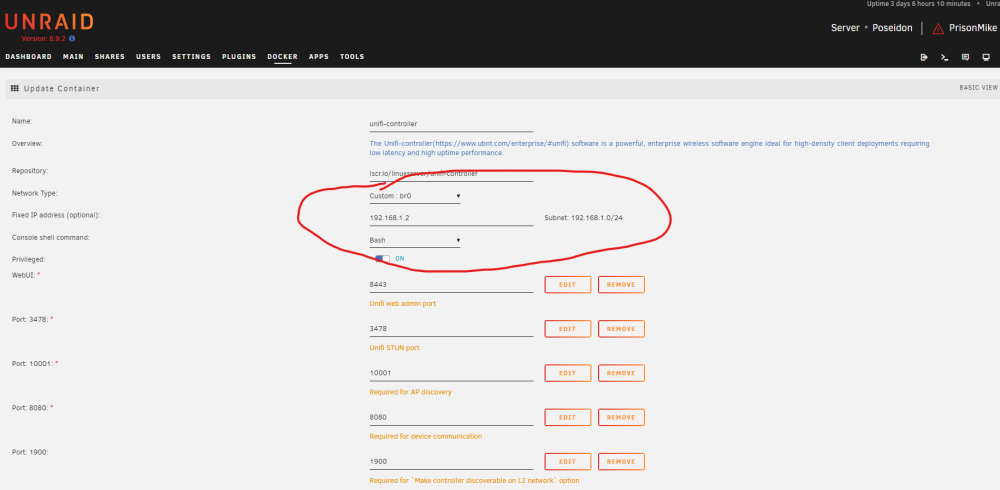
Well yes, but actually no. My server is 192.168.1.5 and I have unifi docker running on 192.168.1.2 so that shouldn't matter right?
-
Hello, I had the same problem about a month ago. I just shut the docker container off and forgot about it until recently. When I fired up the docker again, I couldn't reach the web GUI for some reason. I deleted my app data and downloaded the container again just to be safe (twice). And I still cant reach the web GUI no matter what I do. This is very frustrating as I have been wanting to upgrade my APs. If anyone has an idea, please let me know. Thanks! LOGS




