


BurningSky
Members
-
Joined
-
Last visited
-
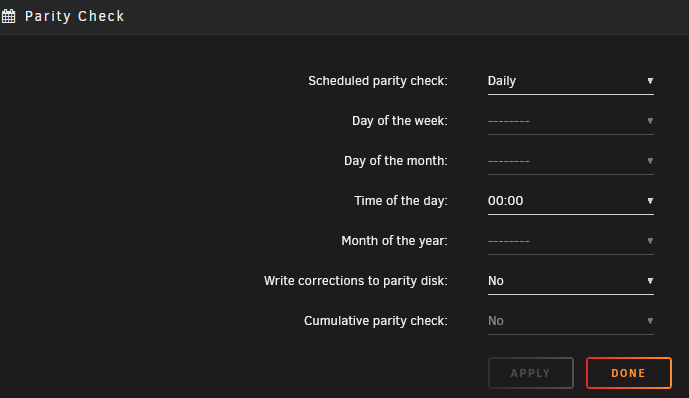
The error has come back again, from the notifications panel: Parity_Check_Tuning_1758855103.notify 26 Sept, 08:09 Parity_Check_Tuning_1758855103.notify This notification is invalid and cannot be displayed! For details, see the logs and the notification file at /tmp/notifications/unread/Parity_Check_Tuning_1758855103.notify And when I cat that message ~# cat /tmp/notifications/unread/Parity_Check_Tuning_1758855103.notify timestamp=1758855103 event=Parity Check Tuning subject=[RAGON] mover running description= importance=normal link=/Settings/Scheduler Looks like a blank description again so that might have been the cause. My change to the script to replace blank descriptions must have been overwritten
-
Weird, I typed a whole message and it only put the picture in so retyping the message... Sorry, my question probably didn't make sense, you had said "both a parity check is in operation AND you have set the plugin setting "Send notifications for mover or backup running" to Yes" so I was just wondering if it was best practice to disable one of these? It looks like cumulative option is set to no and greyed out, is that what you mean?
-
Is the recommendation to disable one when then other is enabled in that case? The second one only started happening today and, like you say, that's the default. I'm running Unraid 7.1.4 and 2024.08.16 for the plugin
-
So based on what the addition to the script has done in the last day or so, these are the ones it looks like it has modified: timestamp=1757126553 event=Parity Check Tuning subject=[UNRAID] mover running description=No details available. importance=normal link=/Settings/Scheduler timestamp=1757149940 event=Parity Check Tuning subject=[UNRAID] mover no longer running description=No details available. importance=normal link=/Settings/Scheduler timestamp=1757212942 event=Parity Check Tuning subject=[UNRAID] mover running description=No details available. importance=normal link=/Settings/Scheduler timestamp=1757214031 event=Parity Check Tuning subject=[UNRAID] backup running description=No details available. importance=normal link=/Settings/Scheduler timestamp=1757215478 event=Parity Check Tuning subject=[UNRAID] backup no longer running description=No details available. importance=normal link=/Settings/Scheduler timestamp=1757215837 event=Parity Check Tuning subject=[UNRAID] mover running description=No details available. importance=normal link=/Settings/Scheduler timestamp=1757231658 event=Parity Check Tuning subject=[UNRAID] mover no longer running description=No details available. importance=normal link=/Settings/Scheduler timestamp=1757299365 event=Parity Check Tuning subject=[UNRAID] mover running description=No details available. importance=normal link=/Settings/SchedulerBut now I'm getting the same error on the native parity check it looks like: Unraid_Parity_Check_1757236153.notify Sep 8, 08:17 Unraid_Parity_Check_1757236153.notify This notification is invalid and cannot be displayed! For details, see the logs and the notification file at /tmp/notifications/unread/Unraid_Parity_Check_1757236153.notify
-
I think I've found a fix for now. It looks like the notification is malformed which is causing the error. It appears that the description line being blank is causing the issue for me, so I've added an if check to replace the description under the sendNotification in the parity.check.tuning.php file if it's blank: global $parityTuningServer; // Avoid invalid empty description if (trim($desc) === "") { $desc = "No details available."; }
-
Has anyone found a resolution for the notification error?
-
I've started receiving a lot of warning notifications from Parity Check Tuning, is there a way to resolve this? Parity_Check_Tuning_1753862422.notifyJul 30, 09:11 Parity_Check_Tuning_1753862422.notifyThis notification is invalid and cannot be displayed! For details, see the logs and the notification file at /tmp/notifications/unread/Parity_Check_Tuning_1753862422.notify
-
A couple more restarts and it seems to have come online finally!
-
I just noticed a smart error on another drive, I guess that might be the cause and now I'm royally f**ked?
-
I've had a failed disk which I've replaced, I stopped the array, made sure disk 4 was set to no device, swapped in the new disk, formatted it and have assigned it to disk 4 but when I press start to start the data rebuild the button grays out but nothing happens. The status bar at the bottom just says array stopped and after waiting a good 5mins I refreshed the page and the start button is clickable again. Have I missed something? ragon-diagnostics-20250428-1602.zip
-
Thanks, I will wait for the replacement drive before doing anything in that case and hope none of the others decide to follow suit! Ah, I never knew about that, I've cleaned that up now, it said it has removed 20 config files, thanks!
-
Thanks both. All my important data is backed up, in 2 locations, so I definitely don't rely on the partiy as protection. I just meant the array itself is unprotected as per the array operation status, but I should have been clearer. The disk is being emulated by the parity drive at the moment, but I won't be able to do anything physically with the server until Thursday. I've attached the diagnostics, but I think you've both confirmed what I thought, I can't do anything until I replace the drive, unless something in the logs suggest otherwise. ragon-diagnostics-20250420-0908.zip
-
I noticed last night that one of my drives has gone offline due to "Reallocated sector count" prefail so currently the array is running unprotected. I can't replace the drive until later in the week so am currently running at risk. I think I know the answer but want to check. I have enough space on the array to remove the disk and have parity protection again, but is it possible to remove a failed drive without losing all the data on it? Or is there a way to bring the failed drive back online long enough to move the data off of it and then remove it from the array?
-
Every weekend I get a notification form Fix Common Problems about mcelog not supporting my processor: Jan 5 09:52:58 Ragon root: Fix Common Problems: Error: Machine Check Events detected on your server Jan 5 09:52:58 Ragon root: mcelog: ERROR: AMD Processor family 25: mcelog does not support this processor. Please use the edac_mce_amd module instead. Jan 5 09:52:58 Ragon root: CPU is unsupported From looking through the forums, it looks like this can just be ignored, but I just wanted to check if I was missing something important. Also, can I safely ignore the error in Fix Common Problems or is there a better solution? I'm running a AMD Ryzen 5 5600X with a MSI X470 GAMING PLUS MAX (MS-7B79) mobo on Unraid 6.12.14 I have the mdac_mce_amd module: # lsmod | grep edac_mce_amd edac_mce_amd 36864 0 This is what I get from mce in syslog ~# grep -i "mce" /var/log/syslog Dec 30 00:43:34 Ragon kernel: mce: [Hardware Error]: Machine check events logged Dec 30 00:43:34 Ragon kernel: mce: [Hardware Error]: CPU 6: Machine Check: 0 Bank 5: bea0000001000108 Dec 30 00:43:34 Ragon kernel: mce: [Hardware Error]: TSC 0 ADDR ffffffa029cba8 MISC d012000100000000 SYND 4d000000 IPID 500b00000 0000 Dec 30 00:43:34 Ragon kernel: mce: [Hardware Error]: PROCESSOR 2:a20f12 TIME 1735519255 SOCKET 0 APIC 1 microcode a201210 Dec 30 00:43:34 Ragon kernel: MCE: In-kernel MCE decoding enabled. Dec 30 00:54:18 Ragon root: mcelog: ERROR: AMD Processor family 25: mcelog does not support this processor. Please use the edac_ mce_amd module instead. Dec 30 08:26:07 Ragon root: mcelog: ERROR: AMD Processor family 25: mcelog does not support this processor. Please use the edac_ mce_amd module instead. Jan 5 04:30:17 Ragon root: mcelog: ERROR: AMD Processor family 25: mcelog does not support this processor. Please use the edac_ mce_amd module instead. Jan 5 09:52:58 Ragon root: mcelog: ERROR: AMD Processor family 25: mcelog does not support this processor. Please use the edac_ mce_amd module instead.
-
Looks like that might have helped! Thanks! Posted in there, thanks for your help

