


-
Forgot to follow up on this, the problem was my Mikrotik switch not allowing multiple tags per port (which I had to enable in settings). After that, it started to work right away.
-
I'm kind of afraid to ask, but why isn't anyone else just using symlinks from the array and bypassing flash entirely? Sort of like this (after installing it with curl), set to run on array start: #!/bin/bash for TARGET in /root/.zshrc /root/.oh-my-zsh; do if [ -e "$TARGET" ] || [ -L "$TARGET" ]; then rm -rf "$TARGET" if [ $? -ne 0 ]; then logger -t zsh-setup "failed to remove $TARGET, aborting" exit 1 fi fi done ln -s /mnt/user/zshconf/.zshrc /root/.zshrc if [ $? -ne 0 ]; then logger -t zsh-setup "failed to symlink .zshrc" exit 1 fi logger -t zsh-setup "symlinked .zshrc" ln -s /mnt/user/zshconf/.oh-my-zsh /root/.oh-my-zsh if [ $? -ne 0 ]; then logger -t zsh-setup "failed to symlink .oh-my-zsh" exit 1 fi logger -t zsh-setup "symlinked .oh-my-zsh"and then when the array is stopped: #!/bin/bash for TARGET in /root/.zshrc /root/.oh-my-zsh; do if [ -e "$TARGET" ] || [ -L "$TARGET" ]; then rm -rf "$TARGET" if [ $? -ne 0 ]; then logger -t zsh-stop "failed to remove $TARGET, aborting" exit 1 fi fi done cp /mnt/user/zshconf/.zshrc /root/.zshrc if [ $? -ne 0 ]; then logger -t zsh-stop "failed to copy .zshrc" exit 1 fi logger -t zsh-stop "copied .zshrc" cp -r /mnt/user/zshconf/.oh-my-zsh /root/.oh-my-zsh if [ $? -ne 0 ]; then logger -t zsh-stop "failed to copy .oh-my-zsh" exit 1 fi logger -t zsh-stop "copied .oh-my-zsh"That way once the array is stopped after having been started, the config files persist. The only case where your config wouldn't be applied would be on first boot and in that case I wouldn't really care if I had to use zsh or bash with no config. I could be missing something and haven't fully tested this solution, but it seems a bit more clean than running the install script every boot, no?
-
That'd be my guess too, it's strange that it can't see the tagged traffic though.. (the mikrotik only has the default vlan automatically discovered). Thanks - that is the plan, I want my router to handle everything else. I will work on updating my config to not include br0, the catch is that I wanted to have a back up connection in case one of my NICs failed but if this is a problem I can find a different solution (like vlans, if I could get them to work). Do you know if having two NICs on the same subnet could cause this issue, or why it's not recommended?
-
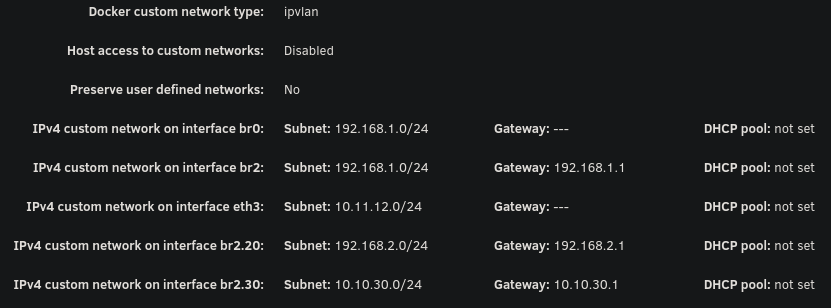
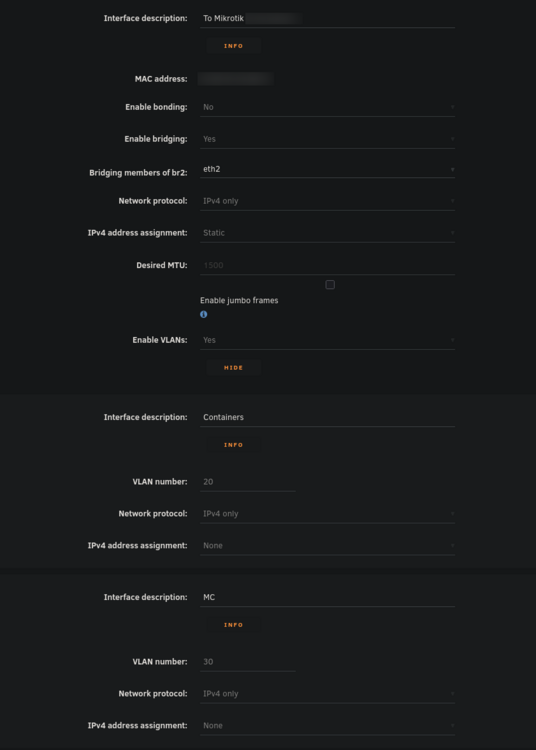
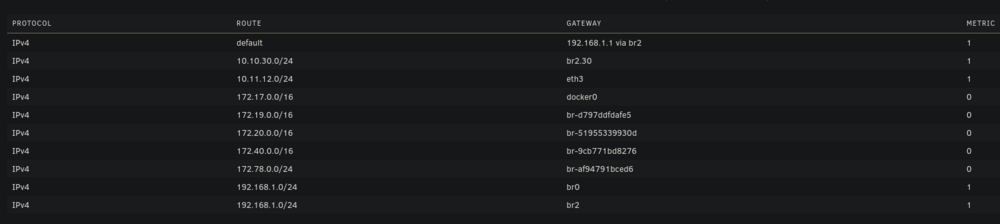
Hello everyone, I've been pulling my hair out trying to get my VLAN working with Unraid (specifically for containers). While I'm able to get other things working on my VLAN, I'm unable to even get arping to work from a container on unraid. Note that my vlan 30 is on 10.10.30.0/24 with a gateway address (router) of 10.10.30.1. Possible issues: bridge vlan show only shows VLAN 1 on br2 and br2.30 vlan_filtering is 0 on br2 and br2.30 Ping from container to 10.10.30.1 fails with no responses ARP from container to 10.10.30.1 fails with no responses After assigning static IP to Unraid host to test if it even works from there, ARP and ping gives 0 responses over both eth2.30 and br2.30 MikroTik Switch hosts table never showed a VLAN 30 entry with the unraid host MAC, confirming tagged frames never left Unraid host ip route get 10.10.30.1 showed host routing through LAN 192 subnet on br2. When adding a route table entry with no static assignment, this changed to a different subnet of 10.11.12.x which I use only for DAC cable between two servers I've confirmed many things based on other forum posts: VLANs enabled in network settings VLAN 30 configured with IPv4 assignment None eth2.30@eth2 UP with LOWER_UP and master br2.30 br2.30 UP with LOWER_UP Docker custom network br2.30 (not to be confused with the master interface) has correct subnet 10.10.30.0/24 , gateway 10.10.30.1, ipvlan, parent interface br2.30. Host access to custom networks disabled Container gets correct IP 10.10.30.2 and default route via 10.10.30.1 Changes attempted but failed to resolve the problem: Static route added for 10.10.30.0/24 via br2.30 in GUI routing table Temporarily enabled vlan_filtering on br2.30 via ip link set br2.30 type bridge vlan_filtering 1 Temporarily added IP 10.10.30.254 assigned to br2.30 on host Temporarily added IP 10.10.30.254 assigned to eth2.30 on host Static MAC entry added to Mikrotik hosts table for Unraid MAC on VLAN 30 Restarted docker service many times to recreate br2.30 Disabling all firewall rules for VLAN interface in OPNSense 7: eth2: <BROADCAST,MULTICAST,UP,LOWER_UP> mtu 1500 qdisc mq master br2 state UP 13: eth2.40@eth2: <BROADCAST,MULTICAST,UP,LOWER_UP> mtu 1500 qdisc noqueue master br2.40 state UP 14: eth2.30@eth2: <BROADCAST,MULTICAST,UP,LOWER_UP> mtu 1500 qdisc noqueue master br2.30 state UP 15: eth2.20@eth2: <BROADCAST,MULTICAST,UP,LOWER_UP> mtu 1500 qdisc noqueue master br2.20 state UP 16: br2: <BROADCAST,MULTICAST,UP,LOWER_UP> mtu 1500 qdisc noqueue state UP 17: br2.40: <BROADCAST,MULTICAST,UP,LOWER_UP> mtu 1500 qdisc noqueue state UP 18: br2.30: <BROADCAST,MULTICAST,UP,LOWER_UP> mtu 1500 qdisc noqueue state UP 19: br2.20: <BROADCAST,MULTICAST,UP,LOWER_UP> mtu 1500 qdisc noqueue state UP Screenshots: Docker custom network interfaces: Network config: Routing table:
-
Thanks for checking - that's correct. Perhaps they just need a reseat, as I have a backplane? I'll definitely give it a try once parity check completes.
-
Regarding the chromium traps, I get them while running changedetection in docker which uses Chromium. Guessing it's probably not your issue, but it's good to note that some docker errors get logged to syslog.
-
I'm not sure what fixed this, but I haven't encountered this issue for months. Every now and then I'll still get a php-fpm process logged but it quickly goes away without my monitor script cleaning it up. I'm back to running pretty much everything I was before, so it remains a mystery as to what was causing this problem.
-
Hello, I have two drives that may require replacement. I was planning on replacing one already (under RMA) -- drive SDY in this case. The other is a new issue. Fortunately I have dual parity, but I'm worried that this may eventually lead to data loss if not RMA'd. I know that vibrations can cause weird errors, however, the ones with SDY come back even after reboot. Do these really need replacement? Drives are $$$ right now, and I'm worried that SPD may just give me a refund and I'll be unable to do a 1:1 replacement. Diags attached. Thanks! diag.zip
-
Here you go:
-
I went four days without encountering this issue, which is a new record. However, suspiciously, it started happening again when I opened the unraid webui this morning to resume a parity check. It seems that it may be tied to both caddy-cloudflare running while visiting the webui.
-
Hello all, I'm still working on parity swapping either way, but my parity disk has a few errors that happened during parity checks. I would usually be concerned about UNC at LBA errors, but this one seems very strange and doesn't make much sense. Any idea what could cause this? Note that I have a backplane so it's likely unrelated to cables as none of my other drives have this issue. ATA Error Count: 2 CR = Command Register [HEX] FR = Features Register [HEX] SC = Sector Count Register [HEX] SN = Sector Number Register [HEX] CL = Cylinder Low Register [HEX] CH = Cylinder High Register [HEX] DH = Device/Head Register [HEX] DC = Device Command Register [HEX] ER = Error register [HEX] ST = Status register [HEX] Powered_Up_Time is measured from power on, and printed as DDd+hh:mm:SS.sss where DD=days, hh=hours, mm=minutes, SS=sec, and sss=millisec. It "wraps" after 49.710 days. Error 2 occurred at disk power-on lifetime: 31278 hours (1303 days + 6 hours) When the command that caused the error occurred, the device was active or idle. After command completion occurred, registers were: ER ST SC SN CL CH DH -- -- -- -- -- -- -- 40 43 00 00 00 00 00 Error: UNC at LBA = 0x00000000 = 0 Commands leading to the command that caused the error were: CR FR SC SN CL CH DH DC Powered_Up_Time Command/Feature_Name -- -- -- -- -- -- -- -- ---------------- -------------------- 60 00 10 58 4f 86 40 00 7d+13:54:49.902 READ FPDMA QUEUED 60 00 38 58 63 86 40 00 7d+13:54:47.291 READ FPDMA QUEUED 60 00 30 58 5f 86 40 00 7d+13:54:47.290 READ FPDMA QUEUED 60 00 28 58 5b 86 40 00 7d+13:54:47.289 READ FPDMA QUEUED 60 00 20 58 57 86 40 00 7d+13:54:47.288 READ FPDMA QUEUED Error 1 occurred at disk power-on lifetime: 30706 hours (1279 days + 10 hours) When the command that caused the error occurred, the device was active or idle. After command completion occurred, registers were: ER ST SC SN CL CH DH -- -- -- -- -- -- -- 40 43 00 00 00 00 00 Error: UNC at LBA = 0x00000000 = 0 Commands leading to the command that caused the error were: CR FR SC SN CL CH DH DC Powered_Up_Time Command/Feature_Name -- -- -- -- -- -- -- -- ---------------- -------------------- 60 00 00 70 3c 1c 40 00 31d+23:15:25.360 READ FPDMA QUEUED 60 00 00 70 38 1c 40 00 31d+23:15:22.785 READ FPDMA QUEUED 60 00 00 70 34 1c 40 00 31d+23:15:22.779 READ FPDMA QUEUED 60 00 00 70 34 1c 40 00 31d+23:15:22.779 READ FPDMA QUEUED 60 00 00 70 30 1c 40 00 31d+23:15:22.775 READ FPDMA QUEUED Should I be concerned about this? I wanted to use this disk as an array after parity swap, but won't if this is concerning. I have diagnostics that I can attach if desired, although the above seems to be the root of the issue.
-
I re-enabled everything except for the HA integrations and it hasn't happened again for two days according to my monitor script. So I'm not sure what's causing this, but I suppose I can live with it for now since my script cleans it up when it happens. Very strange either way.
-
Gotcha, I was confused since my parity drives themselves are fine and it was a data drive that failed. Appreciate it.
-
Hi all, I have a 22TB drive that I want to add to my array. I want to swap one of my two 14TB parity disks with it while I wait for another 22TB to arrive, however one of my data drives in the array is in a disabled state. Is it safe for me to do the parity swap procedure while I have an emulated data disk? I figure the answer is probably yes since I have dual parity, but wanted to check while I wait for the preclear to finish on the new 22TB. I'd want to add the 14TB parity back to the array to replace the currently-disabled drive after the parity swap. Thanks!
-
I haven't been able to quite pin this down yet. With the cloudflare TLS section of caddy-cloudflare's Caddyfile disabled and relevant home assistant integrations disabled, it didn't happen for over 24 hours. I wanted to see if maybe it was the DNS after all (which I tested previously and determined was not the case) so I re-enabled it, and within about an hour it started happening again. Perhaps I didn't wait long enough (40 minutes instead of 55) and it's been cloudflare's TLS all along. Will update further if I find out, running one more time with cloudflare TLS enabled to be sure. Mostly just updating in case someone else runs into this bizarre, frustrating issue.
View in the app
A better way to browse. Learn more.


