


Everything posted by RocketSLC
-
Forgot to follow up on this, the problem was my Mikrotik switch not allowing multiple tags per port (which I had to enable in settings). After that, it started to work right away.
-
I'm kind of afraid to ask, but why isn't anyone else just using symlinks from the array and bypassing flash entirely? Sort of like this (after installing it with curl), set to run on array start: #!/bin/bash for TARGET in /root/.zshrc /root/.oh-my-zsh; do if [ -e "$TARGET" ] || [ -L "$TARGET" ]; then rm -rf "$TARGET" if [ $? -ne 0 ]; then logger -t zsh-setup "failed to remove $TARGET, aborting" exit 1 fi fi done ln -s /mnt/user/zshconf/.zshrc /root/.zshrc if [ $? -ne 0 ]; then logger -t zsh-setup "failed to symlink .zshrc" exit 1 fi logger -t zsh-setup "symlinked .zshrc" ln -s /mnt/user/zshconf/.oh-my-zsh /root/.oh-my-zsh if [ $? -ne 0 ]; then logger -t zsh-setup "failed to symlink .oh-my-zsh" exit 1 fi logger -t zsh-setup "symlinked .oh-my-zsh"and then when the array is stopped: #!/bin/bash for TARGET in /root/.zshrc /root/.oh-my-zsh; do if [ -e "$TARGET" ] || [ -L "$TARGET" ]; then rm -rf "$TARGET" if [ $? -ne 0 ]; then logger -t zsh-stop "failed to remove $TARGET, aborting" exit 1 fi fi done cp /mnt/user/zshconf/.zshrc /root/.zshrc if [ $? -ne 0 ]; then logger -t zsh-stop "failed to copy .zshrc" exit 1 fi logger -t zsh-stop "copied .zshrc" cp -r /mnt/user/zshconf/.oh-my-zsh /root/.oh-my-zsh if [ $? -ne 0 ]; then logger -t zsh-stop "failed to copy .oh-my-zsh" exit 1 fi logger -t zsh-stop "copied .oh-my-zsh"That way once the array is stopped after having been started, the config files persist. The only case where your config wouldn't be applied would be on first boot and in that case I wouldn't really care if I had to use zsh or bash with no config. I could be missing something and haven't fully tested this solution, but it seems a bit more clean than running the install script every boot, no?
-
That'd be my guess too, it's strange that it can't see the tagged traffic though.. (the mikrotik only has the default vlan automatically discovered). Thanks - that is the plan, I want my router to handle everything else. I will work on updating my config to not include br0, the catch is that I wanted to have a back up connection in case one of my NICs failed but if this is a problem I can find a different solution (like vlans, if I could get them to work). Do you know if having two NICs on the same subnet could cause this issue, or why it's not recommended?
-
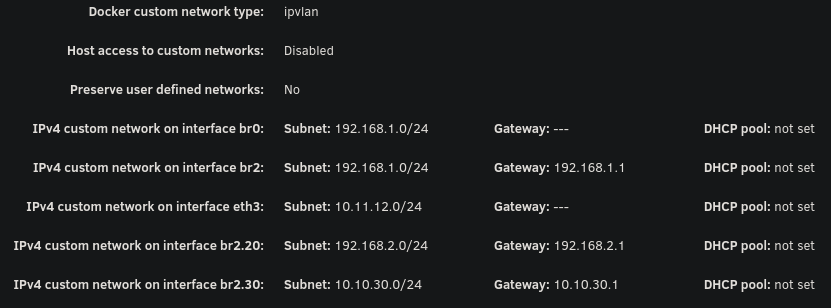
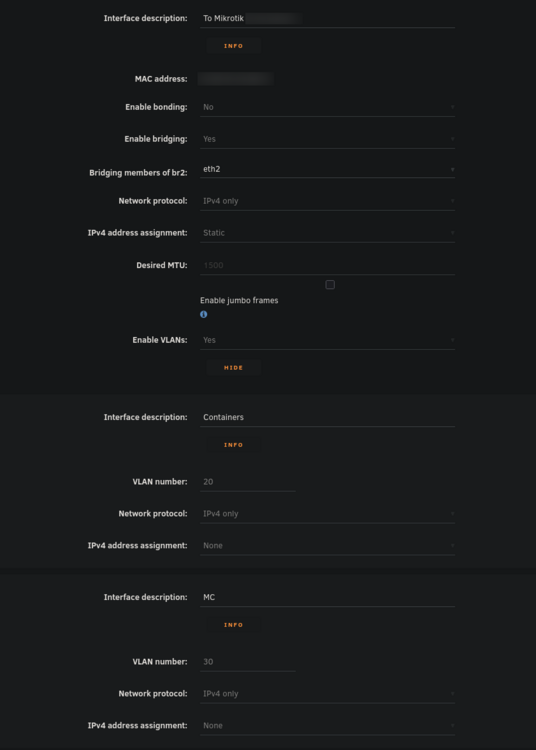
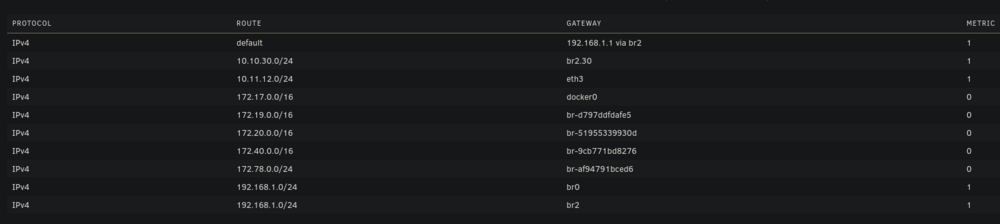
Hello everyone, I've been pulling my hair out trying to get my VLAN working with Unraid (specifically for containers). While I'm able to get other things working on my VLAN, I'm unable to even get arping to work from a container on unraid. Note that my vlan 30 is on 10.10.30.0/24 with a gateway address (router) of 10.10.30.1. Possible issues: bridge vlan show only shows VLAN 1 on br2 and br2.30 vlan_filtering is 0 on br2 and br2.30 Ping from container to 10.10.30.1 fails with no responses ARP from container to 10.10.30.1 fails with no responses After assigning static IP to Unraid host to test if it even works from there, ARP and ping gives 0 responses over both eth2.30 and br2.30 MikroTik Switch hosts table never showed a VLAN 30 entry with the unraid host MAC, confirming tagged frames never left Unraid host ip route get 10.10.30.1 showed host routing through LAN 192 subnet on br2. When adding a route table entry with no static assignment, this changed to a different subnet of 10.11.12.x which I use only for DAC cable between two servers I've confirmed many things based on other forum posts: VLANs enabled in network settings VLAN 30 configured with IPv4 assignment None eth2.30@eth2 UP with LOWER_UP and master br2.30 br2.30 UP with LOWER_UP Docker custom network br2.30 (not to be confused with the master interface) has correct subnet 10.10.30.0/24 , gateway 10.10.30.1, ipvlan, parent interface br2.30. Host access to custom networks disabled Container gets correct IP 10.10.30.2 and default route via 10.10.30.1 Changes attempted but failed to resolve the problem: Static route added for 10.10.30.0/24 via br2.30 in GUI routing table Temporarily enabled vlan_filtering on br2.30 via ip link set br2.30 type bridge vlan_filtering 1 Temporarily added IP 10.10.30.254 assigned to br2.30 on host Temporarily added IP 10.10.30.254 assigned to eth2.30 on host Static MAC entry added to Mikrotik hosts table for Unraid MAC on VLAN 30 Restarted docker service many times to recreate br2.30 Disabling all firewall rules for VLAN interface in OPNSense 7: eth2: <BROADCAST,MULTICAST,UP,LOWER_UP> mtu 1500 qdisc mq master br2 state UP 13: eth2.40@eth2: <BROADCAST,MULTICAST,UP,LOWER_UP> mtu 1500 qdisc noqueue master br2.40 state UP 14: eth2.30@eth2: <BROADCAST,MULTICAST,UP,LOWER_UP> mtu 1500 qdisc noqueue master br2.30 state UP 15: eth2.20@eth2: <BROADCAST,MULTICAST,UP,LOWER_UP> mtu 1500 qdisc noqueue master br2.20 state UP 16: br2: <BROADCAST,MULTICAST,UP,LOWER_UP> mtu 1500 qdisc noqueue state UP 17: br2.40: <BROADCAST,MULTICAST,UP,LOWER_UP> mtu 1500 qdisc noqueue state UP 18: br2.30: <BROADCAST,MULTICAST,UP,LOWER_UP> mtu 1500 qdisc noqueue state UP 19: br2.20: <BROADCAST,MULTICAST,UP,LOWER_UP> mtu 1500 qdisc noqueue state UP Screenshots: Docker custom network interfaces: Network config: Routing table:
-
Thanks for checking - that's correct. Perhaps they just need a reseat, as I have a backplane? I'll definitely give it a try once parity check completes.
-
Regarding the chromium traps, I get them while running changedetection in docker which uses Chromium. Guessing it's probably not your issue, but it's good to note that some docker errors get logged to syslog.
-
I'm not sure what fixed this, but I haven't encountered this issue for months. Every now and then I'll still get a php-fpm process logged but it quickly goes away without my monitor script cleaning it up. I'm back to running pretty much everything I was before, so it remains a mystery as to what was causing this problem.
-
Hello, I have two drives that may require replacement. I was planning on replacing one already (under RMA) -- drive SDY in this case. The other is a new issue. Fortunately I have dual parity, but I'm worried that this may eventually lead to data loss if not RMA'd. I know that vibrations can cause weird errors, however, the ones with SDY come back even after reboot. Do these really need replacement? Drives are $$$ right now, and I'm worried that SPD may just give me a refund and I'll be unable to do a 1:1 replacement. Diags attached. Thanks! diag.zip
-
Here you go:
-
I went four days without encountering this issue, which is a new record. However, suspiciously, it started happening again when I opened the unraid webui this morning to resume a parity check. It seems that it may be tied to both caddy-cloudflare running while visiting the webui.
-
Hello all, I'm still working on parity swapping either way, but my parity disk has a few errors that happened during parity checks. I would usually be concerned about UNC at LBA errors, but this one seems very strange and doesn't make much sense. Any idea what could cause this? Note that I have a backplane so it's likely unrelated to cables as none of my other drives have this issue. ATA Error Count: 2 CR = Command Register [HEX] FR = Features Register [HEX] SC = Sector Count Register [HEX] SN = Sector Number Register [HEX] CL = Cylinder Low Register [HEX] CH = Cylinder High Register [HEX] DH = Device/Head Register [HEX] DC = Device Command Register [HEX] ER = Error register [HEX] ST = Status register [HEX] Powered_Up_Time is measured from power on, and printed as DDd+hh:mm:SS.sss where DD=days, hh=hours, mm=minutes, SS=sec, and sss=millisec. It "wraps" after 49.710 days. Error 2 occurred at disk power-on lifetime: 31278 hours (1303 days + 6 hours) When the command that caused the error occurred, the device was active or idle. After command completion occurred, registers were: ER ST SC SN CL CH DH -- -- -- -- -- -- -- 40 43 00 00 00 00 00 Error: UNC at LBA = 0x00000000 = 0 Commands leading to the command that caused the error were: CR FR SC SN CL CH DH DC Powered_Up_Time Command/Feature_Name -- -- -- -- -- -- -- -- ---------------- -------------------- 60 00 10 58 4f 86 40 00 7d+13:54:49.902 READ FPDMA QUEUED 60 00 38 58 63 86 40 00 7d+13:54:47.291 READ FPDMA QUEUED 60 00 30 58 5f 86 40 00 7d+13:54:47.290 READ FPDMA QUEUED 60 00 28 58 5b 86 40 00 7d+13:54:47.289 READ FPDMA QUEUED 60 00 20 58 57 86 40 00 7d+13:54:47.288 READ FPDMA QUEUED Error 1 occurred at disk power-on lifetime: 30706 hours (1279 days + 10 hours) When the command that caused the error occurred, the device was active or idle. After command completion occurred, registers were: ER ST SC SN CL CH DH -- -- -- -- -- -- -- 40 43 00 00 00 00 00 Error: UNC at LBA = 0x00000000 = 0 Commands leading to the command that caused the error were: CR FR SC SN CL CH DH DC Powered_Up_Time Command/Feature_Name -- -- -- -- -- -- -- -- ---------------- -------------------- 60 00 00 70 3c 1c 40 00 31d+23:15:25.360 READ FPDMA QUEUED 60 00 00 70 38 1c 40 00 31d+23:15:22.785 READ FPDMA QUEUED 60 00 00 70 34 1c 40 00 31d+23:15:22.779 READ FPDMA QUEUED 60 00 00 70 34 1c 40 00 31d+23:15:22.779 READ FPDMA QUEUED 60 00 00 70 30 1c 40 00 31d+23:15:22.775 READ FPDMA QUEUED Should I be concerned about this? I wanted to use this disk as an array after parity swap, but won't if this is concerning. I have diagnostics that I can attach if desired, although the above seems to be the root of the issue.
-
I re-enabled everything except for the HA integrations and it hasn't happened again for two days according to my monitor script. So I'm not sure what's causing this, but I suppose I can live with it for now since my script cleans it up when it happens. Very strange either way.
-
Gotcha, I was confused since my parity drives themselves are fine and it was a data drive that failed. Appreciate it.
-
Hi all, I have a 22TB drive that I want to add to my array. I want to swap one of my two 14TB parity disks with it while I wait for another 22TB to arrive, however one of my data drives in the array is in a disabled state. Is it safe for me to do the parity swap procedure while I have an emulated data disk? I figure the answer is probably yes since I have dual parity, but wanted to check while I wait for the preclear to finish on the new 22TB. I'd want to add the 14TB parity back to the array to replace the currently-disabled drive after the parity swap. Thanks!
-
I haven't been able to quite pin this down yet. With the cloudflare TLS section of caddy-cloudflare's Caddyfile disabled and relevant home assistant integrations disabled, it didn't happen for over 24 hours. I wanted to see if maybe it was the DNS after all (which I tested previously and determined was not the case) so I re-enabled it, and within about an hour it started happening again. Perhaps I didn't wait long enough (40 minutes instead of 55) and it's been cloudflare's TLS all along. Will update further if I find out, running one more time with cloudflare TLS enabled to be sure. Mostly just updating in case someone else runs into this bizarre, frustrating issue.
-
Hello, I'm unsure of where to post this since the issue isn't caused by unraid or caddy-cloudflare alone, but both of them together. It also started suddenly, with no updates or config changes to unraid or caddy-cloudflare. Basically, around 36 hours ago my server started having a CPU temp alarm. I ssh'd in and ran htop and saw that there was at least 7 php-fpm pool processes using 100% of the CPU. I found this post which had docker as the cause. I stopped docker and waited about an hour and no processes were spawned, likely meaning a container is the primary issue. I went through all of my 45+ containers one by one, waiting good time between launching the next and eventually determined that caddy-cloudflare was the cause. I noticed that I'm under a cooldown for requesting certs but other than that there is not any relevant logging to caddy-cloudflare or the syslog. My current setup for caddy utilizes caddy-cloudflare and compose manager. It happens with the previous and latest versions of caddy built with the cloudflare module. I'm using a few custom networks, br0 is the bridge and then I have two docker networks utilized by caddy. Here's what I've tried so far.. I tried deleting the caddy_data and caddy_config volumes which delayed these processes from appearing for around 30 minutes. I removed the DNS challenge config from caddy and switched to self signed internal certs. At first, this seemed to actually work! I went a whole 40 minutes with no issues and went and did something else. When I came back though, the zombies were there again. I tried adding limits to the caddy stack to see if that was the cause of the issue. Nope, zombies still spawned and memory usage doesn't ever go above 8%. Rebooting several times. Updating caddy-cloudflare by building it locally, using the latest version of caddy-builder. Disabling Home Assistant integrations which utilize caddy's reverse proxy. Time will tell if this resolves the issue, I'm still waiting to see that. Unclear if related, but one of my drives seemed to die around the same time as this issue. I have a replacement on the way, but the timing is at least suspicious. I'll update this post if replacing the emulated drive resolves this issue. In the meantime, I've created a script which monitors and kills these zombie php-fpm processes, as killing the processes seems to not cause other problems elsewhere and temporarily resolves the issue. I've considered deleting the docker image, but setting up all of my services (even if sort of easy to restore under Apps) along with my custom networks would be rough. I've also thought about updating to the 7.2 beta, but it doesn't seem to have any changes related to it that would fix this issue. If disabling HA integrations and replacing the drive doesn't fix this issue, I'll first try deleting the docker image and building from scratch. If this still doesn't resolve it, I'll try updating to beta. If anyone else has any suggestions, I appreciate it.
-
I wanted to add my experience here with plex and the b50 for others looking. As of this post, it does not currently function on 7.1.4 (or 7.2 beta.3, which uses kernel 6.12.47) as stated by OP and Simon. This is because docker needs the host to fully support it to properly pass HW acceleration through to containers (in other words, it needs the drivers in the kernel). Until Unraid has a new release with an updated kernel, it will not function in at all with Plex. This also causes the fan to stay at 100%. This doesn't necessarily mean that it doesn't work completely (that's likely what is happening for unr41dus3r above). I can also confirm what unr41dus3r is experiencing, if I try to mount it to two containers at once, it crashes my server after a few minutes. Unfortunately for me and my transcoding server, the defaults of my motherboard automatically disable CPU HW acceleration when a GPU is installed, although I'm positive I can resolve this by taking the GPU out and forcing iGPU in the bios. This would allow me to use the GPU for Ollama and then CPU HW acceleration for Plex in the meantime. I'd rather not take it out just yet as I wanted to see the performance in Ollama first, but once I do that I probably will since the fan is pretty loud. Overall, a bummer for now. Hoping that the next version of stable Unraid (or even the beta) supports the B50 so that we can all use it as intended.
-
Once again, you have saved me! I had to run without -n and with -L. Phase 1 - find and verify superblock... Phase 2 - using internal log - zero log... ALERT: The filesystem has valuable metadata changes in a log which is being destroyed because the -L option was used. - scan filesystem freespace and inode maps... clearing needsrepair flag and regenerating metadata invalid start block 1746451168 in record 417 of cnt btree block 3/172 agf_freeblks 28702206, counted 28702198 in ag 3 sb_icount 292096, counted 283264 sb_ifree 14949, counted 30078 sb_fdblocks 89729384, counted 142158794 - found root inode chunk Phase 3 - for each AG... - scan and clear agi unlinked lists... - process known inodes and perform inode discovery... - agno = 0 - agno = 1 - agno = 2 - agno = 3 - agno = 4 - agno = 5 - agno = 6 - agno = 7 - agno = 8 - agno = 9 - agno = 10 - agno = 11 - agno = 12 - process newly discovered inodes... Phase 4 - check for duplicate blocks... - setting up duplicate extent list... - check for inodes claiming duplicate blocks... - agno = 0 - agno = 1 - agno = 2 - agno = 5 - agno = 8 - agno = 11 - agno = 6 - agno = 12 - agno = 10 - agno = 9 - agno = 4 - agno = 3 - agno = 7 Phase 5 - rebuild AG headers and trees... - reset superblock... Phase 6 - check inode connectivity... - resetting contents of realtime bitmap and summary inodes - traversing filesystem ... - traversal finished ... - moving disconnected inodes to lost+found ... Phase 7 - verify and correct link counts... Maximum metadata LSN (15:2351571) is ahead of log (1:2). Format log to cycle 18. done After that, the next test passed and I was able to stop the array (taking it out of maintenance mode) and it came back normally. Thanks!
-
Hello, I recently had a disk (Disk 8, sdp, dm-7) fall out of my array with the error "Unmountable: Wrong or No File System". At first, I just attempted normal data rebuild after removing and re-adding the disk to the array, with the hopes that this would fix my problem. Unfortunately, even after the rebuild was successful, I get the same error: UNRAID emhttpd: shcmd (9411): mkdir -p /mnt/disk8 UNRAID emhttpd: shcmd (9412): mount -t xfs -o noatime,nouuid /dev/mapper/md8 /mnt/disk8 UNRAID kernel: XFS (dm-7): Mounting V5 Filesystem UNRAID kernel: XFS (dm-7): Corruption warning: Metadata has LSN (18:4) ahead of current LSN (15:2351740). Please unmount and run xfs_repair (>= v4.3) to resolve. UNRAID kernel: XFS (dm-7): log mount/recovery failed: error -22 UNRAID kernel: XFS (dm-7): log mount failed UNRAID root: mount: /mnt/disk8: wrong fs type, bad option, bad superblock on /dev/mapper/md8, missing codepage or helper program, or other error. UNRAID root: dmesg(1) may have more information after failed mount system call. UNRAID emhttpd: shcmd (9412): exit status: 32 UNRAID emhttpd: /mnt/disk8 mount error: Wrong or no file system I can tell that this probably has something to do with the xfs recovery logs being corrupt as if I bypass them I am able to mount it (I've only done ro mounts as to not further mess with the data). In doing my mount, I can see that my data appears intact on the disk: root@UNRAID:~# cryptsetup luksOpen /dev/sdp1 decrypted_disk Enter passphrase for /dev/sdp1: root@UNRAID:~# mount -o ro,norecovery /dev/mapper/decrypted_disk /tmp/recovery/ root@UNRAID:~# ls /tmp/recovery/ Lxxxxs/ Nxxxxxd/ Wxxxxs/ WxxxxM/ bxxxxs/ mxxc/ pxxxxs/ pxxxx/ sxxxxxxr/ system/ wxxxxs/ yxxxxxl/ I'm guessing the first thing I should do is make a copy of this disk. But I'm also wondering if there's a faster avenue I can take while still keeping my data intact. How do I get out of this state? It should be noted that I think this was caused by an unclean shutdown at some point, I had a couple as I had a bad NIC that was freezing up my system. Please ignore me messing with my new NIC this morning, I have that working at least. On top of that, my power went out last night but luckily I had syslog mirroring enabled as I expected issues. If this mirrored syslog is needed, let me know. Otherwise, I've provided my diagnostics. To be clear, the GUI does ask me if I want to format it, which I obviously do not want to do here. For future readers, do not format the disk if it's in this state, for two reasons: the data could still be there (as it is in my case) and a format would make parity invalid and thus make your disk not-recoverable. I wish Unraid was able to detect corrupt xfs logs and disable formatting for that reason. Anyway, thanks in advance for your help! ETA: I was curious to see how much data was on this disk, which helps me both feel better (since the data appears to be mostly there, if not all of it) and worse (since it's so much data): UNRAID:~# du -sh /tmp/recovery 13T /tmp/recovery
-
I had this issue recently, where I was unable to unmount /mnt/cache even though all docker and VM services were stopped (as confirmed by `ps aux`). It turned out that the docker image was still mounted and this did the trick: umount /var/lib/docker Once I did that, it was able to unmount the cache immediately.
-
Just wanted to post saying that this saved me countless hours of backup recovery. Thank you so much @JorgeB! I was about to wipe and start fresh.


