


JudMeherg
Members
-
Joined
-
Last visited
-
The rebuild completed no problem! Thank you so much @JorgeB and @itimpi!!!
-
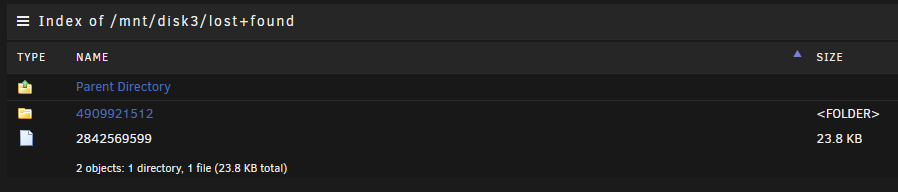
Well there was one file and one directory. No idea what the file is and its tiny. Like I said the directory was empty.
-
That did the trick! From what we can tell everything restored as expected. A directory ended up in the list and found, but it was empty. I have a replacement drive in the mail and the replacement process looks relatively straightforward in the docs. Thanks a bunch!
-
Complete, next steps? Stop array and start without maintenance mode? Phase 1 - find and verify superblock... Phase 2 - using internal log - zero log... ALERT: The filesystem has valuable metadata changes in a log which is being destroyed because the -L option was used. - scan filesystem freespace and inode maps... clearing needsrepair flag and regenerating metadata out-of-order cnt btree record 99 (50076624 12) block 0/2 out-of-order cnt btree record 100 (51519922 8) block 0/2 out-of-order cnt btree record 101 (60083458 15) block 0/2 out-of-order cnt btree record 102 (59420978 15) block 0/2 invalid length 0 in record 103 of cnt btree block 0/2 out-of-order cnt btree record 104 (56031360 17) block 0/2 block (0,59420978-59420992) multiply claimed by cnt space tree, state - 2 block (0,60083458-60083472) multiply claimed by cnt space tree, state - 2 agf_freeblks 126788907, counted 126788903 in ag 0 inode chunk claims used block, inobt block - agno 2, bno 77226352, inopb 8 agi_freecount 18, counted 16 in ag 0 agi_freecount 18, counted 16 in ag 0 finobt inode chunk claims used block, finobt block - agno 2, bno 77226352, inopb 8 sb_icount 5120, counted 5184 sb_ifree 52, counted 71 sb_fdblocks 423499337, counted 428611887 - found root inode chunk Phase 3 - for each AG... - scan and clear agi unlinked lists... - process known inodes and perform inode discovery... - agno = 0 data fork in ino 132585331 claims free block 42796424 data fork in ino 348176718 claims free block 51519922 data fork in ino 348176718 claims free block 50076624 data fork in ino 354964096 claims free block 56031360 - agno = 1 data fork in ino 2842569599 claims free block 355368246 attr fork in ino 2842569599 claims free block 355321188 correcting imap - agno = 2 imap claims a free inode 4909921513 is in use, correcting imap and clearing inode cleared inode 4909921513 imap claims a free inode 4909921514 is in use, correcting imap and clearing inode cleared inode 4909921514 imap claims a free inode 4909921515 is in use, correcting imap and clearing inode cleared inode 4909921515 imap claims a free inode 4909921516 is in use, correcting imap and clearing inode cleared inode 4909921516 imap claims a free inode 4909921517 is in use, correcting imap and clearing inode cleared inode 4909921517 imap claims a free inode 4909921518 is in use, correcting imap and clearing inode cleared inode 4909921518 imap claims a free inode 4909921519 is in use, correcting imap and clearing inode cleared inode 4909921519 imap claims a free inode 4909921520 is in use, correcting imap and clearing inode cleared inode 4909921520 imap claims a free inode 4909921521 is in use, correcting imap and clearing inode cleared inode 4909921521 imap claims a free inode 4909921522 is in use, correcting imap and clearing inode cleared inode 4909921522 imap claims a free inode 4909921523 is in use, correcting imap and clearing inode cleared inode 4909921523 imap claims a free inode 4909921524 is in use, correcting imap and clearing inode cleared inode 4909921524 imap claims a free inode 4909921525 is in use, correcting imap and clearing inode cleared inode 4909921525 imap claims a free inode 4909921526 is in use, correcting imap and clearing inode cleared inode 4909921526 imap claims a free inode 4909921527 is in use, correcting imap and clearing inode cleared inode 4909921527 imap claims a free inode 4909921528 is in use, correcting imap and clearing inode cleared inode 4909921528 imap claims a free inode 4909921529 is in use, correcting imap and clearing inode cleared inode 4909921529 imap claims a free inode 4909921530 is in use, correcting imap and clearing inode cleared inode 4909921530 imap claims a free inode 4909921531 is in use, correcting imap and clearing inode cleared inode 4909921531 imap claims a free inode 4909921532 is in use, correcting imap and clearing inode cleared inode 4909921532 imap claims a free inode 4909921533 is in use, correcting imap and clearing inode cleared inode 4909921533 imap claims a free inode 4909921534 is in use, correcting imap and clearing inode cleared inode 4909921534 imap claims a free inode 4909921535 is in use, correcting imap and clearing inode cleared inode 4909921535 - agno = 3 correcting imap - process newly discovered inodes... 14ffececd680: Badness in key lookup (length) bp=(bno 0x11831dd88, len 4096 bytes) key=(bno 0x11831dd88, len 16384 bytes) 14ffececd680: Badness in key lookup (length) bp=(bno 0x11831dda8, len 4096 bytes) key=(bno 0x11831dda8, len 16384 bytes) imap claims a free inode 6747939584 is in use, correcting imap and clearing inode cleared inode 6747939584 found inodes not in the inode allocation tree Phase 4 - check for duplicate blocks... - setting up duplicate extent list... - check for inodes claiming duplicate blocks... - agno = 0 - agno = 2 - agno = 1 - agno = 3 entry "Ted.Lasso.S03E08.WEBRip.x264-ION10.mp4" in shortform directory 4909921512 references free inode 4909921513 junking entry "Ted.Lasso.S03E08.WEBRip.x264-ION10.mp4" in directory inode 4909921512 corrected i8 count in directory 4909921512, was 3, now 2 entry "2_English.srt" at block 0 offset 96 in directory inode 6747042357 references free inode 6747042358 clearing inode number in entry at offset 96... entry "3_English.srt" at block 0 offset 128 in directory inode 6747042357 references free inode 6747042359 clearing inode number in entry at offset 128... entry "4_Arabic.srt" at block 0 offset 160 in directory inode 6747042357 references free inode 6747042360 clearing inode number in entry at offset 160... entry "5_Bulgarian.srt" at block 0 offset 184 in directory inode 6747042357 references free inode 6747042361 clearing inode number in entry at offset 184... entry "6_Chinese.srt" at block 0 offset 216 in directory inode 6747042357 references free inode 6747042362 clearing inode number in entry at offset 216... entry "7_Chinese.srt" at block 0 offset 248 in directory inode 6747042357 references free inode 6747042363 clearing inode number in entry at offset 248... entry "8_Chinese.srt" at block 0 offset 280 in directory inode 6747042357 references free inode 6747042364 clearing inode number in entry at offset 280... entry "9_Czech.srt" at block 0 offset 312 in directory inode 6747042357 references free inode 6747042365 clearing inode number in entry at offset 312... entry "10_Danish.srt" at block 0 offset 336 in directory inode 6747042357 references free inode 6747042366 clearing inode number in entry at offset 336... entry "11_Dutch.srt" at block 0 offset 368 in directory inode 6747042357 references free inode 6747042367 clearing inode number in entry at offset 368... entry "12_Estonian.srt" at block 0 offset 392 in directory inode 6747042357 references free inode 6747939584 clearing inode number in entry at offset 392... entry "13_Spanish.srt" at block 0 offset 424 in directory inode 6747042357 references free inode 6747939585 clearing inode number in entry at offset 424... entry "14_Finnish.srt" at block 0 offset 456 in directory inode 6747042357 references free inode 6747939586 clearing inode number in entry at offset 456... entry "15_French.srt" at block 0 offset 488 in directory inode 6747042357 references free inode 6747939587 clearing inode number in entry at offset 488... entry "16_French.srt" at block 0 offset 520 in directory inode 6747042357 references free inode 6747939588 clearing inode number in entry at offset 520... entry "17_German.srt" at block 0 offset 552 in directory inode 6747042357 references free inode 6747939589 clearing inode number in entry at offset 552... entry "18_Greek.srt" at block 0 offset 584 in directory inode 6747042357 references free inode 6747939590 clearing inode number in entry at offset 584... entry "19_Hebrew.srt" at block 0 offset 608 in directory inode 6747042357 references free inode 6747939591 clearing inode number in entry at offset 608... entry "20_Hindi.srt" at block 0 offset 640 in directory inode 6747042357 references free inode 6747939592 clearing inode number in entry at offset 640... entry "21_Hungarian.srt" at block 0 offset 664 in directory inode 6747042357 references free inode 6747939593 clearing inode number in entry at offset 664... entry "22_Indonesian.srt" at block 0 offset 696 in directory inode 6747042357 references free inode 6747939594 clearing inode number in entry at offset 696... entry "23_Italian.srt" at block 0 offset 728 in directory inode 6747042357 references free inode 6747939595 clearing inode number in entry at offset 728... entry "24_Japanese.srt" at block 0 offset 760 in directory inode 6747042357 references free inode 6747939596 clearing inode number in entry at offset 760... entry "25_Korean.srt" at block 0 offset 792 in directory inode 6747042357 references free inode 6747939597 clearing inode number in entry at offset 792... entry "26_Spanish.srt" at block 0 offset 824 in directory inode 6747042357 references free inode 6747939598 clearing inode number in entry at offset 824... entry "27_Latvian.srt" at block 0 offset 856 in directory inode 6747042357 references free inode 6747939599 clearing inode number in entry at offset 856... entry "28_Lithuanian.srt" at block 0 offset 888 in directory inode 6747042357 references free inode 6747939600 clearing inode number in entry at offset 888... entry "29_Malay.srt" at block 0 offset 920 in directory inode 6747042357 references free inode 6747939601 clearing inode number in entry at offset 920... entry "30_Norwegian.srt" at block 0 offset 944 in directory inode 6747042357 references free inode 6747939602 clearing inode number in entry at offset 944... entry "31_Polish.srt" at block 0 offset 976 in directory inode 6747042357 references free inode 6747939603 clearing inode number in entry at offset 976... entry "32_Portuguese.srt" at block 0 offset 1008 in directory inode 6747042357 references free inode 6747939604 clearing inode number in entry at offset 1008... entry "33_Portuguese.srt" at block 0 offset 1040 in directory inode 6747042357 references free inode 6747939605 clearing inode number in entry at offset 1040... entry "34_Russian.srt" at block 0 offset 1072 in directory inode 6747042357 references free inode 6747939606 clearing inode number in entry at offset 1072... entry "35_Slovak.srt" at block 0 offset 1104 in directory inode 6747042357 references free inode 6747939607 clearing inode number in entry at offset 1104... entry "36_Slovenian.srt" at block 0 offset 1136 in directory inode 6747042357 references free inode 6747939608 clearing inode number in entry at offset 1136... entry "37_Swedish.srt" at block 0 offset 1168 in directory inode 6747042357 references free inode 6747939609 clearing inode number in entry at offset 1168... entry "38_Tamil.srt" at block 0 offset 1200 in directory inode 6747042357 references free inode 6747939610 clearing inode number in entry at offset 1200... entry "39_Telugu.srt" at block 0 offset 1224 in directory inode 6747042357 references free inode 6747939611 clearing inode number in entry at offset 1224... entry "40_Thai.srt" at block 0 offset 1256 in directory inode 6747042357 references free inode 6747939612 clearing inode number in entry at offset 1256... entry "41_Turkish.srt" at block 0 offset 1280 in directory inode 6747042357 references free inode 6747939613 clearing inode number in entry at offset 1280... entry "42_Ukrainian.srt" at block 0 offset 1312 in directory inode 6747042357 references free inode 6747939614 clearing inode number in entry at offset 1312... entry "43_Vietnamese.srt" at block 0 offset 1344 in directory inode 6747042357 references free inode 6747939615 clearing inode number in entry at offset 1344... clearing reflink flag on inodes when possible Phase 5 - rebuild AG headers and trees... - reset superblock... Phase 6 - check inode connectivity... - resetting contents of realtime bitmap and summary inodes - traversing filesystem ... bad hash table for directory inode 6747042357 (no data entry): rebuilding rebuilding directory inode 6747042357 - traversal finished ... - moving disconnected inodes to lost+found ... disconnected inode 2842569599, moving to lost+found disconnected dir inode 4909921512, moving to lost+found Phase 7 - verify and correct link counts... resetting inode 354964144 nlinks from 2 to 3 Maximum metadata LSN (6:205563) is ahead of log (1:2). Format log to cycle 9. done
-
Ran and output below: Phase 1 - find and verify superblock... Phase 2 - using internal log - zero log... ERROR: The filesystem has valuable metadata changes in a log which needs to be replayed. Mount the filesystem to replay the log, and unmount it before re-running xfs_repair. If you are unable to mount the filesystem, then use the -L option to destroy the log and attempt a repair. Note that destroying the log may cause corruption -- please attempt a mount of the filesystem before doing this.
-
Hello, Posting a long shot here. I help my dad maintain a server for his media and backup usage. I got a telegram alert that disk 3 was in an errored state. Before I could log into the server later in the day to check it, my dad somehow noticed some files missing and decided to reboot the server. Attached is the diagnostics post reboot, sad I know, but its the best I got. After I grabbed the diagnostic download I shutdown and had him reseat all the drive plugs and boot, but the drive didn't come back. I about 100 media files are missing, not a big deal, they are backup up to my local server and can be reripped, but I expected the parity drive to take over and serve up the files in place of the failed drive. Maybe I have been fundamentally misunderstanding parity in unraid. Thanks in advance for any time spend helping! tower-diagnostics-20250127-1814.zip
-
Amazing! Simply amazing this has been updated again! Thanks for all the hard work. Now its time to see if it can be translated to a Jellyfin/Jellystat version. Thanks for all the hard work falcon!
-
For some reason "docker exec -it paperless_ngx-webserver-1 document_exporter ../export". I guess the -i flag made all the difference. Thank you for pointing this point! You are right it should point to the export folder mounted inside the container.
-
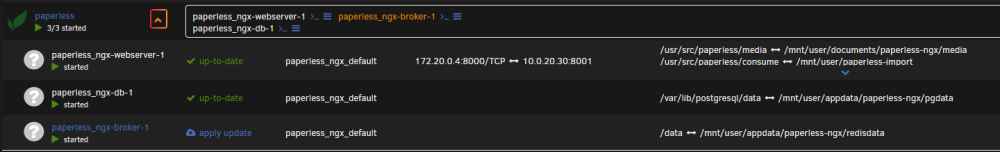
Thank you for the reply! I had tried your suggestion, maybe I should have added more information. Here are the results of docker compose ls root@Tower:~# docker compose ls NAME STATUS CONFIG FILES immich running(8) /boot/config/plugins/compose.manager/projects/immich/docker-compose.yml,/boot/config/plugins/compose.manager/projects/immich/docker-compose.override.yml paperless_ngx running(3) /boot/config/plugins/compose.manager/projects/paperless-ngx/docker-compose.yml,/boot/config/plugins/compose.manager/projects/paperless-ngx/docker-compose.override.yml This is a screenshot of the stack folder: And here are a few more ways I have tried to run the command: root@Tower:~# docker compose -f '/boot/config/plugins/compose.manager/projects/paperless-ngx/docker-compose.yml' exec -T paperless_ngx-webserver-1 document_exporter /mnt/user/backup/paperless-ng service "paperless_ngx-webserver-1" is not running root@Tower:~# docker compose -f '/boot/config/plugins/compose.manager/projects/paperless-ngx/docker-compose.yml' exec -T webserver-1 document_expo rter /mnt/user/backup/paperless-ng service "webserver-1" is not running root@Tower:~# docker compose exec -T paperless_ngx-webserver-1 document_exporter /mnt/user/backup/paperless-ng no configuration file provided: not found Here is my compose file: I am still not sure what I am missing.
-
Hello fair users and awesome developers! Loving the plugin for immich and paperless-ngx! There is just one thing I cannot figure out. On my previous paperless-ngx install via docker compose on ubuntu server I had a cron job running to call the paperless exporter and make a backup of all the files in paperless. #!/bin/sh cd /home/server1/paperless-ng /usr/local/bin/docker-compose exec webserver document_exporter ../export However, I cannot quite get it to work with compose manager on Unraid. Whenever I try to call the webserver document_exporter, docker compose says "service webserver isn't running." root@Tower:/mnt/user/backup# docker-compose -f '/boot/config/plugins/compose.manager/projects/paperless-ngx/docker-compose.yml' exec -T webserver document_exporter ../paperless-ng Or root@Tower:/boot/config/plugins/compose.manager/projects/paperless-ngx# docker compose exec -T webserver document_exporter /mnt/user/backup/paperless-ng Above are the commands I have tried using to call the export, but the same result. Is there some special trick to address a container started via the compose manager?
-
New cable installed. Seems to be fine. tower-diagnostics-20230903-1557-6.12.3.zip
-
Hello, This morning I did my normal update upgrade check on my setup. I went from 6.12.3 to 6.12.4 and was immediately hit with BTRFS errors on the cache drive and docker failures. I rolled back to 6.12.3 thinking it was a update bug, but the errors are still there. It looks like from the forum I am not the only one seeing this pop up recently. I checked my grafana logs and everything was humming right along up until the update. Below is the 6.12.4 diag and the diag after rolling back to 6.12.3. I will be shutting down and running a memtest as soon as I post. Thanks for the assistance. tower-diagnostics-20230903-0808-6.12.4.zip tower-diagnostics-20230903-0827-6.12.3.zip
-
Nope, just tried it again.
-
It's back now.
-
Appfeed failed here too, but dockers updated and I can ping dns and websites from the terminal. I am guessing the feed is down.


