


Renel
Members
-
Joined
-
Last visited
-
I was using a Seagate Terascale and the plastic in and around the SATA connection was so brittle it snapped at some point, but I'm not sure when or how. I'm preclearing a spare drive I had laying around and I'm unsure whether I should replace the failing drive or the drive with the broken SATA connection. I'm leaning on replacing the broken connection because I don't know if I can even get the drive I'd be replacing to connect back to the array. Even if I do, I don't think I would trust the drive to maintain the connection while adding the new drive into the array.
-
since the server was out of service for some time the last flash backups may be a handful of months old so I'm not sure. I think I do have backups of the last time it was powered on if that helps.
-
where would I find the SMART error it gave? I was alerted by the thumbs down 'error' in the SMART column in the dashboard. apologies for the response time. the columns distort when I copy paste. I'm not sure if it's a CRC error, but UDMA CRC error count has a Raw Value of 4 and is orange in the UI. not sure if that is relevant. how would I read this information? this is a Seagate drive. EDIT: upon closer inspection the error on disk1 is in fact a CRC error. I didn't realize you could hover over the 'thumbs down' and see a summary of the error. I will investigate its connections and report back.
-
apologies and thanks for the reminder. the diagnostics: tower-diagnostics-20250228-1246.zip the results to your request: does anything stand out in terms of container allocation in the img?
-
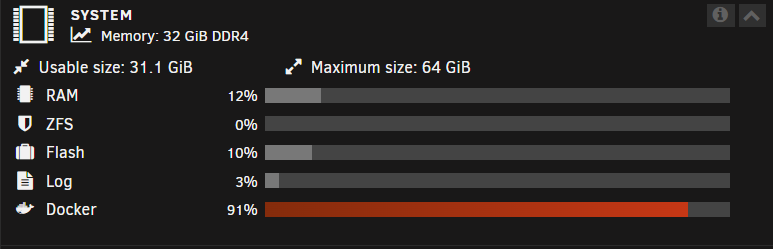
I am rebooting my server after it's been out of service. My docker img size is apparently almost full as depicted in the screenshot below. I don't want to make it bigger if I don't have to. Where can I check the actual size of the docker img file and how can I check the contents of the docker img to see what is filling it so quick? thanks for any insights.
-
I have two drives, Disk 1 (sdd) and Disk 3 (sdf), giving SMART errors. I ran extended SMART tests recently, but I'm having difficulty interpreting the results. the diagnostics: tower-diagnostics-20250228-0911.zip. The drives from the same batch have been replaced recently so I'm assuming these will need a similar treatment. Any opinions and suggestions welcomed.
-
depending on where I start the update, I get an output like this or similar: the diagnostics: tower-diagnostics-20250228-0911.zip are also attached. any analysis would be greatly appreciated. after speaking with others, it was suggested it may be a boot device space issue, but it has almost 15 GB free. I'm rebooting this server after some time out of service for a little more context. thank you
-
Just downloaded these tower-diagnostics-20230407-0107.zip
-
I started an extended SMART test and the text underneath said 10% like it started but when I checked back a minute later the test stopped and I am unable to start another and it says 'no self test logged on this disk'. Is there anything the SMART test would tell me I need to know or could I just rebuild the disk onto itself? is there another way I could run the test or see the logs? tower-smart-20230406-0133.zip
-
I've power cycled it and the new diagnostics are attached. Could this be due to a cable be poorly attached? It wouldn't explain the unusual amount of heat though... tower-diagnostics-20230405-0247.zip
-
I have a disk that just disabled and not sure how to proceed. The disk was giving an overheat notification last night but didn't think much of it. come to check on it today and its disabled. Checking the syslog, at a glance I'm noticing segfault errors and some other stuff I'm not quite sure how to understand. I had an I think unrelated issue a few weeks ago where when I shared my log file, someone noticed segfault errors as well. I memtested the RAM and it came back with 0 errors so I left it at that. not sure how to proceed so I'll post the logs and diagnostics. Any help would be appreciated! tower-diagnostics-20230403-2203.zip tower-syslog-20230404-0402.zip tower-syslog-20230403-2218.zip
-
This is a very strange issue. I had pihole running on my network on a separate raspberry pi. While trying to configure the rpi as a backup server for unraid, it stopped POSTing after a restart so I had to take that raspberry pi offline and factory reset my router. I decided to make my main instance of pihole on unraid. I got the docker running however, when I access the webGUI it comes from the IP address of the raspberry pi I took offline. I didn't configure it to this IP, it's an entirely different one and won't work when I try to access it from the IP address I configure it to. there's even a new device on that IP. One that can't run pihole, it isn't even accessible for SSH. it only opens up on the raspberry pi's IP address even though that device is not on my network anymore. and that IP address got reserved to an smart home device so I shouldn't even be able to access anything on that IP address from my browser. How can I remedy this?
-
can I ask, was it the older pair of RAM?
-
Thank you for your response, it is greatly appreciated during this troubleshooting process. I'm not sure why it would be segfaulting or how I might have initialized that. There doesn't seem to be much consistency in the reasons it happens from what I'm googling. I apologize for the speculation below, just trying to provide some context (and I am a novice). Might it have anything to do with opening an unruly amount of tabs to server via an Android client? 5-6 days ago I posted about a Crucial MX500 SSD that had become inaccessible after putting it into my Unraid server. First it was behaving weird, being recognized by the system intermittently and eventually ended that with the server becoming unresponsive, unable to POST. I'm wondering if that may have damaged my RAM or other components at some point because it made the server go from on to totally off and shut down immediately. I will run Memtest at 3 passes per stick and report back.
-
I managed to capture a diagnostics log file before forcing a shutdown. Per advice from redditor from the reference, I ran /etc/rc.d/rc.nginx restart /etc/rc.d/rc.nginx reload /etc/rc.d/rc.php-fpm restart /etc/rc.d/rc.php-fpm reload I ran these to see if restarting those would bring up the GUI, but instead, it did something to make diagnostics stop hanging, I think. Not sure if anyone has any insights? Thanks for reading tower-diagnostics-20230316-2039.zip
