





aje14700
Members
-
Joined
-
Last visited
-
@Jagar Thanks for posting the link to the sensors.conf changes. I started having the same issue, and I followed the link, and lo and behold, it was I who gave myself the solution 😂. I completely forgot I had this issue before. I guess either in a plugin update or unraid update, that boot sensors.conf file got overwritten, and I no longer had my fix in place.
-
Note for my solution above, if you need to change any settings in System Temp, then the UI will take a while to load as it runs `sensors` without the configuration. Additionally, it'll also overwrite any changes made to that file on save (since it's not aware of our changes). I setup a user script that appends my ignore lines onto the conf and copies to the running configuration in /etc/senors.d so I can manually trigger it if needed.
-
After switching back to 6.12.4, I had 0 issues until about 8 days later. UI would hang and take forever, and 1 logical core was always pegged 100%. HTOP still showed it as "sensors" sucking up CPU. I believe I have figured out the issue. At somepoint, the sensors can no longer read particular attributes from my CPU (`amdgpu-pci-0900`). When running `sensors -A`, this was my output: ~# sensors -A amdgpu-pci-0900 vddgfx: N/A vddnb: N/A edge: N/A PPT: N/A k10temp-pci-00c3 MB Temp: +33.8°C nvme-pci-0800 Composite: +34.9°C (low = -60.1°C, high = +89.8°C) (crit = +94.8°C) And it would take forever on the amdgpu chip. Running with JSON output gave some extra clues: # sensors -j { "amdgpu-pci-0900":{ "Adapter": "PCI adapter", "vddgfx":{ ERROR: Can't get value of subfeature in0_input: Can't read }, "vddnb":{ ERROR: Can't get value of subfeature in1_input: Can't read }, "edge":{ ERROR: Can't get value of subfeature temp1_input: Can't read }, "PPT":{ ERROR: Can't get value of subfeature power1_average: Can't read } }, "k10temp-pci-00c3":{ "Adapter": "PCI adapter", "MB Temp":{ "temp1_input": 33.750 } }, "nvme-pci-0800":{ "Adapter": "PCI adapter", "Composite":{ "temp1_input": 32.850, "temp1_max": 89.850, "temp1_min": -60.150, "temp1_crit": 94.850, "temp1_alarm": 0.000 } } } I ended up modifying `/boot/config/plugins/dynamix.system.temp/sensors.conf` to include the following: chip "amdgpu-pci-0900" ignore "in0" ignore "in1" ignore "temp1" ignore "power1" And then for it to take effect without a reboot, `cp /boot/config/plugins/dynamix.system.temp/sensors.conf /etc/sensors.d/sensor.conf` And once the file copied, the issue immediately went away. So the issue seems to be related to the chip timing out for sensor readings. I'm sure there's a better approach, but hopefully this helps @bwnautilus and anyone else running into this issue.
-
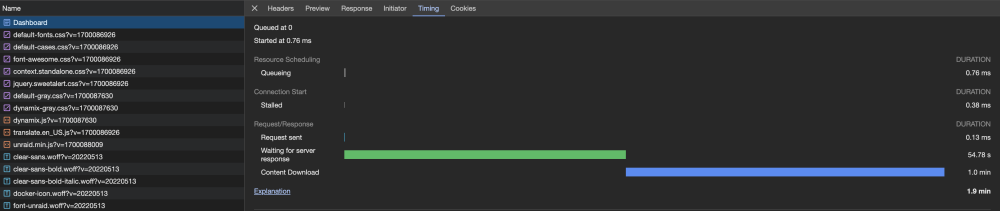
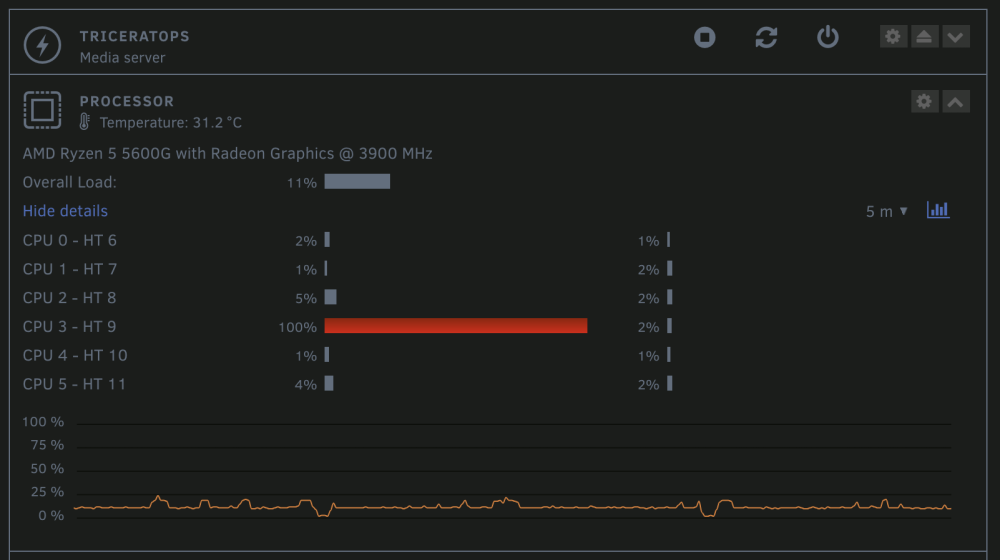
@bwnautilus It seems like I had something similar. My dashboard would take 1-2 minutes to load, and 1 CPU thread would be locked to 100%, the process would die, and then pop back up on a logical CPU. It _seems_ like it was related to CPU temperature monitoring. The process that was locking up the CPU was `sensors`. It would switch between `sensors -A` to `sensors -u -A`, and `sensors -u -c /tmp/sensors.conf`. In trying to turn off CPU temp detection, it would settle down for about 20 seconds, before it started back up. My cpu is an AMD Ryzen 5 5600G, and I'm using the `k10temp` driver. For me, `6.12.4` is fine, but `6.12.6` has this issue. You could try updating to `6.12.4` and see if the issue still occurs, or try disabling CPU temperature sensing (if turned on) before updating.

-
Originally reported as 6.12.3, still occurs on 6.12.4. As the title indicates, mousing over the RAM percentages (such that is shows the absolute size) can spike your CPU quite high. On hover of the RAM percentage, it fires of a POST request to /webGui/include/DashboardApps.php Just doing this once probably won't be noticeable. However if you constantly mouse over these, it'll spike your CPU quite high, for me it almost pegs to 100%. Reproduction: Goto dashboard Have both CPU graph and RAM chart open and visible Mouse over the RAM percentages rapidly Observe CPU usage increase dramatically (depending on CPU, potentially 100% usage) Attached is a video of it occurring, and my diagnostics. Screen Recording 2023-08-02 at 11.32.59 PM.mov unraid-diagnostics-20230803-1310.zip


