

Fredrick
-
Posts
173 -
Joined
-
Last visited
Content Type
Profiles
Forums
Downloads
Store
Gallery
Bug Reports
Documentation
Landing
Everything posted by Fredrick
-
Very unstable read/write speads during parity sync
Fredrick replied to Fredrick's topic in General Support
Just wanted to update here with my latest parity sync (when removing the Seagate and adding the WD as parity): Note that I'm preclearing the Seagate in parallell here, hence the high amount of write. The drop i write is when preclear finished. Its clear that I'm hitting the limits of the SAS expander link for the first half or so. As far as I can tell I would be hitting this limit only during parity checks as the amount of sequential read is not normal for my array in other cases. The array was under load for some of the preclear+sync aswell, and for the most part seemed to work well under this stress. As I have two EXP3000 and currently just use one of them, I'm thinking I could move half of my drives to the other one to practically double the available speed. I'd be limited when adding more drives, but thats a problem for tomorrow. Optionally I could move my cache+Unassigned SSD to the other EXP3000 and get S.M.A.R.T. and diagnostics for those instead. Thoughts?
-
Very unstable read/write speads during parity sync
Fredrick replied to Fredrick's topic in General Support
Fine Script cancelled, and I went with your values. I tried a new parity check, again without docker and VM running, this time also without any shares. Basically it should just be running the system and plugins. I let it run for 10 minutes, and this is what it looks like: First of all, the maximum speed is higher with the new tunables. I'm very pleased with that! Furthermore the speeds seems to be much more stable and without the dips we saw previously. There are still a small amount of writes going on, would this be from plugins? Next on my agenda is to swap Parity 1 for the unassigned Red, which means doing a full parity sync. I'll probably start this process in a couple hour or so if there is nothing more to test here. I guess I could start docker/VM/shares again and repeat to make sure. I cant have all my services stopped each time I'm checking parity. I also see the P410 controller in my Proliant is not ideal as it doesnt support JBOD. I could move my SSDs outside to a separate HBA. This would mean I'd get full speeds and SMART info on these drives aswell.


-
Very unstable read/write speads during parity sync
Fredrick replied to Fredrick's topic in General Support
Wouldn't it still give better results than the "universal" tunables you posted? I'm running the revised script from squid posted here: -
Very unstable read/write speads during parity sync
Fredrick replied to Fredrick's topic in General Support
How can I find out what this was? Does it say in a log? I dont know what it could be. Tunables script running now:
-
Very unstable read/write speads during parity sync
Fredrick replied to Fredrick's topic in General Support
Also my parity check history: Further underlining the chaotic mess of the performance. Note that its just the last one from 28.09.2017 that were with my current configuration with EXP3000. Previously the drives were attached to my HBA with SATA breakout cables. I'm running tunables tester now, so I wont have any news for a couple of hours.
-
Very unstable read/write speads during parity sync
Fredrick replied to Fredrick's topic in General Support
Deluge (I know can be a pain to the array..), Plex, PlexPy, Radarr, Sonarr, NZBHydra, Jackett, NZBGet, LetsEncrypt, Organizr, one Win10-VM. Most of these are idling. ----------- Alright, some more data! Diskspeed with array stopped looks very much the same as before: My cache drive (and the Logical Volume) refuses to test beyond 0gb. Might be a bug with the script? Here is my parity check with docker/VM disabled after 10 minutes. There are writes here that I have no clue what would be. Note that there is no sync errors corrected, and that there is also reads from cache and writes to the USB-boot drive. I cleared the statistics, and here is the view after another 10 minutes. More writes here, but not to all drives.


-
Very unstable read/write speads during parity sync
Fredrick replied to Fredrick's topic in General Support
Great news, thanks Coming right up. I'll start array but shut down dockers/VMs so its quiet and let it run for 15-20 minutes to see if there are any odd writes. Just gonna let the current diskspeed test finish. Suggestions? I've only got one SFF-8088 cable, but have ordered a second one (from China so its gonna be a few weeks). I've got another HBA I could test with, or I could move my current HBA to another PCIe slot. None of these would explain the poor performance on internal drives on the P410 controller. Shouldn't I be getting SMART and other data from these drives? Also, this is not a test set up, my server is very much in a live environment where it is running services for a couple of users, in addition to hosting my home automation system. Any downtime is unwanted ^^ -
Very unstable read/write speads during parity sync
Fredrick replied to Fredrick's topic in General Support
One more bit of information. Several of my drives are very full. Could this be a problem? I read conflicting reports, and until recently my array was pretty full overall. I could move some data around if that can help these speeds.
-
Very unstable read/write speads during parity sync
Fredrick replied to Fredrick's topic in General Support
Well, here are some more odd results. Please note, this is with the array started, I'm running further tests now with it stopped. Currently running 2% slices on all drives in normal mode with array stopped. Cache drive and the unassigned "LOGICAL VOLUME" are attached through the internal raid controller in my Proliant (no S.M.A.R.T. available). All other drives are via the LSI card and in the same EXP3000. This is with Fast Mode enabled: Drive Identification Parity: ST8000AS0002-1NA17Z Z840FDHA 8 TB 159 MB/sec avg Parity 2: WDC WD80EFZX-68UW8N0 VK1BX6DY 8 TB 152 MB/sec avg Disk 1: ST8000AS0002-1NA17Z Z840YYKD 8 TB 157 MB/sec avg Disk 2: ST8000AS0002-1NA17Z Z840SGX9 8 TB 155 MB/sec avg Disk 3: ST4000VN008-2DR166 ZDH0SQDZ 4 TB 163 MB/sec avg Disk 4: ST4000VN000-1H4168 Z300Q4G4 4 TB 143 MB/sec avg Disk 5: WDC WD80EFAX-68LHPN0 7SGEPSXC 8 TB 159 MB/sec avg Disk 6: WDC WD80EFAX-68LHPN0 7SGE58EC 8 TB 160 MB/sec avg Cache: LOGICAL_VOLUME_50014380236B8AE0_3600508b1001ce64db334f5dc2199a3d0 229 MB/sec avg sdb: Unable to determine 228 MB/sec avg sdh: WDC WD80EFZX-68UW8N0 VK1BEXEY 8 TB 151 MB/sec avg Generated on Tower at Fri Sep 29 07:04:42 CEST 2017 Drives scanned 1 time every 1.0% This is normal mode, and with 2% slices. Drive Identification Parity: ST8000AS0002-1NA17Z Z840FDHA 8 TB 160 MB/sec avg Parity 2: WDC WD80EFZX-68UW8N0 VK1BX6DY 8 TB 150 MB/sec avg Disk 1: ST8000AS0002-1NA17Z Z840YYKD 8 TB 156 MB/sec avg Disk 2: ST8000AS0002-1NA17Z Z840SGX9 8 TB 155 MB/sec avg Disk 3: ST4000VN008-2DR166 ZDH0SQDZ 4 TB 163 MB/sec avg Disk 4: ST4000VN000-1H4168 Z300Q4G4 4 TB 143 MB/sec avg Disk 5: WDC WD80EFAX-68LHPN0 7SGEPSXC 8 TB 157 MB/sec avg Disk 6: WDC WD80EFAX-68LHPN0 7SGE58EC 8 TB 158 MB/sec avg Cache: LOGICAL_VOLUME_50014380236B8AE0_3600508b1001ce64db334f5dc2199a3d0 n/a sdb: Unable to determine n/a sdh: WDC WD80EFZX-68UW8N0 VK1BEXEY 8 TB 149 MB/sec avg Generated on Tower at Thu Sep 28 23:40:35 CEST 2017 Drives scanned 1 time every 2.0% Now first of all I feel these lines are all "jagged", but no clear drive with bad/slow sectors. The average speeds seems decent overall with disk 4 lagging behind a bit. Secondly. What is going on with my SSDs? The Cache and Logical Volume (both Kingston SSD Now, 240gb and 120gb respectively) show 228/229MB/s which is very low. Furthermore they seem to start and stop at 0gb. I'll test this some more aswell. And third, my parity 2 drive seems to be slower than my other Reds, and has a much more jagged look than the other drives.
.thumb.png.adce65e2d608c9fc25dabbbf84db6b59.png)
-
Very unstable read/write speads during parity sync
Fredrick replied to Fredrick's topic in General Support
I'll update later with the results of the Diskspeed test. Do I need more iterations aswell? I feel 1 iteration is very vulnerable to anything going on and can give false results. -
Very unstable read/write speads during parity sync
Fredrick replied to Fredrick's topic in General Support
Thanks, I've got the plugin installed, and that is what I was planning on doing I'll keep the 4tb outside the testing for now as its clear the problem persisted throughout the whole 8tb. -
Very unstable read/write speads during parity sync
Fredrick replied to Fredrick's topic in General Support
How can I troubleshoot? Repeated read speed tests on each drive? Short/Extended self test would not reveal this? Oh, and btw. During preclear of my Parity 2 drive (and the other Red sitting as unassigned currently) the speeds were steady all the through. Both pre/post-read and during write. EDIT2: Finished! Sep 28 22:14:12 Tower kernel: md: sync done. time=114278sec Sep 28 22:14:12 Tower kernel: md: recovery thread: completion status: 0 So thats pretty spot on 70MB/s -
Very unstable read/write speads during parity sync
Fredrick replied to Fredrick's topic in General Support
Yes, as I said its fairly unstable. I should probably have opened with that graph instead. Does not seem to be the problem. I'm still seeing a lot of spikes between about 450MB/s total read and 150MB/s total read. There has been no other writes to the array/parity since i cleared statistics almost an hour ago.
-
Very unstable read/write speads during parity sync
Fredrick replied to Fredrick's topic in General Support
Glad to hear it!
-
Very unstable read/write speads during parity sync
Fredrick replied to Fredrick's topic in General Support
The Seagate Archive drives? I know they are not ideal, but they were so much cheaper here in Norway when I bought them Anything I can do to make things better? BTW, I'm replacing the archive parity with a Red now, but letting it build parity to second drive first. (going from 1 Seagate Archive Parity drive to two Reds) -
Very unstable read/write speads during parity sync
Fredrick replied to Fredrick's topic in General Support
The write numbers are the same 10 minutes later if that matters, the system stats graph still looks just as spikey -
Very unstable read/write speads during parity sync
Fredrick replied to Fredrick's topic in General Support
This is after a couple minutes (do you need exact time?) Currently one stream going to Plex, apparently from Disk 1. Also Parity sync is at 97,6%, so the 4tb are done.
-
Very unstable read/write speads during parity sync
Fredrick replied to Fredrick's topic in General Support
HP Proliant ML350 G6, 2x Xeon X5650. LSI SAS 9201-16e. Tunables are default. All drives are run through a single SAS cable to my EXP3000 as we discussed in another thread. The server has been very quiet during this sync, and no larger operations to suggest what we are seeing. There are some reads here and there, but not a lot, and not for the whole day as the stats have showed. No writes in the time i pasted stats for. "Clear statistics"? As in the reset button in the stats page? Here is the past 5 minutes after clearing stats.
-
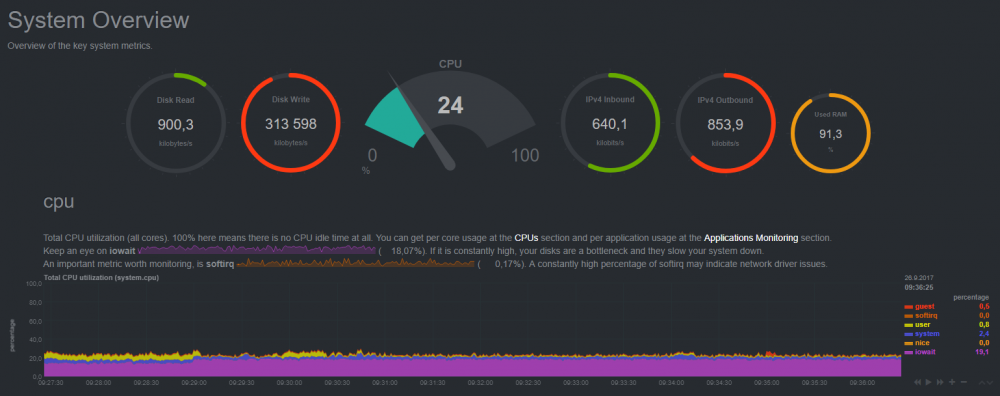
Hi, I've added a parity drive, and it is currently doing the sync for the new drive. The overall speeds seems to me to be decent at about 70MB/s (should I be expecting more?), but with the system stats plugin I get this view: Is this normal? It seems the overall speed is going down as I'm nearing the inner part of the drives, which I understand is expected. I'll be running some tests on the drives and the tunables tester after the parity sync to see if anything seems wierd. Here is also a view of my drives:


-
Why do I get iowait from preclearing drives?
Fredrick replied to Fredrick's topic in General Support
So it wouldnt slow down operations going to/from the array/cache? -
Why do I get iowait from preclearing drives?
Fredrick replied to Fredrick's topic in General Support
I'm bumping this. My preclear is now finished, but I'm still curious why this is. Controller-bottleneck? I dont see how with that little activity going on other than the preclear (which, granted, is heavy on the controller). I've got a LSI SAS 9201-16e HBA -
Hi, I'm trying to understand the iowait measurement, and afaik it means the processor waits on the drives to complete its operations. What I dont understand is why I'm getting iowait from preclearing drives? These are not part of the array/cache, and shouldnt be bothering the CPU during normal operations? Other than preclear there is not much going on atm. I've got several dockers that are just idling
-
NZBget and Radarr/Sonarr workflow to ease the pain on array
Fredrick replied to Fredrick's topic in General Support
Trying to bump this for visibility. One option would perhaps be to switch my cache from my current SSD, and rather pull 2 Ironwolf 4tb from the array and set it up as Raid0 for performance. This way I can also have my Media share set to use cache, and the array would stay calm during most writes. I could use my current SSD-cache as an unassigned drive, and have my VMs and dockers run from that. Additionally, I could have NZB-get use it as a download-folder, and then extract to cache. I know this would reduce redundancy on my media-share as files would be unprotected until mover runs, but the way I see it would give me some significant benefits over todays solution. Having a raid0 cache would increase risk of the files on the cache, but as long as this is easily replaced files I'm willing to take that risk. Any other drawbacks of this solution? -
Need advice for DAS for my drives
Fredrick replied to Fredrick's topic in Storage Devices and Controllers
That is very clear, thank you! And just to confirm, this is more than what is available through the SAN-controllers? Also with 8 lanes on the PCIe2.0 slot, this means I can run both EXP3000 from my single LSI SAS-9201 16e without having a new bottleneck. Right? (PCIe 2.0 x8 at 40Gb/s single direction) -
Need advice for DAS for my drives
Fredrick replied to Fredrick's topic in Storage Devices and Controllers
Thanks for getting back to me Unraid says this under Identity for the drives: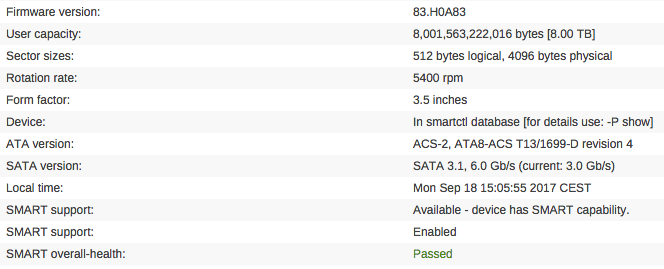


.png.56192a29f1ba946cb46f4e8700dacb9a.png)


