Fredrick
-
Posts
173 -
Joined
-
Last visited
Content Type
Profiles
Forums
Downloads
Store
Gallery
Bug Reports
Documentation
Landing
Everything posted by Fredrick
-
Disk disabled - Need help going through logs/smart-report
Fredrick replied to Fredrick's topic in General Support
Thanks, Extended test just completed, also without finding any errors. Drives are in a expander-enclosure, so other than trying another bay there is not much I can do wrg cabling. The SAS-cable is shared with other drives, so that should have disconnected multiple drives. Dual PSU aswell. -
Disk disabled - Need help going through logs/smart-report
Fredrick posted a topic in General Support
Hi guys, One of my drives had several read & write failures the other day, and I was unable to get any SMART-report for the drive. Diagnostics attached. Rebooted, and I'm getting SMART-info now, this has also been attached. The short self test ran fine, running the long one now. Is there anyone that can have a look at the logs and see anything there? Thanks! tower-smart-20171219-1417.zip tower-diagnostics-20171218-1702.zip -
But that means you have it on Y-axis 1, how does that work when its using temperature? Spin seems to be "30" when its spinning, did you just multiply it to make it look like this?
-
Well, in conclusion I fucked my previous Plex container good, so I made the switch without moving any config/database Was a bit of a pain, worst thing is loosing watched status I guess. A rescan takes time, but not too bad.
-
How do you get the disk spin state to plot like this? Seems like you have three Y-axis? I'm trying to plot a thermostat like this where temp/humidity are Y1 and Y2, but I want the on/off state of heater to be plotted like your spin state here
-
#ORGANIZR UPSTREAM upstream organizr-upstream { #This is the local ip and port to Organizr server 192.168.1.7:9512; keepalive 32; } And in the main server block: #Custom Organizr error pages error_page 400 401 402 403 404 500 502 /error.php?error=$status; #Authentication location /auth-admin { internal; proxy_pass http://192.168.1.7:9512/auth.php?admin; proxy_set_header Content-Length ""; } location /auth-user { internal; proxy_pass http://192.168.1.7:9512/auth.php?user; proxy_set_header Content-Length ""; } #ORGANIZR CONTAINER location / { proxy_pass http://organizr-upstream; include /config/nginx/proxy.conf; }
-
NZBget and Radarr/Sonarr workflow to ease the pain on array
Fredrick replied to Fredrick's topic in General Support
Just to update, I'm very pleased with downloading and extracting to an unassigned drive. The extraction speed is noticeably slower (especially when still downloading), but I was able to have two transcodes of Bluray Remuxes + one Remux direct stream going while downloading and extracting. The WebUI and all streams went flawlessly -
NZBget and Radarr/Sonarr workflow to ease the pain on array
Fredrick replied to Fredrick's topic in General Support
AFAIK this is the "wrong" way to set amount of connections as each connection brings a bit of overhead "cost" in CPU-cycles. You should set your connections to the least amount that still saturates your 250mbps connection. I'm using 25 connections to my main provider, and it fills my 500mbps connection just fine. Having anything more than 25 connections is actually less efficient. I'm getting a 2tb Barracuda tomorrow which will serve as my unassigned-downloads+extraction-disk. Hopefully this will prove a better solution than downloading to my 240gb cache-SSD. (Downloads might not extract as fast, but it will put less strain on my SSD with all docker appdata+VM etc located there. 240gb (minus docker.img, appdata and VMs) is simply not enough when downloading several items consecutively or when grabbing larger 4K-content where the .rars and extracted mkv can total about 150gb alone. -
NZBget and Radarr/Sonarr workflow to ease the pain on array
Fredrick replied to Fredrick's topic in General Support
NSP? Newsgroup? I'm mainly on Ninja, main server is their DE-server. I havent changed that setting, and I fully saturate my 500mbit connection. Under each provider (I have a few block-providers aswell) I've set how many connection to each provider, are you saying this is limited by the total number from "Urlconnections = 4"? The setting information seem to indicate this amount of connections is just to download the actual NZB-file. -
[Plugin] CA Appdata Backup / Restore - Deprecated
Fredrick replied to Squid's topic in Plugin Support
Gonna answer myself here. I booted in safe-mode and removed the previous backup using midnight commander. It gives you actual progress information, so its easier to see if things are stuck. Each Plex-backup was between 250.000-320.000 files/directories (with 15.000 items in my library..), so deleting each one took a lot of time. This seems very inefficient of Plex, but is also outside the scope of this discussion I guess. Also note this has nothing to do with this plugin, but is a result of how Plex stores cache/metadata/media for its library. -
[Plugin] CA Appdata Backup / Restore - Deprecated
Fredrick replied to Squid's topic in Plugin Support
Did you find a solution to this? I've got the same symptoms, load going through the roof, unresponsive http UI, poor performance on IO. How did you get iostat installed? I've since tried to delete the original backups, but that resulted in a full freeze like @Harro and @cowboytronic. Is the only way to format the affected drives? -
Anyone got a quick rundown of how to swith from LinuxIO to Binhex?
-
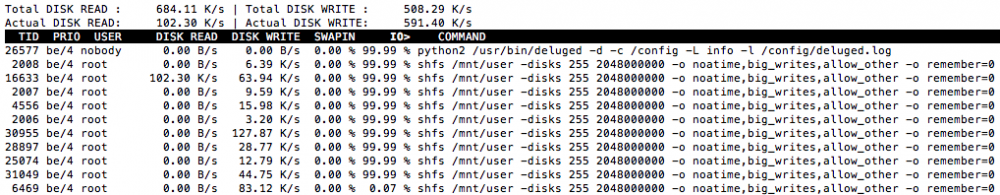
Sorry bout this second bump, but I'm still stuck, and cant find much about this at all. There are about 1 million reads and writes to my cache drive per 24h that I cant "account" for. Some is obviously just normal docker traffic, but this is extremely excessive. The load seems to have calmed down after a reboot, but I still suspect this will go to 100% after some uptime.. As it seems the shfs process is associated with user shares, I tried to "move" (just changed the docker settings) docker.img from /mnt/user/system to /mnt/cache/system, and likewise change all container paths to /mnt/cache/appdata instead of the usual /mnt/user/appdata. This did not work, and I saw the same shfs activity. I also tried copying (through ssh with docker stopped) docker.img to an unassigned drive, but the process was unable to complete. I also tried the following fuser command to see the various accesses, and shfs is not the only thing accessing my drives, I've got a lot of nginx for some reason. My /mnt/disks/HP_LOGICAL_VOLUME is my unassigned drive, but why every PID possible is accessing /mnt/disks I dont know..
-
Anyone have ideas here? I tested some more with shutting down containers, and the load/activity seems to correspond with how many files are accessed by Docker containers. It doesnt stop until all containers are shut down, but it does get (slightly) better for each container stopped. I've tried with/without cache dir plugin enabled (also tried removing it). The past 12 hours I've had about 1.5million writes to my cache drive, without actually doing much of it intentionally.. Most of my searching on the issue points to some older Unraid versions, so not sure how applicable it is. I was on 6.4 rc9 when I posted the diagnostics, went back to 6.3.5, but still have the same issue.
-
Hi, I've run into a problem with a process shfs that has a lot of files open, and it wont calm down. There are currently 146 files open, most of them are in /cache/appdata. I had this yesterday aswell, and was unable to kill the process or to shut down the system in any reasonable way. Had to hold the button unfortunately, and the parity check just finished OK. I'm seeing i/o-wait times for my drives skyrocketing and this creates for very poor performance of my server overall. I dont have any Reiser formatted drives. The process goes away if I disable Docker, but comes right back again. No container has access to all the files that the process has open, so I dont know what can cause this. Diagnostics attached. tower-diagnostics-20171017-1538.zip EDIT: The problem got worse until everything stalled, had to pull the plug again. I've stopped containers one by one now, and it continues until all containers are stopped. Plex is the worst (has the biggest appdata folder/most items in appdata). I tried uninstalling Open Files plugin, but still stuck with the same error.
-
Telegraf Agent for InfluxDB/Grafana Dashboard?
Fredrick replied to jedimstr's topic in Plugin System
Hey guys, Anyone have ideas for getting a table view similar to "top" in terminal? I'd like to see which processes are hogging my resources or is active Could procstat plugin do this? I've tried, but can't seem to set it up correctly. -
I get that the ipv4 reporting in netdata can be confusing here as it somehow also includes statistics coming from the docker-container-nics. Is this normal? As both containers (ie radarr/sonarr and nzbget) has access to /mnt/user/Downloads I don't understand why any data is going outbound ipv4.
-
Switched to Intel NIC - Got uneven and poor performance
Fredrick replied to Fredrick's topic in General Support
Thanks, I'll check that out. Would you recommend another bonding mode or just stay on active backup. -
Hi, I've bought an Intel 4xgbit NIC and installed it in my Proliant ML350 G6. It was supposed to replace the internal NIC as I've read that it could cause some issues, and that the Intels are known to work with anything. I might be wierd to have bought a new NIC and even wierder to not switch back now, but this bugs me, and I expected the Intel to be solid. Well first I only got 100mbit, seems the Intel didnt like the cables that used to work on the other NIC. Tried a new cable directly to the switch, and I got gbit connection. Problem is that I'm getting worse transfer speed than I had previously. I could always get 112MB/s stable both ways with the internal NIC (but some packet loss). Now the speed is wildly fluctiating between 65MB/s and 120MB/s, averaging 750-800Mbps. Bonding mode active backup, and I've got two cables connected to the switch now. Any tips? EDIT: Seems transfer speeds TO the server is working fine, while transfer speeds FROM the server is fluctuating.
-
I'm trying to clean up in my torrents and delete older stuff using "Remove torrent -> Remove with data", however whenever I do this I loose connection with the webui, and when it reloads I have deleted just 3-4 torrents out of the hundred i selected. Even if I select just a single torrent the webui crashes. Any ideas?
-
[SOLVED] Extreme (nearly 0,5B) amount of sync errors detected
Fredrick replied to Fredrick's topic in General Support
Well, I passed 0,7B errors before you came and saved the day again, @johnnie.black I must have misunderstood how new config/"parity is valid" works as I thought it was the right thing to do. Thanks again! -
Hi, My monthly scheduled parity check is running now: My previous check was actually just a week ago due to adding another parity drive. It went without problems. With this extreme number I cant really see this being due to drive issues? Disk statistics were cleared after about 500GB of the parity check, and these are the current stats: It feels pretty pointless to complete this check now, would you agree? Thinking I should just cancel it and run short SMART tests and file system checks on all drives. If that comes back without errors I'd run memtest. Any other ideas? Could this simply be misreporting in the UI? Edit: Removed diagnostics as I dont like it being stored


-
I didnt. 6.3.5 is my first install of Unraid. I dont understand why data is being sent to the NICs, and I'm thinking this could be the cause of interrupts.
-
Following up with some more info: The problematic interrupts I'm seeing are all going to CPU0, which is basically drowning this core. I'm attaching my interrupts. When I'm searching for this problem it seems to be related to Linux kernel version, and I know the version used by 6.3.5 which I'm running is not the best for my Proliant. I could try downgrading to version 6.2.4 which I know to work. How do I downgrade? Get another flash and set it up with 6.2.4 and then just switch to test it out during the trial? Interrupts.xlsx
-
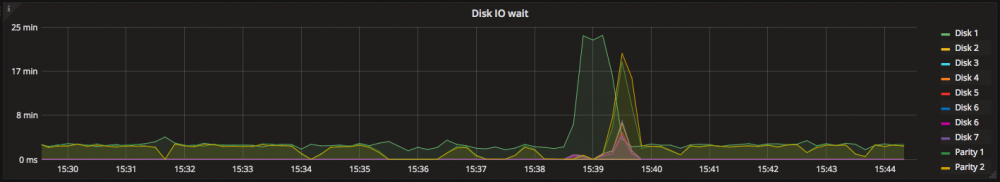
Hi, I'm struggling with high iowait during times when I'm downloading with NZBget and then extracted files are moved with Radarr/Sonarr. When viewing Netdata the interrupts are somehow coming from eth0: IPv4 outbound is practically at full capacity (its jumping up and down). Now, I dont know what is supposedly going through eth0. I'm at a 500mbit connection, and this data is not going to my switch so it must be internal in the Unraid server somehow. Is data between Dockers moved through network? See how sent and recieved/forwarded are following eachother? My network settings in Unraid: Any idea what is causing these interrupts/ipv4 outbound traffic and if I can do anything with it? Id really like to reduce the iowait Thanks!