geeksheikh
Members
-
Joined
-
Last visited
Everything posted by geeksheikh
-
Right, but as I noted in the initial thread -- this issue only happens 30-60 days after reboot so @JorgeB gave me a script to keep alive to monitor the php errors. I did that and the error presented yesterday / today and I replied. After further research I found out that the FUSE mounted io wait times were extremely high -- I have switched to direct mount and now the issue seems to be resolved. I posted the above for others with the issue.
-
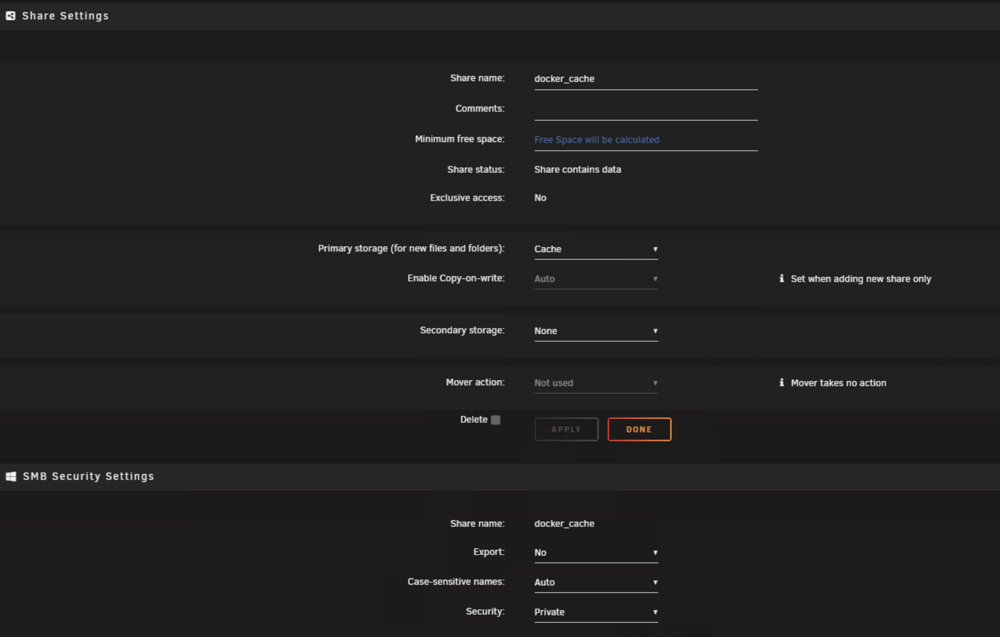
No but it wasn't the plugins -- here's the issue and the evidence Basically, I had my docker.img at /mnt/user/docker_cache/docker.img (no idea why / how / when it got there). This somehow was mounted to a btrfs FUSE mount that was causing major io delays (again no idea). The share WAS configured for cache only (see image attached below). It seems that there was an issue with using a FUSE reference instead of an actual mount that caused major io waits to the docker img dragging the whole system down. I'm not sure if I made a mistake sometime in the past or if the mover on one of the Unraid versions bugged out and moved it off cache or exactly what but for others out there that have this problem I suggest stopping your docker service, providing a path DIRECTLY to a real mount and not using a share path -- hopefully this can help someone else. Now the UI is back to being super snappy and I didn't even have to restart. root@pumbaa:/mnt/ssdpool/fastcache/logs# grep -R "DOCKER_IMAGE_FILE" -n /boot/config 2>/dev/null /boot/config/docker.cfg:2:DOCKER_IMAGE_FILE="/mnt/user/docker_cache/docker.img" ls -l /dev/mapper | head lsblk -o NAME,MAJ:MIN,SIZE,TYPE,FSTYPE,MOUNTPOINTS | sed -n '1,200p' lsblk -o NAME,TYPE,SIZE,FSTYPE,MOUNTPOINTS,PKNAME | egrep 'dm-20|loop2|nvme|sd' dmsetup info -C /dev/dm-20 dmsetup table /dev/dm-20 commands allowed me to see sdag 66:0 476.9G disk └─sdag1 66:1 476.9G part crypto_LUKS └─sdag1 253:20 476.9G crypt btrfs /mnt/ssdpool root@pumbaa:/mnt/ssdpool/fastcache/logs# dmsetup info -C /dev/dm-20 dmsetup table /dev/dm-20 Name Maj Min Stat Open Targ Event UUID sdag1 253 20 L--w 1 1 0 CRYPT-LUKS2-<redacted>-sdag1 0 1000180400 crypt aes-xts-plain64 :64:logon:cryptsetup:<redacted> 0 66:1 32768 1 allow_discards root@pumbaa:/mnt/ssdpool/fastcache/logs# docker info | egrep -i "Docker Root Dir|Storage Driver|Backing Filesystem" Storage Driver: btrfs WARNING: No swap limit support Docker Root Dir: /var/lib/docker root@pumbaa:/mnt/ssdpool/fastcache/logs# df -h "$(docker info --format '{{.DockerRootDir}}')" Filesystem Size Used Avail Use% Mounted on /dev/loop2 160G 78G 79G 50% /var/lib/docker root@pumbaa:/mnt/ssdpool/fastcache/logs# dmesg -T | tail -n 300 | egrep -i "i/o error|timeout|reset|nvme|ata|blk_update_request|xfs|btrfs|zfs" [Mon Feb 2 05:11:30 2026] BTRFS warning (device dm-20): failed to trim 1 device(s), last error -121 [Tue Feb 3 05:11:31 2026] BTRFS warning (device dm-20): failed to trim 1 device(s), last error -121 [Wed Feb 4 05:16:01 2026] BTRFS warning (device dm-20): failed to trim 1 device(s), last error -121 [Thu Feb 5 05:15:46 2026] BTRFS warning (device dm-20): failed to trim 1 device(s), last error -121 root@pumbaa:/mnt/ssdpool/fastcache/logs# time docker version >/dev/null time docker stats --no-stream >/dev/null real 1m44.444s user 0m0.311s sys 0m14.391s
-
That's exactly what I did -- but the only preclear plugin I could find was the unassigned devices preclear plugin -- I uninstalled it earlier today and the ui login is still incredibly slow -- seems like it's dying...now it looks like dynamix maybe? slow_log_0205_1837.txt
-
@JorgeB the server hasn't crashed yet but it's started to show slowness in the UI and seeming like it's about to go -- do you see any illuminating facts in the slow_log file thus far? Thanks. slow_log.txt
-
I kind of don't think it's docker -- because while the failure was happening I was able to kill all the containers and stop the docker service -- still, php-fpm would not restart. Nonetheless, I'll do this and see what it shows us. Thanks again. killall dockerd 2>/dev/null killall containerd 2>/dev/null killall containerd-shim 2>/dev/null /etc/rc.d/rc.docker stop 2>/dev/null
-
ok, got it. Thanks. Ok to leave this running for 30+ days? May be a while before it happens again. I tried to adjust the slowlog settings in www.conf while it was failing but the php-fpm wouldn't restart at that point.
-
Thanks @JorgeB -- I saw this exact post from you on another thread. My CPUs are pinned and CPUs 0/1 are open for the server. As I noted, RAM utilization was only at 70% of 128GB. How can I diagnoses the actual issue? total used free shared buff/cache available Mem: 131864536 111620016 3300104 19750552 38697964 20244520 Swap: 0 0 0
-
I have two issues that seem to creep up about 1 every month or two (different times of the month). Docker vnets flapping This issue doesn't seem to cause anything but noisy logs but I'd like to know what's going on php-fpm issue This is the real issue - when I start seeing these the UI freezes and I cannot run "docker ps", server terminal is laggy, UI goes down, I cannot restart php-fpm service. The only fix seems to be a reboot. This only seems to occur about every 40-90 days. I just rebooted again last night and am now reporting. Memory seems to be at about 70% utilization (of 128GB) (mostly consumed by a zfs pool) Diagnostics and logs from yesterday are attached. I've tried debugging but by the time it happens I can't really maneuver the server so it's extremely hard to debug. Any assistance would be greatly appreciated. Docker flapping issue sample Jan 5 16:14:48 pumbaa kernel: br-2c57e8bd9fdb: port 10(veth9feb635) entered disabled state Jan 5 16:14:48 pumbaa kernel: br-2c57e8bd9fdb: port 10(vethb028867) entered blocking state Jan 5 16:14:48 pumbaa kernel: br-2c57e8bd9fdb: port 10(vethb028867) entered disabled state Jan 5 16:14:48 pumbaa kernel: vethb028867: entered allmulticast mode Jan 5 16:14:48 pumbaa kernel: vethb028867: entered promiscuous mode Jan 5 16:14:51 pumbaa kernel: eth0: renamed from vethbee5c8d Jan 5 16:14:51 pumbaa kernel: br-2c57e8bd9fdb: port 10(vethb028867) entered blocking state Jan 5 16:14:51 pumbaa kernel: br-2c57e8bd9fdb: port 10(vethb028867) entered forwarding state Jan 5 16:39:37 pumbaa kernel: br0: port 3(vnet1) entered disabled state Jan 5 16:39:37 pumbaa kernel: vnet1 (unregistering): left allmulticast mode Jan 5 16:39:37 pumbaa kernel: vnet1 (unregistering): left promiscuous mode Jan 5 16:39:37 pumbaa kernel: br0: port 3(vnet1) entered disabled state Jan 5 16:39:37 pumbaa kernel: usb 1-6.3: reset full-speed USB device number 6 using xhci_hcd Jan 5 16:39:37 pumbaa kernel: cp210x 1-6.3:1.0: cp210x converter detected Jan 5 16:39:37 pumbaa kernel: usb 1-6.3: cp210x converter now attached to ttyUSB0 Jan 5 16:40:43 pumbaa kernel: br0: port 3(vnet3) entered blocking state Jan 5 16:40:43 pumbaa kernel: br0: port 3(vnet3) entered disabled state Jan 5 16:40:43 pumbaa kernel: vnet3: entered allmulticast mode Jan 5 16:40:43 pumbaa kernel: vnet3: entered promiscuous mode Jan 5 16:40:43 pumbaa kernel: br0: port 3(vnet3) entered blocking state Jan 5 16:40:43 pumbaa kernel: br0: port 3(vnet3) entered forwarding state Jan 5 16:40:44 pumbaa kernel: cp210x ttyUSB0: cp210x converter now disconnected from ttyUSB0 Jan 5 16:40:44 pumbaa kernel: cp210x 1-6.3:1.0: device disconnected Jan 5 16:40:48 pumbaa kernel: usb 1-6.3: reset full-speed USB device number 6 using xhci_hcd php-fpm children dying sample Jan 5 16:42:02 pumbaa php-fpm[14136]: [WARNING] [pool www] child 312763 exited on signal 9 (SIGKILL) after 133.889516 seconds from start Jan 5 16:42:14 pumbaa php-fpm[14136]: [WARNING] [pool www] child 312765 exited on signal 9 (SIGKILL) after 145.724033 seconds from start Jan 5 16:42:16 pumbaa php-fpm[14136]: [WARNING] [pool www] child 327026 exited on signal 9 (SIGKILL) after 13.647382 seconds from start Jan 5 16:42:26 pumbaa php-fpm[14136]: [WARNING] [pool www] child 327446 exited on signal 9 (SIGKILL) after 11.937198 seconds from start Jan 5 16:42:28 pumbaa php-fpm[14136]: [WARNING] [pool www] child 327479 exited on signal 9 (SIGKILL) after 12.002520 seconds from start Jan 5 16:42:34 pumbaa winbindd[3097]: [2026/01/05 16:42:34.383799, 0, traceid=179742] ../../source3/winbindd/winbindd_samr.c:71(open_internal_samr_conn) Jan 5 16:42:34 pumbaa winbindd[3097]: open_internal_samr_conn: Could not connect to samr pipe: NT_STATUS_CONNECTION_DISCONNECTED Note: I know I have a failing drive -- replacement is on the way but that is not related as this stability issue has been happening for several months and the drive just started failing about a week ago. pumbaa_logs.txt.zip pumbaa-diagnostics-20260105-1825.zip
-
Excellent! Thanks all!
-
Yes, will definitely keep the original parities until everything is back and healthy. I thought steps 3 and 4 were necessary to ensure that the original parity drives were forgotten. If I can skip them, sweet! Thank you
-
Hi, I am increasing the size of my parity disks. I have an xfs encrypted array with 2 parity drives and am running unraid 7.0.0. I am planning to: Stop Array Select No Device for the parity drives Restart the array in Maintenance Mode Stop the array Replace both parity drives with two new, larger drivers Select the new parity drives in the array Restart array Wait for parity to rebuild Is this right? Thank you
-
Ok nvm, I was able to get it fixed by downloading the key file from unraid.net account management.
-
@JorgeB I just got my new drive, I moved the Pro.key file (and the rest of the config) to the new drive but I cannot get the "replace key" function to work. The first time I tried it I forgot to switch to the DNS server to one that worked so it probably couldn't resolve. Switched that in networking and tried again but it's still giving me the same problem. I replaced the Pro.key file again, rebooted, tried to "Replace Key" again and it's still not working. I get a pop up in the top right corner that just says, "Error attempting to replace key". Suggestions? I'm dead in the water right now. Thanks.
-
All these issues started after I upgraded to 7.0.0 a few days ago. Now I cannot connect again but my open shell is working but is very laggy (even typing is laggy). I have a home assistant VM, is there some kind of conflict that is borking my connectivity to Unraid? I cannot create new ssh session or get to web ui but existing shell session still active. Update: All my docker containers and the Home assistant VM (webui) are all still working fine and allowing connections. Feb 20 16:38:57 pumbaa nmbd[3057]: [2025/02/20 16:38:55.495353, 0] ../../source3/nmbd/nmbd_incomingrequests.c:116(process_name_release_request) Feb 20 16:38:57 pumbaa nmbd[3057]: process_name_release_request: Attempt to release name WORKGROUP<1d> from IP 10.10.80.193 on subnet 10.10.80.175 being rejected as it is one of our names. Feb 20 16:39:55 pumbaa nmbd[3057]: [2025/02/20 16:39:53.786888, 0] ../../source3/nmbd/nmbd_incomingrequests.c:116(process_name_release_request) Feb 20 16:39:55 pumbaa nmbd[3057]: process_name_release_request: Attempt to release name WORKGROUP<1d> from IP 10.10.80.193 on subnet 10.10.80.175 being rejected as it is one of our names. Feb 20 16:42:00 pumbaa nmbd[3057]: [2025/02/20 16:41:59.956165, 0] ../../source3/nmbd/nmbd_incomingrequests.c:116(process_name_release_request) Feb 20 16:42:00 pumbaa nmbd[3057]: process_name_release_request: Attempt to release name WORKGROUP<1d> from IP 10.10.80.193 on subnet 10.10.80.175 being rejected as it is one of our names. Feb 20 16:42:00 pumbaa nmbd[3057]: [2025/02/20 16:42:00.628106, 0] ../../source3/nmbd/nmbd_incomingrequests.c:116(process_name_release_request) Feb 20 16:42:00 pumbaa nmbd[3057]: process_name_release_request: Attempt to release name WORKGROUP<1d> from IP 10.10.80.193 on subnet 10.10.80.175 being rejected as it is one of our names. Feb 20 16:42:03 pumbaa nmbd[3057]: [2025/02/20 16:42:02.903949, 0] ../../source3/nmbd/nmbd_incomingdgrams.c:303(process_local_master_announce) Feb 20 16:42:03 pumbaa nmbd[3057]: process_local_master_announce: Server HOMEASSISTANT at IP 10.10.80.193 is announcing itself as a local master b rowser for workgroup WORKGROUP and we think we are master. Forcing election. Feb 20 16:49:42 pumbaa php-fpm[8268]: [WARNING] [pool www] child 1888456 exited on signal 9 (SIGKILL) after 39.173931 seconds from start Feb 20 16:50:55 pumbaa php-fpm[8268]: [WARNING] [pool www] child 1889596 exited on signal 9 (SIGKILL) after 61.052363 seconds from start Feb 20 16:51:17 pumbaa nmbd[3057]: [2025/02/20 16:51:16.993274, 0] ../../source3/nmbd/nmbd_incomingrequests.c:116(process_name_release_request) Feb 20 16:51:17 pumbaa nmbd[3057]: process_name_release_request: Attempt to release name WORKGROUP<1d> from IP 10.10.80.193 on subnet 10.10.80.175 being rejected as it is one of our names. Feb 20 16:51:17 pumbaa nmbd[3057]: [2025/02/20 16:51:17.257120, 0] ../../source3/nmbd/nmbd_incomingrequests.c:116(process_name_release_request) Feb 20 16:51:17 pumbaa nmbd[3057]: process_name_release_request: Attempt to release name WORKGROUP<1d> from IP 10.10.80.193 on subnet 10.10.80.175 being rejected as it is one of our names. Feb 20 16:51:17 pumbaa nmbd[3057]: [2025/02/20 16:51:17.257966, 0] ../../source3/nmbd/nmbd_incomingrequests.c:116(process_name_release_request) Feb 20 16:51:17 pumbaa nmbd[3057]: process_name_release_request: Attempt to release name WORKGROUP<1d> from IP 10.10.80.193 on subnet 10.10.80.175 being rejected as it is one of our names. Feb 20 16:51:17 pumbaa nmbd[3057]: [2025/02/20 16:51:17.258010, 0] ../../source3/nmbd/nmbd_incomingrequests.c:116(process_name_release_request) Feb 20 16:51:17 pumbaa nmbd[3057]: process_name_release_request: Attempt to release name WORKGROUP<1d> from IP 10.10.80.193 on subnet 10.10.80.175 being rejected as it is one of our names. Feb 20 16:51:17 pumbaa nmbd[3057]: [2025/02/20 16:51:17.258127, 0] ../../source3/nmbd/nmbd_incomingdgrams.c:303(process_local_master_announce) Feb 20 16:51:17 pumbaa nmbd[3057]: process_local_master_announce: Server HOMEASSISTANT at IP 10.10.80.193 is announcing itself as a local master b rowser for workgroup WORKGROUP and we think we are master. Forcing election. Feb 20 17:30:07 pumbaa sshd-session[1986160]: Connection from 10.10.81.243 port 56098 on 10.10.80.175 port 22 rdomain "" Feb 20 17:30:45 pumbaa nmbd[3057]: [2025/02/20 17:30:44.801571, 0] ../../source3/nmbd/nmbd_incomingdgrams.c:303(process_local_master_announce) Feb 20 17:30:45 pumbaa nmbd[3057]: process_local_master_announce: Server HOMEASSISTANT at IP 10.10.80.193 is announcing itself as a local master b rowser for workgroup WORKGROUP and we think we are master. Forcing election.
-
New one gets here on Saturday, thanks @JorgeB. So you would agree that this looks like a kernel panic or something due to issues with the USB device? You don't see any other relevant issues? When you say USB reset, try a different USB port...are you thinking that the server usb port is losing power momentarily or something? Sorry, not entirely sure what a "usb reset" means. Thanks again.
-
For the past 3 days, every morning when I wake up the server has to be rebooted. Containers like plex and others are still working but I just cannot login via ssh, the browser, or from the server directly and I have to do a hard reboot to regain access. It may be my USB drive as I'm seeing the error below in the logs but would love it if someone could take a quick look and see if you could see if there's anything else going on. I've managed to get diagnostics during one of the failures just before I rebooted (attached). I also attached syslogs for past few days. Thank you. eb 19 08:50:40 pumbaa kernel: usb 1-6.3: reset high-speed USB device number 6 using xhci_hcd Feb 19 08:50:40 pumbaa kernel: sd 4:0:0:0: [sde] tag#0 UNKNOWN(0x2003) Result: hostbyte=0x03 driverbyte=DRIVER_OK cmd_age=30s Feb 19 08:50:40 pumbaa kernel: sd 4:0:0:0: [sde] tag#0 CDB: opcode=0x28 28 00 00 73 ae ce 00 00 10 00 Feb 19 08:50:40 pumbaa kernel: I/O error, dev sde, sector 7581390 op 0x0:(READ) flags 0x80700 phys_seg 2 prio class 2 pumbaa-diagnostics-20250219-0927.zip syslog_last3days.log.zip
-
Wow, I had three disks, I did test them all...but somewhere I must have gotten confused and tested the same one twice and never done appropriate tests on the "bad" drive. I went ahead and ran through a perf test on all ssds again and attached is what I found. Sheesh...whatta waste of life. In the attached look at Serial ending in 9DB4...arg. Will submit RMA for the drive. thank you and sorry for taking up your time on something I should have found.crucial_ssd_perf_reports.pdf
-
Thanks @JorgeB. FYI -- I did complete my tests with the Samsung EVOs and could not replicate the perf issue. I would still very much appreciate if you could take a look at that video and offer any thoughts you have on what is so different about those SSDs that cause them write at <2MB/s after large transfers get going. Perhaps there something UnRaid can do too to improve perf on SSDs like that or at the very least identify what to look out for when choosing SSDs for high-perf pools.
-
@JorgeB -- Here's the video that show the issues. I've added chapters so you can move around quickly. 0:00 NTFS Successful (Windows -- Fast Transfer) 2:02 BTRFS Single SSD Success (Unraid Single Drive -- Fast Transfer) 6:36 ZFS Mirror Setup 10:01 ZFS Mirror Slow (ZFS transfer crawling along) 13:18 BTRFS Mirror Setup 16:42 BTFS Mirror Stuck Plus iostat (transfers just get stuck. Overlaid iostat for debug / review)
-
I am testing with these now...but...even "not the fastest" doesn't seem right. Single drive can transfer over 300MB/s sustained for >100GB so long as not using pool. I'm about to upload the video for you. Meanwhile I am also testing the drives below and will let you know. Samsung Electronics 870 EVO 2TB 2.5 Inch SATA III Internal SSD (MZ-77E2T0B/AM)
-
Crucial BX500 2TB 3D NAND SATA 2.5-Inch Internal SSD, up to 540MB/s - CT2000BX500SSD1, Solid State Hard Drive
-
@JorgeB I've been really struggling with pool perf for a long time now and am looking for some help. (Tests ran on Unraid 6.12.13) Forget about VM perf, I boiled it down to just working with raw files, both VDisk files and other large files. I even did some screen records to prove what I'm seeing but either I'm misunderstanding something about pools or the pools are extremely inefficient. I have two SSDs same model, same size. The Single tests below are for both. The files were between 4GB and 100GB. Single SSD mounted in Unraid via unassigned devices as btrfs and as zfs-encrypted works well Same Single SSD mounted in Windows NTFS works well (300MB/s+) for the same files tested in Unraid. 300MB/s was the average sustained write speed for the individual disks for the entire duration of the write in Windows. In Unraid sustained averages were around 100MB/s (still ok) I added the same two disks to a btrfs pool (mirrored) and a zfs-encrypted pool (zraid1) and repeated the tests. Copy starts off between 100-300 MB/s, great. After a few GBs is copied though, perf goes down to 0-3MB/s. iotop shows me disk utilization is maxed out. I will splice together the video and share on YT if you need it. This means, it's not the disks, it's not the unraid setup, it's not hardware between mobo and ssds. The only thing left I can think of is that mirrored pool operations is extremely inefficient. Am I missing something? What else would help you diagnose? Thank you
-
Thanks @JorgeB -- the Unraid GUI only has options for qcow and raw. Is there any guide for enabling an Unraid VM on a ZVOL? ChatGPT tells me to adjust the XML directly but I wasn't sure I could trust it. What I understand is convert the vdisk to zvol with qemu command but not sure how to point the vm to it.
-
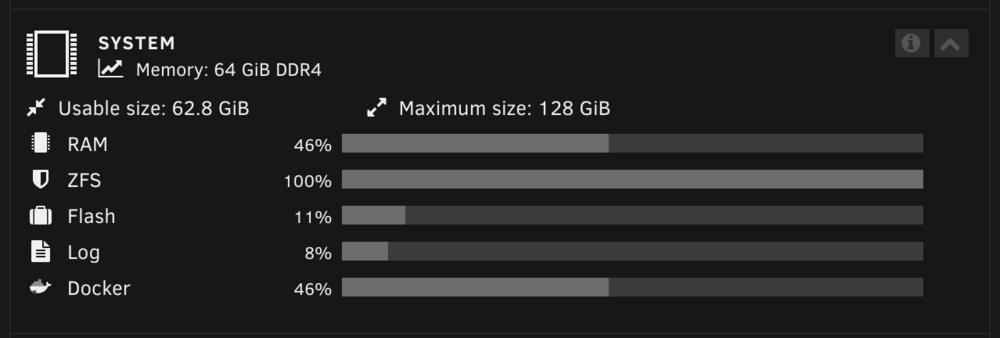
UPDATE -- I switched the PRIMARYCACHE from all to metadata for all zfs pools and restarted the array, now I'm down to only 1% utilization of the arc size (8GB). After a disk io test it's already up to over 25% again. I'll keep an eye on it and see how it goes. The perf test after the reboot isn't much better but the guest VM seems responsive at least...for now. UPDATE -- after being on for just an hour or two ZFS usage is all the way back to 100%
-
Also, on the dashboard page I see the following for system stats. I'm not sure why ZFS shows 100%...could this be the root cause? If so how can I fix it?