


lrx345
Members
-
Joined
-
Last visited
Everything posted by lrx345
-
Good news, after 15 hours of running on libtorrentv1 it seems to have stopped crashing. I'll update if it manages to crash again Doing the best I can with ChatGPT 😂 Thank you for the link! Going to read through.
-
Thanks, going to give this a shot. Doing some more troubleshooting - I installed your qBittorrentVPN container to compare how it functions to this deluge container. I found an interesting output comparison using the ps auxw | grep [containerID] command only after the deluge container failed again. As you can see, the deluge docker (top one) has an extra process root 29837 0.0 0.0 712464 9304 ? Sl 04:45 0:00 /usr/bin/containerd-shim-runc-v2 -namespace moby -id d804d0f0a6a6ac93c2827dbb7f7ef95787be84809dbccc3270ea337de59c3304 -address /var/run/docker/containerd/containerd.sock Killing this process returns fixed a lockup issue with the Unraid WebUI and finally shut down the deluge container. The interesting part is the call traces from the unraid syslog appear to be correlated timing wise with the docker logs complaining about this locked up process? I'm way out of my depth here though. Either way, will downgrade to libtorrentv1 and see if that starts solving the issue

-
Unfortunately still struggling with this. I've tried Changing the mount point for the new HDD just in case Deleting the delugevpn image and re-adding it Clearing app data and starting fresh Unfortunately in all cases, the delugevpn webui stops responding after a few hours and the container crashes. To shut down the container I am having to use ps auxw | grep [containerID] Followed by a kill -9 [processID] Any help is greatly appreciated ----- Edit: I've found more logs that are related to deluge and are referencing call traces Jun 13 03:24:04 NAS kernel: Call Trace: Jun 13 03:24:04 NAS kernel: <TASK> Jun 13 03:24:04 NAS kernel: __schedule+0x596/0x5f6 Jun 13 03:24:04 NAS kernel: ? get_futex_key+0x281/0x2ad Jun 13 03:24:04 NAS kernel: schedule+0x8e/0xc3 Jun 13 03:24:04 NAS kernel: __down_read_common+0x241/0x295 Jun 13 03:24:04 NAS kernel: do_exit+0x279/0x8e5 Jun 13 03:24:04 NAS kernel: make_task_dead+0xba/0xba Jun 13 03:24:04 NAS kernel: rewind_stack_and_make_dead+0x17/0x17 Jun 13 03:24:04 NAS kernel: RIP: 0033:0x154c05f6c60d Jun 13 03:24:04 NAS kernel: RSP: 002b:0000154c01be6888 EFLAGS: 00010202 Jun 13 03:24:04 NAS kernel: RAX: 0000154be001ee90 RBX: 0000154be0000dd8 RCX: 0000154c01be6ac0 Jun 13 03:24:04 NAS kernel: RDX: 0000000000004000 RSI: 000015355e67fceb RDI: 0000154be001ee90 Jun 13 03:24:04 NAS kernel: RBP: 0000000000000000 R08: 0000000000000002 R09: 0000000000000000 Jun 13 03:24:04 NAS kernel: R10: 0000000000000008 R11: 0000000000000246 R12: 0000000000000000 Jun 13 03:24:04 NAS kernel: R13: 0000154be00272f0 R14: 0000000000000002 R15: 0000154bfc428540 Jun 13 03:24:04 NAS kernel: </TASK> Jun 13 03:24:32 NAS kernel: rcu: INFO: rcu_preempt detected expedited stalls on CPUs/tasks: { P22284 } 2052231 jiffies s: 47953 root: 0x0/T Jun 13 03:24:32 NAS kernel: rcu: blocking rcu_node structures (internal RCU debug): Jun 13 03:25:38 NAS kernel: rcu: INFO: rcu_preempt detected expedited stalls on CPUs/tasks: { P22284 } 2117767 jiffies s: 47953 root: 0x0/T Jun 13 03:25:38 NAS kernel: rcu: blocking rcu_node structures (internal RCU debug): Jun 13 03:26:43 NAS kernel: rcu: INFO: rcu_preempt detected expedited stalls on CPUs/tasks: { P22284 } 2183303 jiffies s: 47953 root: 0x0/T Jun 13 03:26:43 NAS kernel: rcu: blocking rcu_node structures (internal RCU debug): Jun 13 03:27:04 NAS kernel: rcu: INFO: rcu_preempt detected stalls on CPUs/tasks: Jun 13 03:27:04 NAS kernel: rcu: Tasks blocked on level-0 rcu_node (CPUs 0-3): P22284/1:b..l Jun 13 03:27:04 NAS kernel: (detected by 0, t=2220062 jiffies, g=86521621, q=1614141 ncpus=4) Jun 13 03:27:04 NAS kernel: task:deluged state:D stack: 0 pid:22284 ppid: 21270 flags:0x00004002 Jun 13 03:27:04 NAS kernel: Call Trace: Jun 13 03:27:04 NAS kernel: <TASK> Jun 13 03:27:04 NAS kernel: __schedule+0x596/0x5f6 Jun 13 03:27:04 NAS kernel: ? get_futex_key+0x281/0x2ad Jun 13 03:27:04 NAS kernel: schedule+0x8e/0xc3 Jun 13 03:27:04 NAS kernel: __down_read_common+0x241/0x295 Jun 13 03:27:04 NAS kernel: do_exit+0x279/0x8e5 Jun 13 03:27:04 NAS kernel: make_task_dead+0xba/0xba Jun 13 03:27:04 NAS kernel: rewind_stack_and_make_dead+0x17/0x17 Jun 13 03:27:04 NAS kernel: RIP: 0033:0x154c05f6c60d Jun 13 03:27:04 NAS kernel: RSP: 002b:0000154c01be6888 EFLAGS: 00010202 Jun 13 03:27:04 NAS kernel: RAX: 0000154be001ee90 RBX: 0000154be0000dd8 RCX: 0000154c01be6ac0 Jun 13 03:27:04 NAS kernel: RDX: 0000000000004000 RSI: 000015355e67fceb RDI: 0000154be001ee90 Jun 13 03:27:04 NAS kernel: RBP: 0000000000000000 R08: 0000000000000002 R09: 0000000000000000 Jun 13 03:27:04 NAS kernel: R10: 0000000000000008 R11: 0000000000000246 R12: 0000000000000000 Jun 13 03:27:04 NAS kernel: R13: 0000154be00272f0 R14: 0000000000000002 R15: 0000154bfc428540 Jun 13 03:27:04 NAS kernel: </TASK> Any thoughts?
-
Thank you. I somewhat accidentally discovered one of my docker containers is hanging and seems correlated with the WebUI freezes. I'll explore that route first and see if it reveals anything. This is somewhat present in the logs with binhex-delugevpn hanging
-
Hi @binhex, I believe I've broken something with my instance and it is causing the unraid web UI to go unstable. After a short time of running the deluge webui no longer responds, and the container fails to exit even with a `docker kill` command. I did recently change my downloads folder from a 1tb HDD to a 8tb HDD. I ended up using the same disk share name as the previous drive. That's the only change I've made recently. All my files loaded up great and started seeding so I don't think that is it? Anyways, here are some logs from my system and the container itself. System Log Docker Log Delugevpn Log
-
This unraid server has been super stable so a bit of a surprise it to go down like this. Thankfully I was able to export the logs using the Diagnostics command prior to shutting down. Can anyone help me understand what went wrong? After rebooting, the array mounted and launched a parity check so I believe the shutdown was somewhat unclean? nas-diagnostics-20230610-0142.zip
-
I've narrowed the issue down to the IPVlan vs MacVlan setting in Docker. On MacVlan the WAN access from unraid is maintained. On IPVlan the issue persists.
-
Unfortunately this did not make a difference. Thanks for the idea should I upload new logs?
-
I’ve confirmed this is not a hardware issue by swapping the Ethernet cable and NIC. I also changed ports on my switch. Any ideas? I’m really lost here. The issue also appears to be limited to this unraid setup. Switching the machine to Ubuntu and monitoring a ping with health checks.io doesn’t replicate the problem
-
Gateway ping appears to stay consistent during the outage. Also interestingly I’ve discovered WAN outages are about 12- 18 minutes apart
-
-
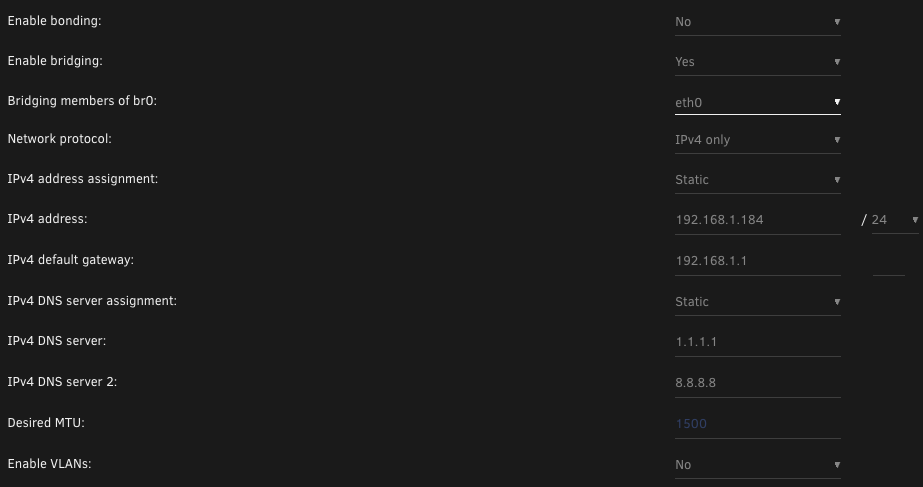
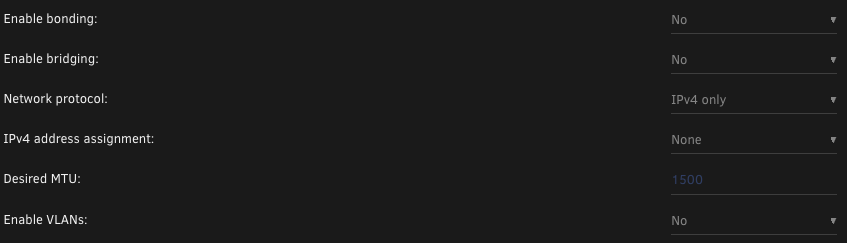
Problem Description My Unraid server appears to lose WAN access randomly. However, my Adguard docker continues working and forwards domains correctly during the outage so I am very confused. During an outage I am able to connect to the internet via my clients using Adguard for DNS, but the Unraid web UI is unable to access the internet (community applications for example), along with a shell being unable to ping WAN IPs such as 8.8.8.8. Edit: Swapped cable and NIC port, so not a hardware problem Deployment Details Primarily used for dockers (Adguard-Home, frigate, Nginx-Proxy-Manager-Official) and Home Assistant VM Adguard-Home is set to Network Type: Custom: br0 Fixed IP: 192.168.1.4 (which does not conflict with anything on the network) Frigate is set to bridge NPM is set to Network Type: custom br0 Fixed IP: 192.168.1.3 (which does not conflict with anything on the network) Network configuration: Onboard NIC set to the following PCIe NIC is unplugged but set to the following Config and logs attached automation-syslog-20230518-2134.zip automation-diagnostics-20230518-1538.zip Thank you
-
Flood UI Docker Anyone else having issues with Flood failing to start up the first try, but reliably starting up the second try? I'm tempted to just write a script to have it try to start up twice. FATAL internal error. Please open an issue. Unhandled rejection: undefined % Total % Received % Xferd Average Speed Time Time Time Current Dload Upload Total Spent Left Speed 0 0 0 0 0 0 0 0 --:--:-- --:--:-- --:--:-- 0 100 58.4M 100 58.4M 0 0 59.4M 0 --:--:-- --:--:-- --:--:-- 100M FATAL internal error. Please open an issue. Unhandled rejection: undefined % Total % Received % Xferd Average Speed Time Time Time Current Dload Upload Total Spent Left Speed 0 0 0 0 0 0 0 0 --:--:-- --:--:-- --:--:-- 0 100 58.4M 100 58.4M 0 0 43.1M 0 0:00:01 0:00:01 --:--:-- 64.1M FATAL internal error. Please open an issue. Unhandled rejection: undefined % Total % Received % Xferd Average Speed Time Time Time Current Dload Upload Total Spent Left Speed 0 0 0 0 0 0 0 0 --:--:-- --:--:-- --:--:-- 0 100 58.4M 100 58.4M 0 0 53.3M 0 0:00:01 0:00:01 --:--:-- 93.8M FATAL internal error. Please open an issue. Unhandled rejection: undefined % Total % Received % Xferd Average Speed Time Time Time Current Dload Upload Total Spent Left Speed 0 0 0 0 0 0 0 0 --:--:-- --:--:-- --:--:-- 0 100 58.4M 100 58.4M 0 0 49.0M 0 0:00:01 0:00:01 --:--:-- 72.0M FATAL internal error. Please open an issue. Unhandled rejection: undefined % Total % Received % Xferd Average Speed Time Time Time Current Dload Upload Total Spent Left Speed 0 0 0 0 0 0 0 0 --:--:-- --:--:-- --:--:-- 0 100 58.4M 100 58.4M 0 0 56.1M 0 0:00:01 0:00:01 --:--:-- 56.1M FATAL internal error. Please open an issue. Unhandled rejection: undefined % Total % Received % Xferd Average Speed Time Time Time Current Dload Upload Total Spent Left Speed 0 0 0 0 0 0 0 0 --:--:-- --:--:-- --:--:-- 0 100 58.4M 100 58.4M 0 0 24.9M 0 0:00:02 0:00:02 --:--:-- 34.6M FATAL internal error. Please open an issue. Unhandled rejection: undefined % Total % Received % Xferd Average Speed Time Time Time Current Dload Upload Total Spent Left Speed 0 0 0 0 0 0 0 0 --:--:-- --:--:-- --:--:-- 0 100 58.4M 100 58.4M 0 0 49.0M 0 0:00:01 0:00:01 --:--:-- 87.7M GET /api/activity-stream?historySnapshot=FIVE_MINUTE 200 1.998 ms - - GET / 304 0.389 ms - - GET /static/js/main.e491eea1.js 304 0.408 ms - - GET /static/css/main.91a3ca36ed1a96839319.css 304 0.467 ms - - GET /api/auth/verify?1681279117055 200 1.420 ms - 114 GET /static/js/90.8be17c89.chunk.js 304 0.462 ms - - GET /api/settings 200 1.572 ms - 373 GET /api/client/settings 200 4.245 ms - 605 GET /static/media/Roboto-regular.11bce66a..woff2 304 0.663 ms - - GET /static/css/116.bc338a685eec2e79b3a6.css 304 0.404 ms - - GET /static/js/116.0faf47ae.chunk.js 304 0.311 ms - - GET /static/js/183.afcec458.chunk.js 304 1.109 ms - - GET /static/js/535.4bb41992.chunk.js 304 1.095 ms - - GET /static/js/flag0.d867ac2a.chunk.js 304 1.063 ms - - GET /static/media/Roboto-italic.766b7c5c..woff2 304 0.875 ms - - GET /static/media/Roboto-700.2b8c7cb1..woff2 304 0.701 ms - - GET /static/media/Roboto-500.c7e17507..woff2 304 0.365 ms - - GET /api/activity-stream?historySnapshot=FIVE_MINUTE 200 0.916 ms - - GET /api/activity-stream?historySnapshot=FIVE_MINUTE 401 0.507 ms - - GET /apple-touch-icon.png 404 0.775 ms - 159 GET /apple-touch-icon-precomposed.png 404 0.469 ms - 171 GET /favicon.ico 200 1.677 ms - - GET /login 200 0.460 ms - 992 GET /icon_maskable_180x180.png 200 1.338 ms - 5392 GET /favicon.ico 200 1.132 ms - - GET /login 200 0.310 ms - 992 GET /favicon.ico 200 0.593 ms - - Downloading latest flood release... Flood server 4.7.0 starting on http://0.0.0.0:3000 Downloading latest flood release... Flood server 4.7.0 starting on http://0.0.0.0:3000 Downloading latest flood release... Flood server 4.7.0 starting on http://0.0.0.0:3000 Downloading latest flood release... Flood server 4.7.0 starting on http://0.0.0.0:3000 Downloading latest flood release... Flood server 4.7.0 starting on http://0.0.0.0:3000 Downloading latest flood release... Flood server 4.7.0 starting on http://0.0.0.0:3000 Downloading latest flood release... Flood server 4.7.0 starting on http://0.0.0.0:3000 Docker template is left to default other than mapping 3000 to 3001. Running with Deluge. My docker load order is Deluge first, then Flood last, and I even have a 120s wait set before flood loads. Weirdest thing.
-
Hi, I'm sure this is something simple I am overlooking. I'm trying to update to Nextcloud 25, but in the Web UI > Settings it says I am on 24.0.7 and that it is the latest version. There is no option to upgrade to 25. Thank you
-
Can confirm mine is giving UDP errors as well.
-
I'm having a hard time with Magnet links and this docker. Frequently I get an issue where DHT is unable to connect and download tracker data. Anyone else running into this? I'm using PIA with portforwarding set to "only"
-
Hi there. I use CA Backup daily to restart dockers in the early morning. For some reason, this docker doesn't like to come back up with the others. Can someone please take a look at the pasted logs to help me understand why? Thank you!
-
Hi, I cant seem to get this working at all. I can see homebridge-tuya-web isn't loading but I'm not sure why. Also haven't been able to register with homekit... also not sure why. Thanks Get:1 http://security.ubuntu.com/ubuntu bionic-security InRelease [88.7 kB] Hit:2 http://archive.ubuntu.com/ubuntu bionic InRelease Get:3 http://archive.ubuntu.com/ubuntu bionic-updates InRelease [88.7 kB] Get:4 http://archive.ubuntu.com/ubuntu bionic-backports InRelease [74.6 kB] Get:5 http://archive.ubuntu.com/ubuntu bionic-updates/main amd64 Packages [900 kB] Get:6 http://archive.ubuntu.com/ubuntu bionic-updates/universe amd64 Packages [1247 kB] Fetched 2399 kB in 2s (1517 kB/s) Reading package lists... Reading package lists... Building dependency tree... Reading state information... 0 upgraded, 0 newly installed, 0 to remove and 118 not upgraded. /usr/local/lib `-- [email protected] [7/25/2019, 2:46:28 AM] Loaded config.json with 0 accessories and 1 platforms. [7/25/2019, 2:46:28 AM] --- [7/25/2019, 2:46:28 AM] ==================== [7/25/2019, 2:46:28 AM] ERROR LOADING PLUGIN homebridge-tuya-web: [7/25/2019, 2:46:28 AM] /usr/local/lib/node_modules/homebridge-tuya-web/lib/tuyawebapi.js:212 catch { ^ SyntaxError: Unexpected token { at createScript (vm.js:80:10) at Object.runInThisContext (vm.js:139:10) at Module._compile (module.js:616:28) at Object.Module._extensions..js (module.js:663:10) at Module.load (module.js:565:32) at tryModuleLoad (module.js:505:12) at Function.Module._load (module.js:497:3) at Module.require (module.js:596:17) at require (internal/module.js:11:18) at Object.<anonymous> (/usr/local/lib/node_modules/homebridge-tuya-web/lib/switch_accessory.js:1:82) [7/25/2019, 2:46:28 AM] ==================== [7/25/2019, 2:46:28 AM] No plugins found. See the README for information on installing plugins. [7/25/2019, 2:46:28 AM] Loading 1 platforms... /usr/local/lib/node_modules/homebridge/lib/api.js:122 throw new Error("The requested platform '" + name + "' was not registered by any plugin."); ^ Error: The requested platform 'TuyaWebPlatform' was not registered by any plugin. at API.platform (/usr/local/lib/node_modules/homebridge/lib/api.js:122:13) at Server._loadPlatforms (/usr/local/lib/node_modules/homebridge/lib/server.js:316:45) at Server.run (/usr/local/lib/node_modules/homebridge/lib/server.js:86:36) at module.exports (/usr/local/lib/node_modules/homebridge/lib/cli.js:45:10) at Object.<anonymous> (/usr/local/lib/node_modules/homebridge/bin/homebridge:17:22) at Module._compile (module.js:652:30) at Object.Module._extensions..js (module.js:663:10) at Module.load (module.js:565:32) at tryModuleLoad (module.js:505:12) at Function.Module._load (module.js:497:3) Here is my config { "bridge": { "name": "Homebridge", "username": "CC:22:3D:E3:CE:30", "port": 51826, "pin": "031-45-154" }, "description": "This is an example configuration file with one fake accessory and one fak> "ports": { "start": 52100, "end": 52150, "comment": "This section is used to control the range of ports that separate accessory > }, "platforms": [ { "platform": "TuyaWebPlatform", "name": "TuyaWebPlatform", "options": [ { "username": "myusername", "password": "hunter2", "countryCode": "1", "platform": "tuya" } ] } ] }
-
I have this same problem.
-
Hi thanks! I found you can also go into the docker's appdata folder and edit the "auth" file. Adding a new line containing <username>:<password>:10 where 10 is the permission level (see deluge documentation for more, but you'll probably want 10 as it is the highest).
-
Hello, Loving the docker so far. Is it possible to connect to the docker via the GTK? If so, what username and password would I use? Thanks!


