


esaru
Members
-
Joined
-
Last visited
Everything posted by esaru
-
Only thing that worked for me was nuking my VM and doing a clean windows installation. Quite unsatisfying as far as solutions go..
-
Thank you! Some people mentioned that this guide breaks their dockers. Could this be the reason that my jackett docker randomly stopped working? It boots up alright, log seems fine but I can't access the webui.
-
Ok so this is what I need to do? 1. Remove the swTPM binaries from /boot/extra. Do I need to uninstall them somehow? If so, how? 2. Delete the script (or at least change it so that it doesn't run at startup). Do I need to undo any changes made by the script manually or is this solved by just rebooting? 3. Undo the changes in the VM xml. I'm not really worried about any effects on the VM itself. I can easily just do a clean install if needed. I just want my unraid install to be pristine
-
Hey, I followed the swTPM guide (link below) and installed Windows 11. Could someone explain what parts I need to undo (and how) when the new unraid version hits and we have this functionality built in? I don't have Bitlocker activated. Really don't want to break anything or leave some problematic stuff behind. https://www.linkedin.com/pulse/swtpm-unraid-zoltan-repasi/
-
Nope, sorry. I had to create a new VM to get rid of this, unfortunately.. I still have no idea what caused the log spam. Please post here if you find a solution!
-
I see. Is there any duct tape solution available? Perhaps changing the nginx conf to just refuse this type of connection or something? Should I reboot the server when log hits 100%? Are there any risks involved with leaving it at 100%? I can live with not being able to get fresh log messages, but if there are harsher potential consequences I'd be more motivated to adress the issue by reinstalling windows or something.
-
I deleted a whole bunch of apps, including Cryptomator which is the only one that I know uses WebDAV. It's still happening. Am I correct to assume that it must be an app/program on my VM that is contacting my servers webui? Could it be some aspect of Windows itself doing this stuff? Some more instructions for troubleshooting would be very appreciated.
-
Tried putting my VM to sleep, just to try something. When the VM is sleeping, this error shows instead: Does this possibly lead to some conclusion?
-
Rebooted tower again, it's still ongoing. Not sure what to do next, I've been shutting down pretty much every app/service I could find in task manager. Let's see if that has an impact, otherwise I'm just clueless. Edit: it's still happening. Seems like nuking my VM and leaving windows forever is like the only viable option at this point..
-
Thank you for trying! 🙂
-
I did reboot the tower around 10 yesterday, however only the VM was rebooted after exiting Cryptomator etc in the afternoon. When I took those measures the log was not full at all, it filled during the late evening/night. tower-diagnostics-20210504-1040.zip
-
Yesterday i exited Cryptomator and a bunch of other services for good measure (Veeam, google drive sync). I also uninstalled a bunch of unused apps and updated Windows. No dice, the log is 100% again this morning. Any other advice/pointers? Is there some additional information I could provide for further troubleshooting? Thanks.
-
I run Cryptomator, I think it utilizes WebDAV. I’ll check it out!
-
It's still recurring after several restarts of both my VM and the tower itself. The log gets to 100% in like 24 hours and as soon as it's full I get this nagging feeling that I have to restart. What are the actual implications of having a 100% full log, in what way (if any) does it "harm" my servers wellbeing?
-
I am running 6.9.2, all plugins updated. The issue started after upgrading to 6.9.2 from the preceding beta version. Surprisingly the error seems to return even when the browser is closed. I also tried switching from Chrome to Firefox to no avail. I've rebooted many times, both the VM and the tower. The url is https://e796dc2d0c489161d612bf0fd71beb13294217db.unraid.net/Dashboard Full error message: (changed to a static ip. 222 instead of 16). The more recent errors occured with no webgui tab open. Thank you! tower-diagnostics-20210427-1452.zip
-
Right, I forgot to mention this IP belongs to my workstation which is a VM on the server. I made sure to close all tabs related to unraid, but it seems the errors continue anyway. I use the VM pretty much all day and I like to keep my browser open. I guess closing the browser completely or powering down the VM could be a step for troubleshooting but it won't really fix the issue, no? I am positive that the error occurs regardless of webgui tab being closed or open and logged in to. Further assistance would be very appreciated.
-
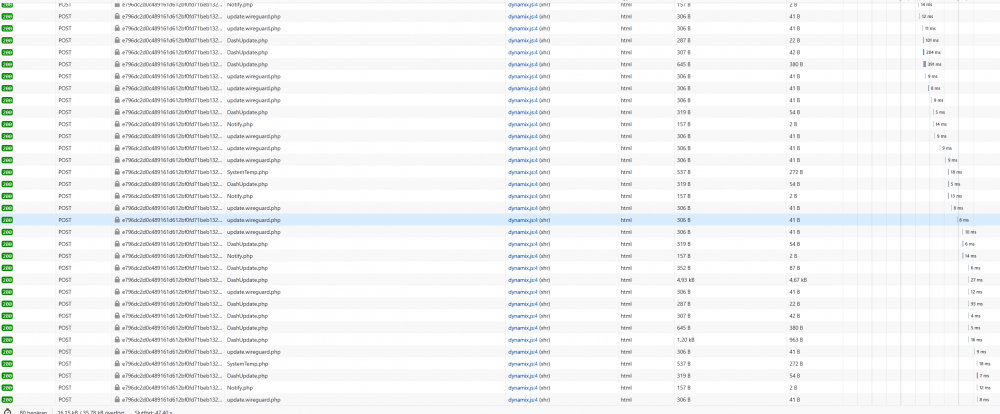
The last week my log keeps filling to 100% with these errors: Apr 18 04:30:10 Tower nginx: 2021/04/18 04:30:10 [error] 6058#6058: *800608 limiting requests, excess: 20.366 by zone "authlimit", client: 192.168.3.16, server: , request: "PROPFIND /login HTTP/2.0", I have no idea how to troubleshoot the issue and would love some guidance. I tried searching the forums and found a few others mentioning the same issue but no solution has been posted.


