


mrbusiness
Members
-
Joined
-
Last visited
-
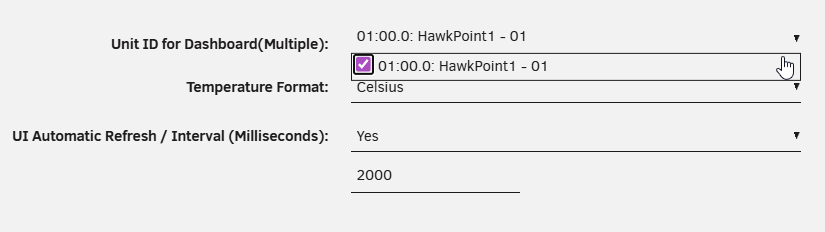
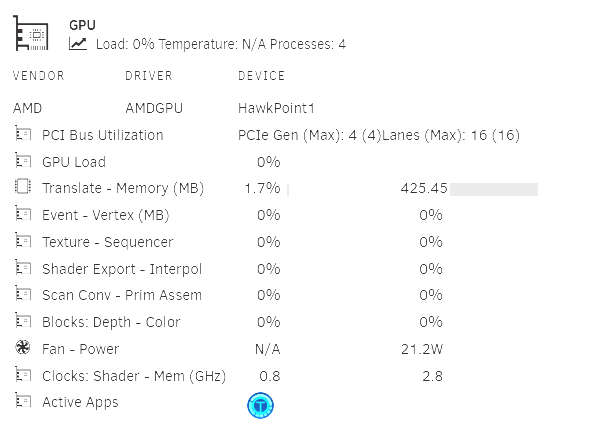
I got AOOSTAR WTR MAX with AMD R7 PRO 8845HS CPU + AMD Radeon 780M. With radeontop I get: root@Tower:~# radeontop -d - Unknown Radeon card. <= R500 won't work, new cards might. Dumping to -, until termination. 1770115276.772174: bus 01, gpu 0.00%, ee 0.00%, vgt 0.00%, ta 0.00%, tc 0.00%, sx 0.00%, sh 0.00%, spi 0.00%, smx 0.00%, cr 0.00%, sc 0.00%, pa 0.00%, db 0.00%, cb 0.00%, vram 97.77% 425.46mb, gtt 1.67% 261.64mb, mclk 100.00% 2.800ghz, sclk 29.63% 0.800ghz 1770115277.772290: bus 01, gpu 0.00%, ee 0.00%, vgt 0.00%, ta 0.00%, tc 0.00%, sx 0.00%, sh 0.00%, spi 0.00%, smx 0.00%, cr 0.00%, sc 0.00%, pa 0.00%, db 0.00%, cb 0.00%, vram 97.77% 425.46mb, gtt 1.67% 261.64mb, mclk 100.00% 2.800ghz, sclk 29.63% 0.800ghz 1770115278.772392: bus 01, gpu 0.00%, ee 0.00%, vgt 0.00%, ta 0.00%, tc 0.00%, sx 0.00%, sh 0.00%, spi 0.00%, smx 0.00%, cr 0.00%, sc 0.00%, pa 0.00%, db 0.00%, cb 0.00%, vram 97.77% 425.45mb, gtt 1.67% 261.64mb, mclk 100.00% 2.800ghz, sclk 29.63% 0.800ghz 1770115279.772486: bus 01, gpu 0.00%, ee 0.00%, vgt 0.00%, ta 0.00%, tc 0.00%, sx 0.00%, sh 0.00%, spi 0.00%, smx 0.00%, cr 0.00%, sc 0.00%, pa 0.00%, db 0.00%, cb 0.00%, vram 97.77% 425.46mb, gtt 1.67% 261.64mb, mclk 100.00% 2.800ghz, sclk 29.63% 0.800ghz 1770115280.214893: bus 01, gpu 0.00%, ee 0.00%, vgt 0.00%, ta 0.00%, tc 0.00%, sx 0.00%, sh 0.00%, spi 0.00%, smx 0.00%, cr 0.00%, sc 0.00%, pa 0.00%, db 0.00%, cb 0.00%, vram 97.77% 425.45mb, gtt 1.67% 261.64mb, mclk 100.00% 2.800ghz, sclk 29.63% 0.800ghz No actual usage shown. This is happening while I am getting 500 FPS in Tdarr while CPU is <5%. In GPU Statistics I see and this plugin is also showing 0% GPU Load: Is this CPU/GPU not compatible? Edit: I found some actual usage output with: root@Tower:~# cat /sys/kernel/debug/dri/0/amdgpu_pm_info GFX Clocks and Power: 2800 MHz (MCLK) 800 MHz (SCLK) 0 MHz (PSTATE_SCLK) 0 MHz (PSTATE_MCLK) 974 mV (VDDGFX) 965 mV (VDDNB) 19.180 W (average SoC including CPU) 24.43 W (current SoC including CPU) GPU Temperature: 50 C GPU Load: 0 % VCN Load: 99 % SMC Feature Mask: 0x07a5f2f3f3fff7ff VCN: Powered up Clock Gating Flags Mask: 0x3b8099301 Graphics Fine Grain Clock Gating: On Graphics Medium Grain Clock Gating: On Graphics Medium Grain memory Light Sleep: Off Graphics Coarse Grain Clock Gating: Off Graphics Coarse Grain memory Light Sleep: Off Graphics Coarse Grain Tree Shader Clock Gating: Off Graphics Coarse Grain Tree Shader Light Sleep: Off Graphics Command Processor Light Sleep: Off Graphics Run List Controller Light Sleep: Off Graphics 3D Coarse Grain Clock Gating: Off Graphics 3D Coarse Grain memory Light Sleep: Off Memory Controller Light Sleep: On Memory Controller Medium Grain Clock Gating: On System Direct Memory Access Light Sleep: Off System Direct Memory Access Medium Grain Clock Gating: Off Bus Interface Medium Grain Clock Gating: On Bus Interface Light Sleep: On Unified Video Decoder Medium Grain Clock Gating: Off Video Compression Engine Medium Grain Clock Gating: Off Host Data Path Light Sleep: On Host Data Path Medium Grain Clock Gating: On Digital Right Management Medium Grain Clock Gating: Off Digital Right Management Light Sleep: Off Rom Medium Grain Clock Gating: Off Data Fabric Medium Grain Clock Gating: Off VCN Medium Grain Clock Gating: Off Host Data Path Deep Sleep: Off Host Data Path Shutdown: Off Interrupt Handler Clock Gating: On JPEG Medium Grain Clock Gating: Off Repeater Fine Grain Clock Gating: On Perfmon Clock Gating: On Address Translation Hub Medium Grain Clock Gating: On Address Translation Hub Light Sleep: On
-
I have a false-positive for this rule. Share xxx is an implied array only share, but files / folders exist on the cache drive. Example: Share backups set to use pool nvme, but files / folders exist on the tank pool I use use 2 pools: nvme and tank. Both are ZFS. I cannot delete a Share folder, since ZFS will persist it. Thus, if a Share folder is on ZFS, then it should be skipped. Unless, I am misunderstanding?
-
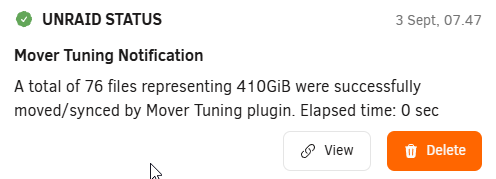
As a novice I don't always look in log or syslog. So having it in the notification as well would be ideal. Thanks.
-
Long ago I enabled 'Test dry run' and forgot about it. After some time I couldn't figure out why nothing was working and I ended up deleting the plugin. Today, I gave the plugin another try and couldn't make it work up until I noticed the 'dry run' setting. Yikes... Could you add to notifications, that it was a dry run. Either like a prefix DRY RUN: or suffix (dry run)
-
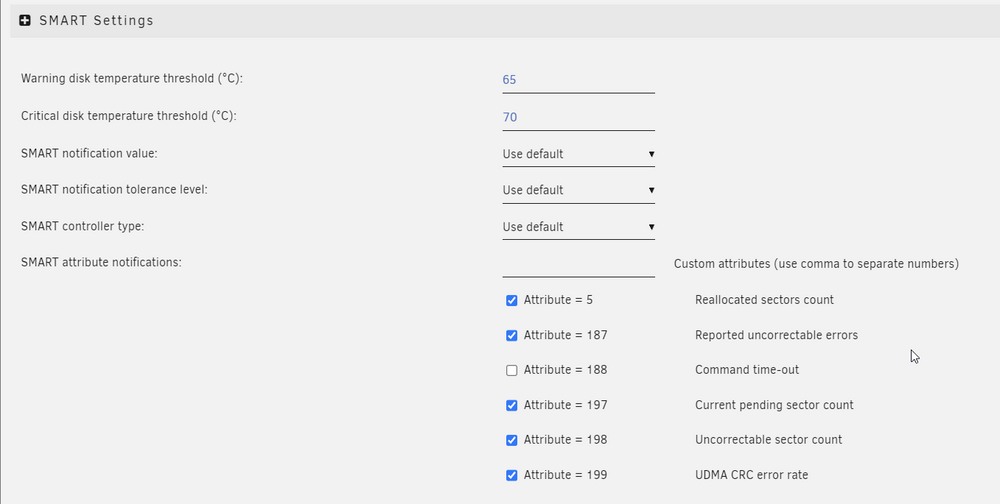
I keep getting warnings like this: But the NVMe is almost always low temps: SMART Settings: During load it reaches 55C and I have never seen it above. I already have a heatsink on. Is there something I adjust to prevent this warning all the time?


-
Yes, 4 similar NICs from this board: Alder Lake N100 NAS Motherboard ITX Home Processor DDR5 4* I226 2.5G LAN M.2 Slot 6xSATA DP HD Low Power https://a.aliexpress.com/_Ex41iIT It’s Intel I226. It has been working for a months now without this issue. Suddenly just happened. Instead of disabling in BIOS is there a way to get correct driver?
-
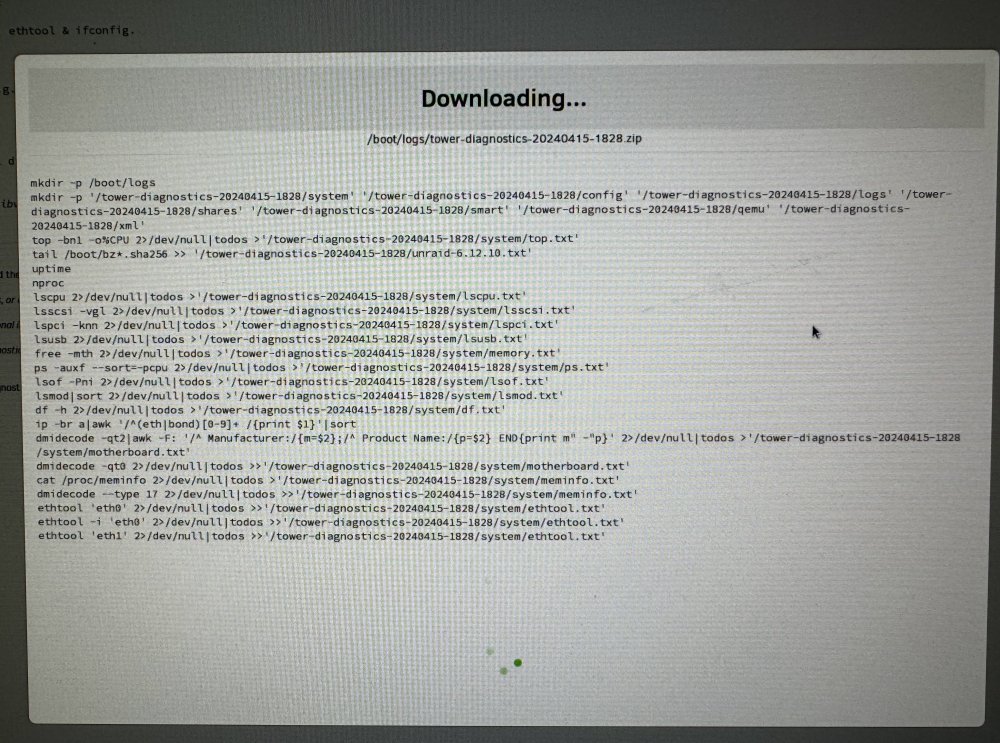
Did not work. Same issues. Diagnostics gets stuck at ethtool 'eth1' 2>/dev/null|todos >>'/tower-diagnostics-20240415-1911/system/ethtool.txt'
-
Every time I open Docker Settings or Network Settings, then my server becomes completely unresponsive. I cannot go to any page or SSH to the server either. I am forced to shutdown the server by holding power button. I have enabled syslog after last hard shutdown. Even pulling diagnostics makes the server unresponsive. So I had to attach monitor and input to get the diagnostics. The server is frozen, so I could only take a screenshot with my phone... I will try to get the logs out to a file.. I tried removing subnets, and changing multiple docker and network settings. Furthermore, I keep noticing 'eth1' as a culprit. What else can I do? Diagnostics: mkdir -p /boot/logs mkdir -p '/tower-diagnostics-20240415-1911/system' '/tower-diagnostics-20240415-1911/config' '/tower-diagnostics-20240415-1911/logs' '/tower-diagnostics-20240415-1911/shares' '/tower-diagnostics-20240415-1911/smart' '/tower-diagnostics-20240415-1911/qemu' '/tower-diagnostics-20240415-1911/xml' top -bn1 -o%CPU 2>/dev/null|todos >'/tower-diagnostics-20240415-1911/system/top.txt' tail /boot/bz*.sha256 >> '/tower-diagnostics-20240415-1911/unraid-6.12.10.txt' uptime nproc lscpu 2>/dev/null|todos >'/tower-diagnostics-20240415-1911/system/lscpu.txt' lsscsi -vgl 2>/dev/null|todos >'/tower-diagnostics-20240415-1911/system/lsscsi.txt' lspci -knn 2>/dev/null|todos >'/tower-diagnostics-20240415-1911/system/lspci.txt' lsusb 2>/dev/null|todos >'/tower-diagnostics-20240415-1911/system/lsusb.txt' free -mth 2>/dev/null|todos >'/tower-diagnostics-20240415-1911/system/memory.txt' ps -auxf --sort=-pcpu 2>/dev/null|todos >'/tower-diagnostics-20240415-1911/system/ps.txt' lsof -Pni 2>/dev/null|todos >'/tower-diagnostics-20240415-1911/system/lsof.txt' lsmod|sort 2>/dev/null|todos >'/tower-diagnostics-20240415-1911/system/lsmod.txt' df -h 2>/dev/null|todos >'/tower-diagnostics-20240415-1911/system/df.txt' ip -br a|awk '/^(eth|bond)[0-9]+ /{print $1}'|sort dmidecode -qt2|awk -F: '/^ Manufacturer:/{m=$2};/^ Product Name:/{p=$2} END{print m" -"p}' 2>/dev/null|todos >'/tower-diagnostics-20240415-1911/system/motherboard.txt' dmidecode -qt0 2>/dev/null|todos >>'/tower-diagnostics-20240415-1911/system/motherboard.txt' cat /proc/meminfo 2>/dev/null|todos >'/tower-diagnostics-20240415-1911/system/meminfo.txt' dmidecode --type 17 2>/dev/null|todos >>'/tower-diagnostics-20240415-1911/system/meminfo.txt' ethtool 'bond0' 2>/dev/null|todos >>'/tower-diagnostics-20240415-1911/system/ethtool.txt' ethtool -i 'bond0' 2>/dev/null|todos >>'/tower-diagnostics-20240415-1911/system/ethtool.txt' ethtool 'eth0' 2>/dev/null|todos >>'/tower-diagnostics-20240415-1911/system/ethtool.txt' ethtool -i 'eth0' 2>/dev/null|todos >>'/tower-diagnostics-20240415-1911/system/ethtool.txt' ethtool 'eth1' 2>/dev/null|todos >>'/tower-diagnostics-20240415-1911/system/ethtool.txt' logs.zip
-
I just got the new LincStation N1 and I am setting up the array. I added the disks as XFS. I decided to remove 2 NVMEs with no data on it and add them as a cache pool in BTRFS. Suddenly my Kingston NVMe (disk 3) in the array with all AppData gives the messages "XFS - Unmountable: Unsupported partition layout". I read in other threads the UFS Explorer is the way, but it can only run on Windows as far I can tell. What other options do I have? linc-diagnostics-20240129-0829.zip
-
I just got 4 drives exchanged free-of-charge with Seagate. So at least there's that.
-
@JorgeB Correct - It was a typo. It was RAID0. I did not see your reply before I tried running last night: btrfs restore -v /dev/nvme0n1p1 /mnt/disk2/restore It worked! I have all my data in the restore folder now and things are back to how they should be. Thanks for the suggestion though!
-
I was trying to remove one nvme disk from my raid1 pool by following the guide: I did the following: Stopped docker and VM Stopped array Removed cache2 from pool Pressed "I am sure" Started array I saw the unmountable fs I stopped array and tried adding back the removed cache2. It didn't work. Now I cannot mount any of the nvme's and I'm afraid the fs is corrupt. I tried to rescure it by following the guide: The guide does not specify how to mount multiple nvme drives. Also, /dev/sdX1 devices are array disks and not nvme's. I tried with the command: mount -o rescure=all,ro /dev/nvme0n1p1 /temp but it gives error: mount: /temp: wrong fs type, bad option, bad superblock on /dev/nvme0n1p1, missing codepage or helper program, or other error. dmesg(1) may have more information after failed mount system call. I am not sure what I am doing with brtfs. What can I do? tower-diagnostics-20230105-1935.zip
-
I followed this guide to get rsync working with Hyper Backup for Synology NAS: https://www.beatificabytes.be/backup-synology-to-unraid/ It should probably be like this by default in unRAID.
-
@JorgeB I usesd UFS Explorer now to see if it might work. I am not missing any crucial data, so I guess I will just reformat the disk now. Thanks for the help.
-
I just did as you said and the same errors occcur: Phase 1 - find and verify superblock... superblock read failed, offset 0, size 524288, ag 0, rval -1 fatal error -- Input/output error tower-diagnostics-20221110-1517.zip log.zip


