





MammothJerk
Members
-
Joined
-
Last visited
Everything posted by MammothJerk
-
i have an issue with my smart health overview where every drive shows up twice (and my SSD cache shows up thrice) as you can see the duplicate row only has the "health ok?" info which the other row is missing, and they both have the same device id.
-
awesome job on 1.6! 👍👍 Couple of comments i have: the installing of dalvany-image-panel seemed kinda strange, i had to install about 3 times before it actually started working even with restarts in-between. Not sure what was up with that The "array status" field $.['servers']['https://192.168.1.7']['serverDetails'].arrayStatus needs to be edited to match your own server ip. Or i think the entire field can safely be changed to just $.['serverDetails'].arrayStatus i did not have to login again when i changed the vm/docker base url, it just worked straight away. but since you are using SSL then that would be the difference most likely. For people running without SSL the base url should just be the unraid server ip. you should be able to grab it as a variable from the unraid api source maybe? The SSD variables are not universal and might have to be tailored to your specific SSD vendor as well. i have a kingston A400 SSD https://www.kingston.com/datasheets/SA400S37_en.pdf and i had to change the Data_Units_Reda/Written to Total_LBAs_Read/Written and then add *512 to math to get an accurate reading. I'm not sure how many people use "Anime Shows" as their plex library name, i would've thought it'd just be "Anime" that's just my opinion though. For me i had to change the regex in RAM DIMM temp to actually match mine which then became /dimm.._temp/ it's possible theres a better regex to match most dimm temps rather than just /..-dimm/ but i wouldn't know most naming schemes 🤔. Why is there a currency suffix variable that is unused? i have to enter the three UPS panels and change the Field->Unit->Currency to my locale and the top variable seems to do nothing? i suspect it was supposed to be integrated at some point but just got missed? 😂 Again, Great job @falconexe!
-
If i am force rechecking hundreds of torrents some of them will sometimes start downloading for a split second EVEN THOUGH theyre PAUSED. This sometimes overwrites the already correct download with a new file and i'll have to download the entire thing again any way to fix this? when force rechecking it should NEVER start downloading if the initial state is paused.
-
1. I'm only using the delugevpn privoxy for sonarr. 2. 192.168.1.0/24 and my server address is 192.168.1.105 3. sonarr and delugevpn are both running bridged. delugevpn settings: Sonarr settings With the latest delugevpn container sonarr can only connect to deluge download client if the host is set to 172.17.0.9. localhost or 192.168.1.105 does NOT work. Same story with the proxy under general > proxy. downgrading to the previous container i have no issues.
-
Wait so to clarify: for dockers to make use of the delugevpn privoxy (and even the download client for radarr/sonarr/lidarr) they must have "--net=container:Binhex-DelugeVPN" in their extra parameters?
-
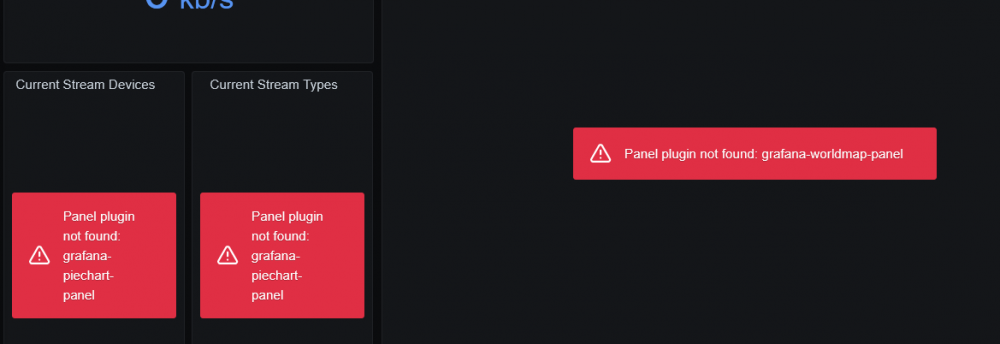
I had to install the grafana-worldmap-panel and the grafana-piechart-panel for those specific panels to show up under my plex section. Just paste these 2 commands in the Grafana docker console and then restart the container 😁 grafana-cli plugins install grafana-worldmap-panel grafana-cli plugins install grafana-piechart-panel Great progress in 1.5!
-
I'm tunneled into my network from accross the country and i'm having a weird issue trying to connect. I have 2 unraid servers on this local network both setup with a separate tunnel connection because of this specific issue. When i'm connected to server1tunnel i cannot access the deluge thinclient connection on server1, but i CAN access the deluge thinclient connection on server2. Same thing when connected to server2tunnel i cannot access the deluge thinclient connection on server2, but i CAN access it for server1. What is weird is that i can access the webUI from either of the tunnel connections, its just the thinclient that does not work. I've also noticed that i cannot use the PiHole as DNS server if i am connected to server1tunnel, but i can use it when using the server2tunnel (pihole is setup on server1). i also have some weird server1 webUIs that do not work when im connected to the server1tunnel, like soulseek, pihole, and seemingly any docker using VNC to use dockers such as mkvtoolnix, krusader, etc. I'm having none of these problems when on location at the local network so i must have something wrong with the tunnel setup. Any ideas?aha i see. Seems like very strange behaviour to only report UPS load when disconnected, but atleast i know my UPS is not broken, thanks!Disconnecting the mains from my ups for about a minute did indeed change the shown UPS load to now 182 watts while the charge decreased to 93% any steps where to go from here? sorry for the long delay, i haven't had physical access for some time edit: When the server is on UPS power the UPS load will update in realtime together with the battery percentage this is how my grafana graph looks like to show how useless it is when i dont get the updated correct information lol, the last fluctiations are after disconnecting the mains While the UPS is charging the UPS load does not seem to update again, it will only update if the mains is disconnected..I'm having an issue where UPS load is not updating at all. It starts out at 162W and sits there stuck even with load changes and parity checking etc. it never changes. Any idea why i'm having this problem? I would use the built-in unraid APC UPS plugin but that doesnt give me any info whatsoever, its just stuck when starting for some reason.My UPS is a bit finicky with the apcups plugin and does not always work correctly, NUT however always works and i created a small edit to the UPS section if you would like to add the option for NUT. Firstly you need the "NUT Network UPS Tools" plugin for unraid and then the "maihai/nut-influxdb-exporter" docker to get the data to the influxdb database. then all you need to do is change the variables around a bit and it works just the same as the apcups option Attached is the UPS section of the main dashboard edited to work with NUT :). NUT UPS Dashboard for falconexe-1601050759513.jsonI liked this dashboard so much i decided to install it on my other unraid box as well :), but i'm having an issue with CPU temp :(. I cannot get my CPU temp from IPMI since this is an unraid box made from spare parts and lacks IPMI support, i can see the CPU temp in the unraid dashboard so i assume it should be possible to send that reading through telegraf, the question is how? the telegraf [[inputs.cpu]] seem to only take care of usage, not temperature. the guide also seems to be missing [[inputs.net]] and [[inputs.docker]], i had to uncomment both of these to get any readings for network and docker on this other box. Lastly just a minor thing, i run both my dashboards on the same grafana instance and i would like to be able to switch between them seamlessly in kiosk mode. Currently i have "dashboard Links" setup on each dashboard to navigate to each-other, the problem is that this button gets hidden in kiosk mode, Is there any way to keep it on top even in kiosk mode? 😁There we go 😁 It appears by default it is commented as "attributes = false" i had uncommented it which is probably what screwed me there, changing it to "true" has fixed my problem. Thanks for your helpI fixed the diskio tags and i see where i was missing out on that one hehe. It did not fix the POH issue though, removing the LIMIT didn't change anything either.ah ok, it seems like there is no data so perhaps i screwed up with telegraf.conf? all i did was uncomment [[inputs.diskio]]. # Read metrics about disk IO by device [[inputs.diskio]] # By default, telegraf will gather stats for all devices including # disk partitions. # Setting devices will restrict the stats to the specified devices. #devices = ["sda", "sdb", "vd*"] # Uncomment the following line if you need disk serial numbers. #skip_serial_number = false # On systems which support it, device metadata can be added in the form of # tags. # Currently only Linux is supported via udev properties. You can view # available properties for a device by running: # 'udevadm info -q property -n /dev/sda' # Note: Most, but not all, udev properties can be accessed this way. Properties # that are currently inaccessible include DEVTYPE, DEVNAME, and DEVPATH. #device_tags = ["ID_FS_TYPE", "ID_FS_USAGE"] # Using the same metadata source as device_tags, you can also customize the # name of the device via templates. # The 'name_templates' parameter is a list of templates to try and apply to # the device. The template may contain variables in the form of '$PROPERTY' or # '${PROPERTY}'. The first template which does not contain any variables not # present for the device is used as the device name tag. # The typical use case is for LVM volumes, to get the VG/LV name instead of # the near-meaningless DM-0 name. #name_templates = ["$ID_FS_LABEL","$DM_VG_NAME/$DM_LV_NAME"] ok i just re-read the front page and noticed i missed the part about the diskio tags 😬, ill fix that and test againquick reply 😁 here ya go { "request": { "method": "GET", "url": "api/datasources/proxy/1/query", "params": { "db": "telegraf", "q": "SELECT last(\"raw_value\") AS \"Power On Hours\" FROM \"smart_attribute\" WHERE (\"name\" = 'Power_On_Hours') AND time >= now() - 12h GROUP BY \"device\" LIMIT 10", "epoch": "ms" }, "data": null, "precision": "ms" }, "response": { "results": [ { "statement_id": 0 } ], "executedQueryString": "SELECT last(\"raw_value\") AS \"Power On Hours\" FROM \"smart_attribute\" WHERE (\"name\" = 'Power_On_Hours') AND time >= now() - 12h GROUP BY \"device\" LIMIT 10" } }Thanks for your great work, this works awesome The only issue i have is the "Drive Life" power_on_hours being the only graph not working, any idea what the problem is and/or how to troubleshoot it? all my drives has the power_on_hours attribute but it's not being imported somehowRecently i decided i wanted to setup tunnels on my 2 local unraid boxes to route all of their traffic through my VPN provider but for now it does not seem to be possible. It seems like you can only use EITHER the remote tunneled access OR the VPN tunneled access, you cannot use them both at the same time so im either unable to access my local network from remote OR my local unraid boxes will not go through the VPN. Is there a way to enable both "VPN tunneled access" AND "Remote tunneled access" at the same time? or a function that works similarly?I'm also using Mullvad and running into the same issue as Monkeysphere and notcarl I also had a question, is it possible to have "Remote tunneled access" and "VPN tunneled access" at the same time? i always want my unraid box to connect to the internet via my VPN but i also wanna be able to connect to my LAN remotely, and also take advantage of the VPN. Is this possible? the "Remark: this must be the only peer in the tunnel and sole active tunnel when in use" on VPN tunneled access seem to indicate this is currently not possible, but would it be feasible to implement?I figured out what the issue is in libtorrent max_peerlist_size is set to 3000, increasing that solved my issue... for now... 😁This is the only real issue i've had so far. as long as i dont access any label that has 1000+ torrents in it it works as smooth as can be. Is there another client i should be using if i have this many torrents? i haven't changed these settings for a long time so i wouldnt think they are the cause..Hey, i have an issue where whenever i restart my container i have a lot of torrents that have been paused, and i have to manually restart them, this has several issues where sometimes i will get an HnR warning and sometimes a torrent will just stop downloading completely. I recently reached 6000 torrents in my client so i was wondering if there way maybe a cap there or something? any help pointing me in the right direction would be nice, thanks. Here are my settingsGood news, i split up my cache and changed the filesystem to xfs, now downloading for 15~minutes @ 50megabytes/second and my cpu is sitting at around 40% with periodical 100% spikes on any of the cores, which is pretty normal usage. @SundarNET do you reckon the btrfs cache pool was your issue as well? perhaps your appdata folder is stored on the cache pool? edit: i've actually noticed that all of my dockers are more responsive now, definitely seems to be an issue with btrfs cache pool...My internet speed is 1000/1000 megabit and unraid is showing 100% CPU on transfers around 20-30 megabytes, if i cap the speed to around 10 megabytes my CPU is fine. I'm using a btrfs cache pool, i was going to change it in the next unraid release but i should be fine with a bit lower space until then. I'll change it to xfs and see what happens. I'm indeed using a Xeon CPU as well. Tried installing unraid on an old pc running a 4770k and im DLing at around 30 megabytes/s and i'm not seeing any CPU spikes. Though since it's a completely different system and CPU is not the only thing being different im not sure how valuable this information is.



