DaveDoesStuff
Members
-
Joined
-
Last visited
Everything posted by DaveDoesStuff
-
First off, awesome plugin! Been using it for close to a year now without issue. Really, really useful. Currently I'm using it for an NVME drive to run my VMs (and a couple of dockers) off of. Everything was fine until I changed my array (and UD) encryption to a keyfile, now the array starts on reboot but the UD NVMe drive will no longer auto mount (it's unlocked successfully via the keyfile but just isn't mounted). Has anyone come accross this before and/or have a fix?
-
So it seems that this issue was caused by a pending restart/update after I installed unraidDVB and it patched the kernal. On a whim I decided to try and re-enable wireguard after I did the restart today and it worked straight out of the box! For any other PIA people getting wireguard working with a NextGen server configured for it has restored my PIA speeds to the point where I can max out my connection again. Although it does bounce around a lot.
-
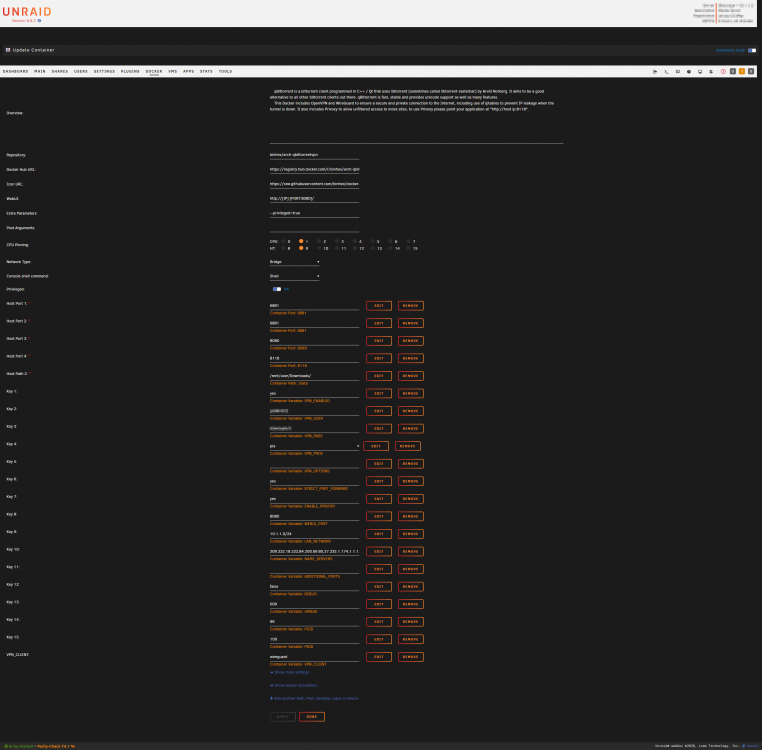
Bizzarre indeed! I can clearly see in the CMD output that when I toggle it and save the changes it is indeed running with it set to true (which you probably confirmed in the logs also): root@localhost:# /usr/local/emhttp/plugins/dynamix.docker.manager/scripts/docker run -d --name='binhex-qbittorrentvpn' --net='bridge' --cpuset-cpus='1,9' --privileged=true -e TZ="Europe/London" -e HOST_OS="Unraid" -e 'VPN_ENABLED'='yes' -e 'VPN_USER'='XXXXX' -e 'VPN_PASS'='XXXXX' -e 'VPN_PROV'='pia' -e 'VPN_OPTIONS'='' -e 'STRICT_PORT_FORWARD'='yes' -e 'ENABLE_PRIVOXY'='yes' -e 'WEBUI_PORT'='8080' -e 'LAN_NETWORK'='10.1.1.0/24' -e 'NAME_SERVERS'='209.222.18.222,84.200.69.80,37.235.1.174,1.1.1.1,209.222.18.218,37.235.1.177,84.200.70.40,1.0.0.1' -e 'ADDITIONAL_PORTS'='' -e 'DEBUG'='true' -e 'UMASK'='000' -e 'PUID'='99' -e 'PGID'='100' -e 'VPN_CLIENT'='wireguard' -p '6881:6881/tcp' -p '6881:6881/udp' -p '8080:8080/tcp' -p '8118:8118/tcp' -v '/mnt/user/Downloads/':'/data':'rw' -v '/mnt/disks/UD_SSD/AppData/binhex-qbittorrentvpn':'/config':'rw,slave' 'binhex/arch-qbittorrentvpn' 9b76b47381e4fb14f762b1b87757888056b7aed2e9e4ae044bfc7113e0808968 Would there be any value to just blowing away the whole thing and re-installing from CA Apps? It's not ideal with 75 torrents in my queue so I was holding this option way back in reserve Hmm, not likely to be related (or possibly already addressed) but I found someone with a similar wireguard issue from April from a different container...might be something to it. But probably not https://github.com/linuxserver/docker-wireguard/issues/17
-
The slider was still set to on, I toggled it on/off then restarted twice and no change. Same issue. I then toggled it off and re-added the extra parameter --privileged=true and the issue persists. I followed those instructions to the letter, log file attached. Info removed/replace was username, pass and the wireguard public and private key (replaced with X's). supervisord.log
-
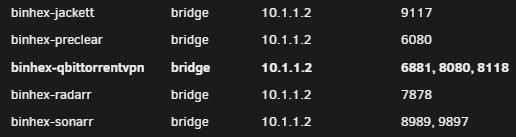
Fair enough. The plot thickens however: 2020-10-14 11:31:48,391 DEBG 'start-script' stderr output: [#] ip link add wg0 type wireguard 2020-10-14 11:31:48,393 DEBG 'start-script' stderr output: RTNETLINK answers: Operation not supported 2020-10-14 11:31:48,395 DEBG 'start-script' stderr output: Unable to access interface: Protocol not supported 2020-10-14 11:31:48,395 DEBG 'start-script' stderr output: [#] ip link delete dev wg0 2020-10-14 11:31:48,397 DEBG 'start-script' stderr output: Cannot find device "wg0" 2020-10-14 11:31:48,397 DEBG 'start-script' stdout output: [warn] WireGuard interface failed to come 'up', exit code is '1' Thats with the default wg0.conf, I originally had input france.privacy.network:1198 with which it also failed before deleting the conf and restarting as I assumed I had messed it up. The above in the logs was preceeded by: 2020-10-14 11:30:18,310 DEBG 'start-script' stdout output: -P INPUT DROP -P FORWARD DROP -P OUTPUT DROP -A INPUT -s 172.17.0.0/16 -d 172.17.0.0/16 -j ACCEPT -A INPUT -i eth0 -p udp -m udp --sport 1337 -j ACCEPT -A INPUT -i eth0 -p tcp -m tcp --dport 8080 -j ACCEPT -A INPUT -i eth0 -p tcp -m tcp --sport 8080 -j ACCEPT -A INPUT -s 10.1.1.0/24 -i eth0 -p tcp -m tcp --dport 8080 -j ACCEPT -A INPUT -s 10.1.1.0/24 -d 172.17.0.0/16 -i eth0 -p tcp -j ACCEPT -A INPUT -p icmp -m icmp --icmp-type 0 -j ACCEPT -A INPUT -i lo -j ACCEPT -A INPUT -i wg0 -j ACCEPT -A OUTPUT -s 172.17.0.0/16 -d 172.17.0.0/16 -j ACCEPT -A OUTPUT -o eth0 -p udp -m udp --dport 1337 -j ACCEPT -A OUTPUT -o eth0 -p tcp -m tcp --dport 8080 -j ACCEPT -A OUTPUT -o eth0 -p tcp -m tcp --sport 8080 -j ACCEPT -A OUTPUT -d 10.1.1.0/24 -o eth0 -p tcp -m tcp --sport 8080 -j ACCEPT -A OUTPUT -s 172.17.0.0/16 -d 10.1.1.0/24 -o eth0 -p tcp -j ACCEPT -A OUTPUT -p icmp -m icmp --icmp-type 8 -j ACCEPT -A OUTPUT -o lo -j ACCEPT -A OUTPUT -o wg0 -j ACCEPT Not sure if this helps but my allocations for the container are:
-
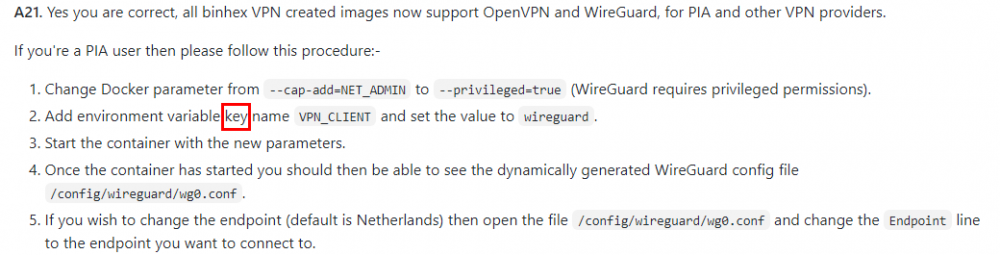
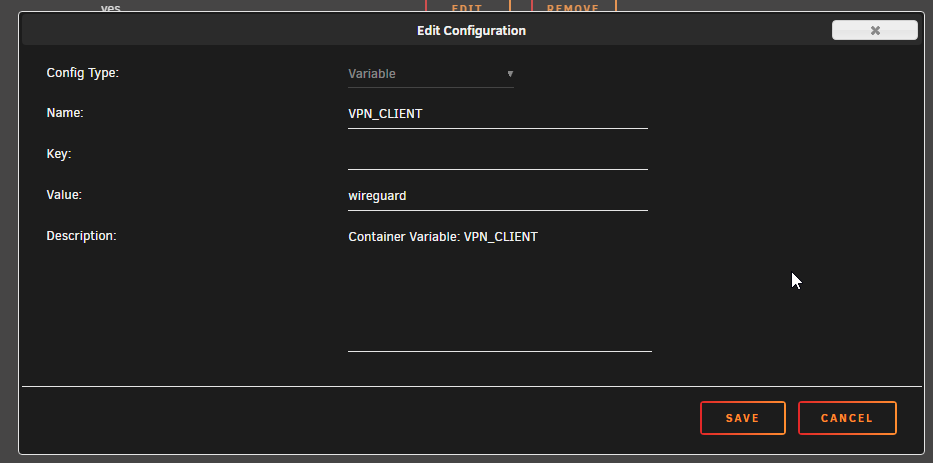
Damn, my reading comprehension is off today. Sorry for wasting your time on that, you clearly say key in the FAQ and I just missed it: Thanks for the assist! Actually one other question, what is the format for having mutliple potential endpoints in wg0.conf or is it not supported with WG as it is with OVPN?
-
Sorry I had meant to remove the extra parameter. Just tried it incase setting privelledged to true via the slider wasn't working (for some unknown reason). I've removed it, slider is still set to on and the error persists. As requested:
-
Hey @binhex, your apps/containers are awesome! With that obvious FACT out of the way I'm having some trouble getting wireguard running. My config is below based on the guide (step 21) HERE but when I start I get an warning of: [warn] VPN_CLIENT not defined (via -e VPN_CLIENT), defaulting to 'openvpn' I've been staring at the page for ages so I'm hoping you'll see something I am now blind/immune to Any help is appreciated, my speeds went to complete dogshit after switching to PIA nextgen via OpenVPN...hopeing WG may improve things. Thanks for your awesome work!
-
Works like a charm! You are an absolute hero man. I was so frantic over the slight data loss/other issues earlier (which were totally unrelated to your script) that I would have struggled to figure out how to do that. I really wish I had spotted that damn rollback from the unraidDVB plugin earlier before my (accidentally/stupid) formatting etc, I'd be 100% if it wasn't for that. Definitely need to learn not to panic lol! To be fair I had actually completely forgotten I had added encryption to that UD. But in hindsight I must have done it when I moved over some dockers/vms there due to performance issues when they were running from cache. This is something I should have remembered/noticed (during the key replacement) as missing from the scripts output/confirmation. So again not you or the scripts fault. All on me. I plan on getting 2x 1TB NVMEs in the future to replace both my cache (4x 250GB) and the UD SSD...I really wish I had done it already after this haha! Luckily I at least had regular config file backups so that was easy to fix, but this (and some other incidents) has really opened my eyes to the fact that I should have a seconday offsite storage/backup setup. So that is going to come before the new NVMEs I think. In summary: THANK YOU!!!
-
Firstly thank you for the help, it's 1am here now and I'm at my wit's end lol. I just posted prior to your reply that I got the UD to accept the old key. So if you could talk me through adding the new keyfile (/boot/config/keyfile) to that drive I would appreciate it. The identifier of the UD in question is sdo according to the GUI.
-
This is definitely down to the key change, if I remove the line in my go file where I point it at the keyfile and instead out in a passphrase them all the drives that accepted the keyfile become locked and my unassigned device suddenly becomes mountable. Is there a workaround for this or if not a way to switch back to my old passphrase?
-
So it turned out that issue was caused by a bad system link for "keyfile" already being in root (fry config file). The other issue (I discovered too late as I already mistakenly formatted some drives) was caused by an inadvertent downgrade to an older version of unraid via the unraidDVB plugin My last remaining issues are that my unassigned device (an SSD) that hosts all my VMs is now unable to be mounted with the error: "unassigned.devices: luksOpen error: No key available with this passphrase." ...that has to be related right? The weird thing is the file system on the UD is just "luks"... Also on a less urgent note the array won't autostart, it tells me autostart is disabled on boot. But the UD problem is far more important as my pfsense VM is on there and without it I have a house with no internet and a very angry wife!
-
So I ran the script as described. It listed all my drives and asked me to confirm I wanted to use my new keyfile. I confirmed and did the restart once completed. Now the array won't start with missing key error. Even if I select the keyfile manually through the GUI it still fails. Passkey also fails. The keyfile itself is located in /boot/config/keyfile It is a single line keyfile with a simple string of random characters. Any advice would be appreciated! EDIT: Something strange I have noticed is that on the main page in GUI mode 2 of the disks in my array have green lock icons (encrypted) while the other 5 disks plus my cache all have a yellow lock icon (to be encrypted). EDIT2: It turned out to be a spelling mistake in my "go" file that meant the system link from root to the keyfile. This fixed the missing key issue. However 5 array devices and my cache (4 drives) are all showing yellow lock icons (to be encrypted) and main is giving me the option to format. Also my unassigned device that runs all my vms and docks is now showing up as new
-
Thanks for that, I've been pouring over the forums/wiki trying to figure out how to switch to a keyfile from a passphrase or what the format of the keyfile should be/how to generate one. It's a surprisingly poorly documented feature (would love to be proven wrong on that). I'll give it a try when I'm back at my desk tonight. Thanks again!
-
Is there any way to use the script to switch from a password encrypted array (manual entry on array start, no keyfile) to an encrypted array with a keyfile?
-
Thanks for that, I had seen that post on github but was unclear on whether or not the fix/improvement was already made or not.
-
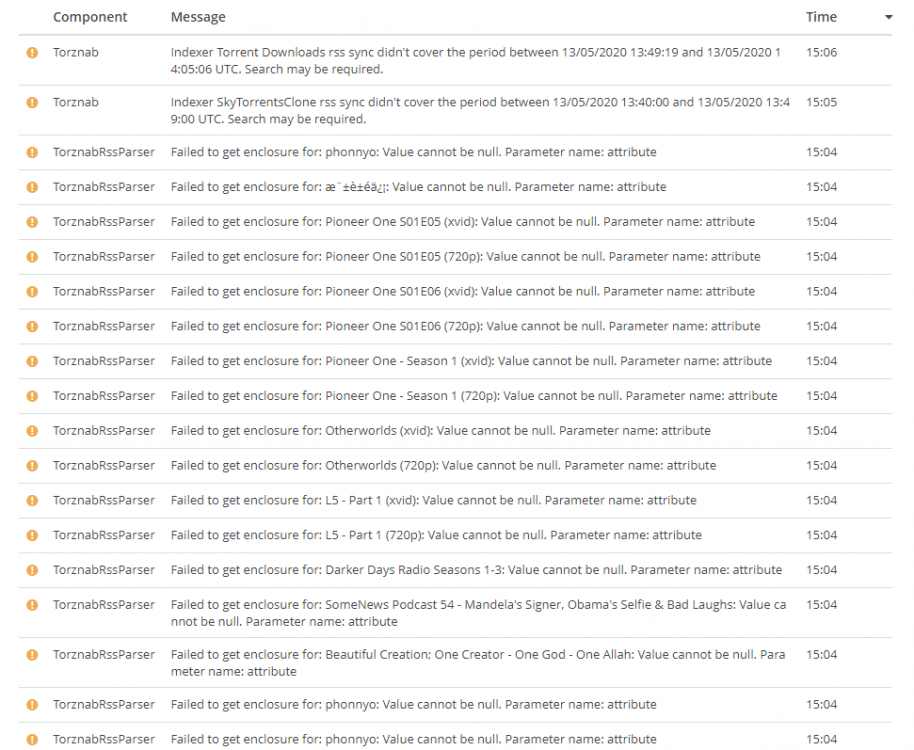
Started getting parsing errors and torznab feed errors around 3 days ago, right around the time there was an update if I remember correctly. These issues usually coincide with Radarr/Sonarr/Qbittorrentvpn (all binhex) suffering from a major slow down. But possible that's not relevant. Failed to parse magnetlink for movie 'Howl's Moving Castle (2004) [BluRay] [1080p] [YTS] [YIFY]': 'magnet:?xt=urn:btih:7C7A5296A370A5D8067C712DA5146BF5A868E846&dn=Howl's+Moving+Castle+(2004)+[BluRay]+[1080p]+[YTS]+[YIFY]&tr=udp://tracker.coppersurfer.tk:6969/announce&tr=udp://9.rarbg.com:2710/announce&tr=udp://p4p.arenabg.com:1337&tr=udp://tracker.leechers-paradise.org:6969&tr=udp://tracker.internetwarriors.net:1337&tr=udp://tracker.opentrackr.org:1337/announce&tr=udp://tracker.zer0day.to:1337/announce&tr=udp://tracker.leechers-paradise.org:6969/announce&tr=udp://coppersurfer.tk:6969/announce': A field-value pair of the magnet link contain more than one equal'. System.FormatException: A field-value pair of the magnet link contain more than one equal'. at MonoTorrent.MagnetLink.ParseMagnetLink (System.String url) [0x002b0] in C:\projects\radarr-usby1\src\MonoTorrent\MagnetLink.cs:93 at MonoTorrent.MagnetLink..ctor (System.String url) [0x00022] in C:\projects\radarr-usby1\src\MonoTorrent\MagnetLink.cs:32 at NzbDrone.Core.Download.TorrentClientBase`1[TSettings].DownloadFromMagnetUrl (NzbDrone.Core.Parser.Model.RemoteMovie remoteMovie, System.String magnetUrl) [0x00004] in C:\projects\radarr-usby1\src\NzbDrone.Core\Download\TorrentClientBase.cs:203 The above is happening for any attempt to add a movie/release (no matter the tracker) with a ' in the title. Error taken from Radarr. The below is what the sonarr logs look like, pages and pages of this...not sure if its related but all my trackers for Sonarr and Radarr are all done through jackett only. For the record I'm not attempting to track/call for any of the content mentioned in that above list (pioneer one, allah the movie lol). I'm aware this is the jackett thread, but the issues being logged in Radarr and Sonarr to point to jackett and jacketts logs are practically empty so I've attached them in case it's helpful. But to be honest I'm having a hard time telling where these sudden issues lie so sorry if I'm being an ass and looking at the wrong thing. radarr.txt sonarr.txt