Iker
Community Developer
-
Joined
-
Last visited
Everything posted by Iker
-
Answers to the questions: Thanks!, Through the "donate" link in my App profile, Red Peroni is my favorite!. No problem; I will update for 12h format on the next release As weird as it may sound, this is directly related to the "display last loaded data". The communication protocol (Nchan) retains the last message published; that's why the last refresh at is changed to the page refresh timestamp. I'm testing if that "not a bug but a feature" of Nchan can be leveraged as a cache to keep a copy of the last data loaded by the plugin or if I have to keep a copy of the last data on a file(Technically, is ram) located on "/tmp". However, this testing is in a very early stage, so please bear with me for a while. In the meantime, please keep testing the plugin and all the other functionalities, and report any other bug you may find. Best,
-
Well, enjoy, my friends, because a new update is live with the so-long-awaited functionality; the changelog is the following: 2023.09.27 Change - "No refresh" option now doesn't load information on page refresh Fix - Dynamic Config reload The "Dynamic Config reload" means you don't have to close the window for the config to apply correctly.
-
It's working as expected, or at least how I designed it; given the massive amount of changes in the backend for this version, I didn't want to introduce a functionality change that didn't result intuitively to a user. If you guys agree and it's really what is most useful for you, I can modify the "No refresh" functionality to not pull any info unless you click the button. About your config not applying @samsausages.
-
A new update is live with the fix for the issues mentioned, the changelog is the following: 2023.09.25.72 Fix - Config load Fix - Exclusion patterns for datasets with spaces Fix - Destroy dataset functionality
-
That's not the result of a script, is related to docker folder, configure your exclusion pattern as "/system/.*" and everything should work as expected. I will look into those two things. The destroy action was changed to a zfs program, probably it doesn't work as expected.
-
Yes, everytime you visit Main page a refresh is automatically requested.
-
Hi guys, a new update is live with the following changelog: 2023.09.25 Add - Lazy load functionality Add - Nchan for updates Add - Refresh options (Including On demand) Add - Last refresh timestamp Add - Dynamic refresh after an operation. Change - Migration to zfs programs for most operations Change - Quota setting on Create Dataset Dialog Change - Notifications and messages improvement Change - Edit datasets UI as a dropdown menu Fix - Default permissions for datasets (u:nobody, g:users) Fix - Dataset passphrase input not masked Fix - ZPool regex not caching some pools Fix - Dataset passphrase size difference Fix - Multiple typos Fix - PHP 8 Compatibility How Lazy Load Works? Lazy load is a new feature (You should enable it on the settings page) that loads the data in two stages: Load datasets: This stage loads all the datasets and the associated information for the pools (size, attributes, etc.) except the Snapshot lists. This little change improves initial loading times by up to 90% (Less than a second in most cases). However, be aware that all Snapshot-related information and options will be unavailable. Load Snapshots: In this stage, the snapshot information and options are loaded and updated dynamically in the GUI; the time this takes depends on how many datasets and snapshots you have in your pool. This change increments the total load time up to 20%; however, the interface feels more responsive. In summary, Lazy Load provides a very good improvement on initial load times, but it increments the total load time; the following is a comparison of what you can expect: Previous Version Load time: 1.5s New Version (No Lazy Load): Load time: 1.4s New Version (Lazy Load): Load Datasets time: 196ms Load Snapshots: 1.75s (This includes the initial 196 ms) Refresh options and Spinning disk up? In this new version, there are additional options for the refresh interval, one of them being "No refresh." it can be used in combination with the Lazy Load functionality; however, it's going to spin up your disks on the initial load, after that it's not going to update the information (Spin up the disks) unless you press the ZFS Master refresh button. PS: Solved on 2023.09.27 with "No refresh" option. Why is my configuration not Applying? The new version moves away from POST and GET requests for updating the info and adopts the WebSockets way (Nchan); this has a disadvantage: any changes to the configuration are not applied immediately, you have to close all the Unraid Windows opened, wait for 10 seconds (For the Nchan process to die) and open again the Windows for the config to apply, I'm fully aware of this problem and working on how to solve it correctly. PS: Solved on 2023.09.27 Finally, this version required a good amount of changes on almost every single plugin functionality, so, multiple bugs are expected to appear, please don't hesitate to report them here. Best
-
Hi @lazant can you please send me the output of the "zpool list -v" command via PM. Please execute it only once the pool dissapears.
-
Hi, I took a quick look at your log, but I'm just the GUI plugin developer, not a ZFS expert. However, your issue seems to be directly related to your ZFS config and devices: warning: cannot send 'cache/appdata/PlexMediaServer@autosnap_2023-09-09_17:53:23_monthly': Input/output error cannot receive resume stream: checksum mismatch or incomplete stream. Partially received snapshot is saved. A resuming stream can be generated on the sending system by running: zfs send -t 1-10cf527f24-f0-789c636064000310a500c4ec50360710e72765a526973030bcbb0c5184219f96569c5a02926181cbb321c9275596a41603698377a66b58b0e82fc94f2fcd4c6160d870a72d4d34f0495702923c27583e2f313795812139313923553fb1a02025b124513f2027b5c2373525333138b5a82cb5c821b1b424bf382fb120dec8c0c858d7c01288e20dcdad4c8dad8c8ce373f3f34a32722a19e00000da702c09 CRITICAL ERROR: zfs send -t 1-10847dff44-f0-789c636064000310a500c4ec50360710e72765a526973030bcbb0c5184219f96569c5a02926181cbb321c9275596a41603e98a97c66b58b0e82fc94f2fcd4c6160d870a72d4d34f0495702923c27583e2f313795812139313923553fb1a02025b124513f2027b5c2373525333138b5a82cb5c821b1b424bf382fb120dec8c0c858d7c01288e20dcdad4c8dad8c8ce373f3f34a32722a19e00000fe052c4a | pv -p -t -e -r -b -s 14533384376 | zfs receive -s -F 'disk3/Backups/cache_appdata/PlexMediaServer' 2>&1 failed: 256 at /usr/local/sbin/syncoid line 637. I recommend you perform a pool scrub check for any possible checksum errors, and if the issue persists, post it to the General support thread here in the forum.
-
This doesn't seem to be related directly to the plugin, as there is not so much processing on the plugin to be honest. Probably something else running at the same interval, try changing the refresh interval on the plugin settings and checking if the problem still persists.
-
Yes, it was a release with no changes, just a test for some internal tools I'm using for development. Bests,
-
Hey, answering some of the questions: @XuvinWhat does it mean if the dataset/snapshot icon is yellow instead of blue: It means that the last snapshot is older than the time configured on the settings, is just a visual indicador that you should create a new snapshot for the dataset. @samsausagesI was wondering if you would consider a setting/button that allows the option for manual update only: Yes, I was finally able to get some time for working on the next update, and that's one of the planned features. @lordsysopUpdate 2023.09.05.31: It was just a test for the new CI/CD system I'm using: Sorry about that. @mihcox The only way i was able to delete anything was to completely stop the docker daemon: I haven't been able to reliable delete datasets used at some point by unraid without rebooting or stoping docker daemon; a procedure that sometimes works, is the following: Stop the docker using the directory Delete all snapshots, clones, holds, etc Delete the directory (rm -r <dataset-path>) Delete the dataset using ZFS Master or CLI. Sorry for the delay on the update with the lazy load functionality and custom refresh time guys, now I'm back to work on the plugin, so hopefully the new update adressing most of your concerns will be released this month.
-
Please read the first post on this thread, there is a comment about the situation.
-
I have updated the docker compose and the curl command to reflect the changes; please check it out and configure the components accordingly.
-
Usually "VMIP/VMHOST" is the same that Unraid, but you have to open the port on the Docker-Compose example I posted here, I'll edit the post to clarify that, because it can be confusing for some users.
-
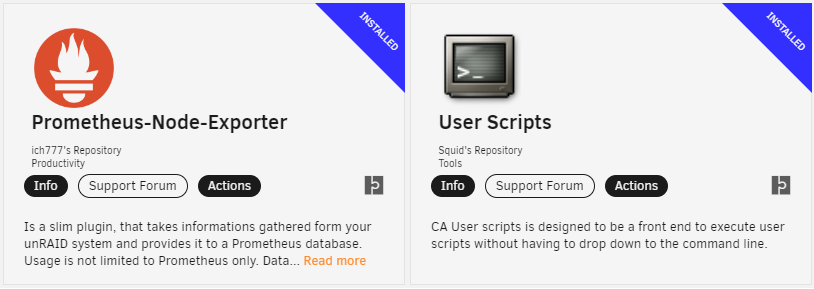
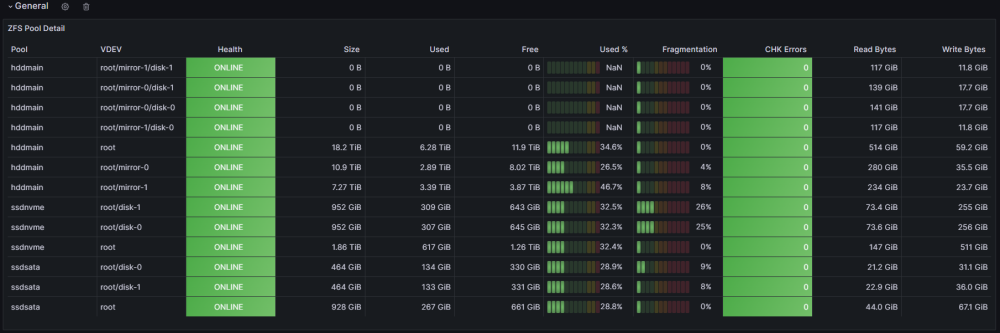
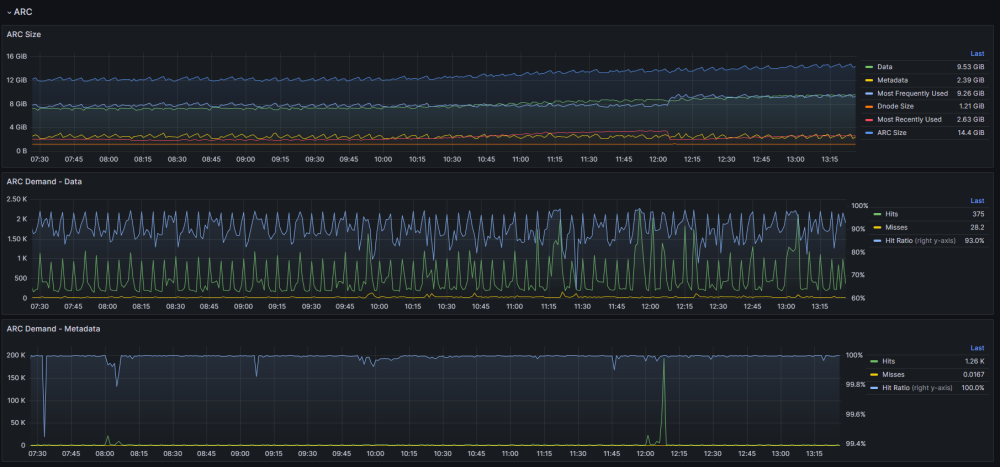
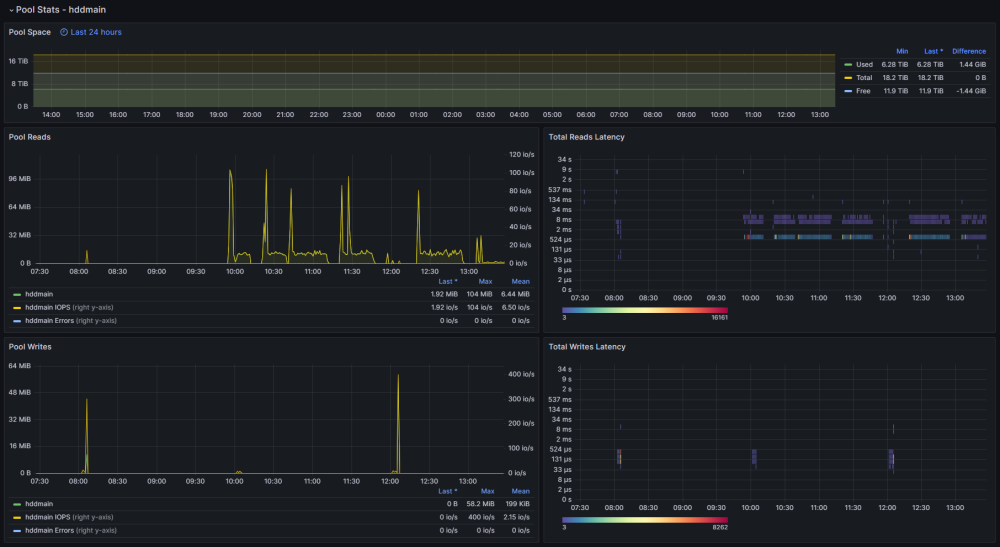
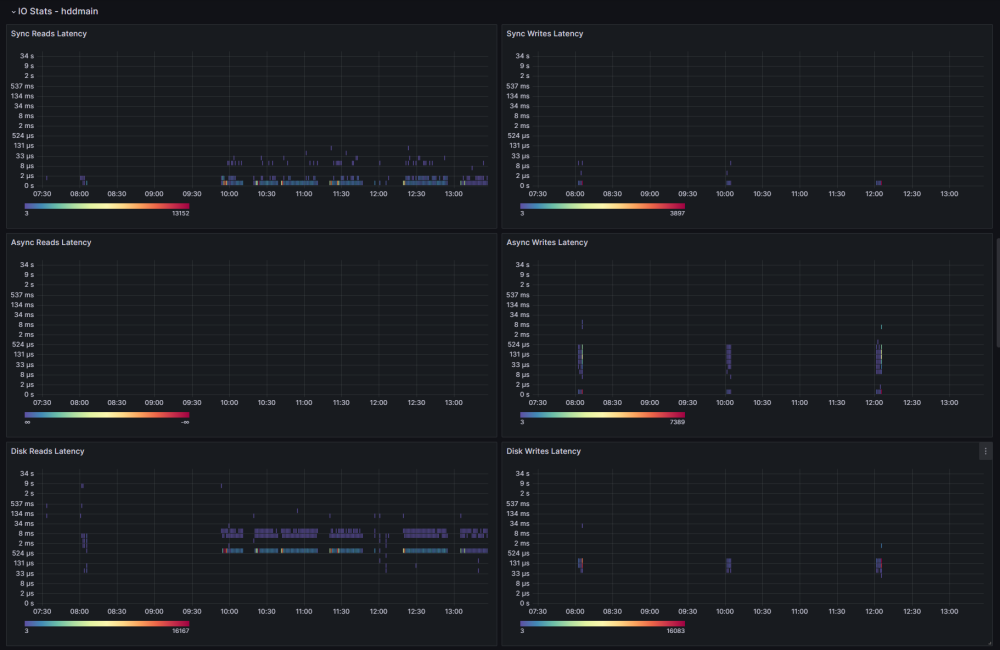
Back in the day, I wrote a post about monitoring and gathering some of the most relevant stats from ZFS; however, my stack has changed quite a bit since then, so this is a more updated and refined version of how to monitor ZFS monitoring on Unraid Tech Stack Unraid 6.9+ Prometheus Node Exporter - Plugin User Scripts - Plugin VictoriaMetrics (Docker Compose provided) Grafana VictoriaMetrics? VictoriaMetrics inclusion is not a common choice; what about InfluxDB and Prometheus? Well, it is pretty simple; InfluxDB has been going nowhere for quite some time, up to the point that they rewrote the entire thing for InfluxDB 3.0 (OSS not released yet), not exactly inspiring confidence for a long-term time series DB. And for Prometheus, it is pretty straightforward; Prometheus is not designed for long-term storage as there is no sharding or replication built-in, but we can always look for Prometheus-compatible alternatives; in this case, my choice was VictoriaMetrics (VM), only because is easy to deploy, maintain and offers compatibility with Prometheus queries, remote write, InfluxDB's Line Protocol, and a ton of other things (Check here for details). Installation We must install the Prometheus Node Exporter and User scripts plugin; both plugins work directly on Unraid (not docker) and require no further plugin configuration. This is a very simple step; just go to the Apps tab and look for the plugins: Deploying Grafana is beyond this post, but there is not a short amount of tutorials on how to deploy the app; keep in mind we are only interested in Grafana, not other components (Prometheus, InfluxDB, Telegraf, etc.). For VictoriaMetrics, use the following Docker Compose for deploying VM as a single instance with everything packed up listening in Unraid_IP:8428: services: victoriametrics: container_name: victoriametrics image: victoriametrics/victoria-metrics:latest volumes: - /mnt/user/appdata/victoriametrics:/victoria-metrics-data command: - "--retentionPeriod=6" # In Months - "--selfScrapeInterval=30s" # Self monitoring - "--loggerTimezone=America/Bogota" - "--maxLabelsPerTimeseries=60" # Increase for complex queries - "--promscrape.config=/victoria-metrics-data/prometheus.yml" restart: unless-stopped ports: - 8428:8428 Configuration Once everything is installed, we need to configure a few tasks for the scraping to be successful; let's start with the VM promscape configuration file: global: scrape_interval: 30s # By default, scrape targets every 30 seconds # Attach these labels to any time series or alerts when communicating with # external systems (federation, remote storage, Alertmanager). external_labels: monitor: 'vmetrics' scrape_configs: # Here we configure unraid scraping, this give us multiple stats not just ZFS - job_name: 'Unraid' scheme: http static_configs: - targets: ['192.168.1.100:9100'] This should get us a good amount of information, not only from ZFS but the entire system; our next step is to export ZFS-specific information, this can be achieved using multiple tools; one example could be Prometheus ZFS exporter, Prometheus exporter for ZFS stats and many others, the downside is that those exporters put some load on the system, mainly because the parsing task associated with them; that was the main reason for me to choose another option zpool_influxdb.8 — OpenZFS documentation; this has the benefit of being already present on ZFS, so you don't have to install anything else, just use the following user script "zpool_influxdb redirector": #!/bin/bash /usr/libexec/zfs/zpool_influxdb | curl -X POST 'https://<URAID_IP>:8428/write?extra_label=job=Unraid' --data-binary @- The script should run every minute; even if data comes in Influx's Line Protocol format, VM can parse it without too much trouble and inject it to the DB; we add another label, "job=Unraid" just in case we need to identify the source, host (Multiple Unraid servers anyone?). At this point, we should have everything correctly set up for our monitoring; the only missing part now is creating our dashboard and alerts if needed. Dashboard The dashboard I currently use is published here: ZFS Details | Grafana Labs; let's explore some of the panels and clarify what they are for. General This panel helps us keep an eye on some basic stats, like the Health, size, used and free space, and other more advanced, as the fragmentation and check errors are some of the most important elements for a pool. Depending on your pool topology, you may want to change panels here and there. ARC One of the most confusing features of ZFS is ARC (Adaptive Replacement Cache); with this panel, you can have the information needed to optimize, grow, or even shrink your ARC based on the utilization and the Hit Ratio. Pool Stats Pool stats are mainly direct to get info about how the writes and read from the pool, including the latency of those write/read requests; in some cases, you are going to be able to spot slow processes and devices based on the latency and how it performs against certain workloads. IO Stats IO Stats are all about latency, including multiple processes like Trim, Scrub, Sync, and Async operations; again, this becomes handy to diagnose certain problems for specific workloads and to complement other stats for the workloads you may be running on the pools. What about my Disks? You may notice that there are no stats for specific disks. The node exporter plugin includes disk-specific information; you can find some of those metrics on this dashboard Node Exporter Full | Grafana Labs, and import those that you may find helpful; personally, I rarely use my other disk dashboard, as is not helpful for me anymore, beyond some stats about how it's performing some new disks. Final Words This has been my go-to dashboard for the last year and works very well for me, and I sincerely hope you find it useful. One last thing you can add to your stack, and I strongly recommend you explore, is alerting; you can implement this in multiple ways; personally I use a combination of these two: VM Alert (vmalert · VictoriaMetrics) Grafana Alerts (Alerting | Grafana documentation) Best Regards!
-
As far as I know there is no built-in function to delete multiple datasets at the same level, however, with bash is possible, e.j: ls | grep -oE '\b[0-9a-f]{64}\b' | xargs -I{} echo {} You can replace echo with zfs destroy and add the pool
-
Not sure what is going on with the other drivers, but the "issue" only affects disk that are part of a ZFS pool.
-
Hey, sorry for the hard experience using ZFS, I see what I can do on the Plugin side to improve this for other users. Also, probably this video can help you on your ZFS journey:
-
Sure, I will include a new option beyond 5 minutes (Probably, 15m,30m, 1 hour and "manual") for the next version; in combination with the functionality already in place, it should provide the behaviour you are looking to.
-
Hi, I have added to the plugin description on the first page a little message about the subject, Note About Disks not Spinning Down ZFS Master wakes up the disks only when you open the dashboard in the main tab; this is because some snapshot information needs to be read from the disks, but again, this only happens when you open the dashboard in the main tab. However, I will clarify it again, this only happens when you access the dashboard main tab, given that the plugin doesn't have any background processes. If you close your browser or switch to a different dashboard section, let's say "shares", it does not query any information and will not mess with the disk's sleep. The plugin doesn't query the disks directly but the ZFS system, so, as far as I know, there is no way to "exclude" disks. As stated before, if you are not in the Dashboard Main Tab, the plugin is not running, so if your monitoring solutions tell you that the disks are spinning up even with the browser window closed or in a different section, there is something else beyond the plugin messing with your disks.
-
Seem like a bug given that your Pool it's not really "part" of the standard system pools, however, please check release notes for Unraid 6.12 and the new change in Shares. https://docs.unraid.net/unraid-os/release-notes/6.12.0/. Long story short... set the Share to Exclusive shares only present on your ZFS Pool.
-
This is a known issue: The "Show Datasets" Button is a mere graphic thing, not really something that performs an operation on the plugin. There are no plans to change that behavior in the short term. I could include it as part of the versions after the one with the lazy load functionality. Thanks for the report.
-
I'll see if it is possible to detect if you are using docker directory instead of docker image, and suggest the exclussion. Thanks for your feedback.
-
Check the Configuration section in the first post of this thread. You can define a pattern for excluding datasets from showing in the UI, for you specific case "/system/.*" should do the trick.