





Iker
Community Developer
-
Joined
-
Last visited
Everything posted by Iker
-
ZFS Master 2021.10.08e is live with a lot of fixes and new functionality, check it out: 2021.10.08e Add - SweetAlert2 for notifications Add - Refresh and Settings Buttons Add - Mountpoint information for Pools Add - Configurable Settings for Refresh Time, Destructive Mode, Dataset Exclusions, Alert Max Days Snapshot Icon Fix - Compatibility with Other Themes (Dark, Grey, etc.) Fix - Improper dataset parsing Fix - Regex warnings Fix - UI freeze error on some system at destroying a Dataset Remove - Unassigned Devices Plugin dependency
-
Parity disk does not contain data, just the information that is necessary for rebuilding the data present in others disks; if you swap the disk from parity to array, the array goes unprotected, any disk failure will be fatal for the information present in that particular disk, but nothing else.
-
There you go; check it out, any questions happy to help.ZFS -Influx1.8.json; also, check the parameters in the non_negative_derivative because your latency are way over the roof; maybe compare with the output of "zpool iostat -l".
-
Wow, that's great, seems that you got most of the panels working by now, let me know if you need any help.
-
As I stated in my answer, I use influxdb 2, so the query language is Flux, not InfluxQL; the data is still present in the database as long as you are using telegraf; but the queries are very different, for example: Pool Writes (Flux): from(bucket: "Telegraf") |> range(start: v.timeRangeStart, stop: v.timeRangeStop) |> filter(fn: (r) => r["_measurement"] == "zfs_pool") |> filter(fn: (r) => r["_field"] == "nwritten") |> aggregateWindow(every: v.windowPeriod, fn: mean) |> derivative(unit: 1s, nonNegative: true) |> map(fn: (r) => ({ _value: r._value, _time:r._time, _field : r.pool})) Pool Writes (InfluxQL): SELECT SELECT non_negative_derivative(mean("nwritten"), 1s) AS "writes" FROM "zfs_pool" WHERE $timeFilter GROUP BY time($__interval), "pool" fill(none) I'm not completely sure about the InfluxQL query (I don't have any Influx 1.8 DB available right now), but should be something along those lines. (https://docs.influxdata.com/influxdb/v1.8/flux/flux-vs-influxql/) In the next days I should come back to you with all the queries to their InfluxQL equivalent, just let me spin up a InfluxDB 1.8 and translate the queries.
-
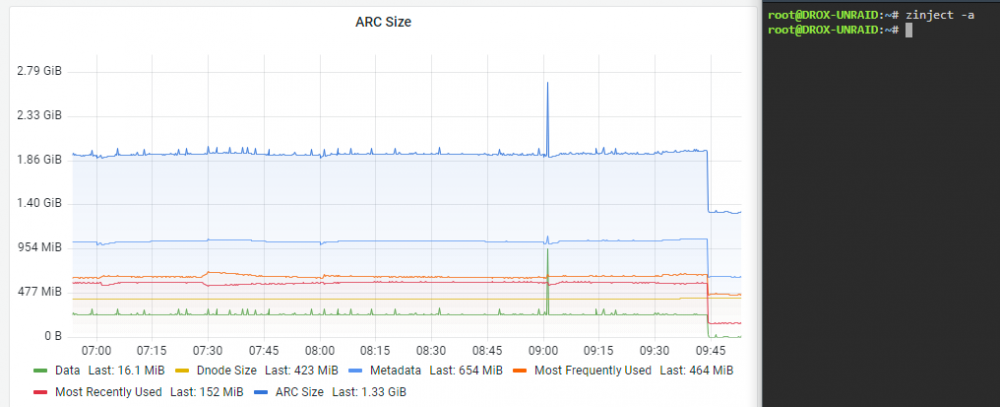
That's very common, is how ZFS is supposed to work, even with the SLOG, ARC continues working as normal, however, you could use "zinject -a" to force flush the ARC (without the failure simulation of course); my advice, try to go with "primarycache=metadata" in the dataset and see how it performs, in such configuration there should not be any difference in performance. https://openzfs.github.io/openzfs-docs/man/8/zinject.8.html
-
I also have the inconvenience with dockerfiles, I'm planning to create a settings page, so you could specify your own "excluded dataset" by name patterns or attributes; I have never used the Dark Theme, but the fix is pretty easy, however I'm very aware that the Styles for the plugin need a lot of work in general; probably next version both things are going to be completely fixed.
-
@ich777 thank you very much, the Plugin is live since this morning in the CA as "ZFS Master". To all you guys using ZFS, Any feedback, new functionality or bugs that you could find, don't hesitate to contact me :).
-
-
Well, initial version is ready to publish, anyone know how to submit for approval?, really look deep in the "Programming" section, but is not clear for me how to proceed. PD: If anyone wants to give it a try https://raw.githubusercontent.com/IkerSaint/ZFS-Master-Unraid/main/zfs.master.plg
-
No problem, panels are mixed between prometheus & influxdb 2 (telegraf); so, keep that in mind, the sintaxis of flux is very different. ZFS.json
-
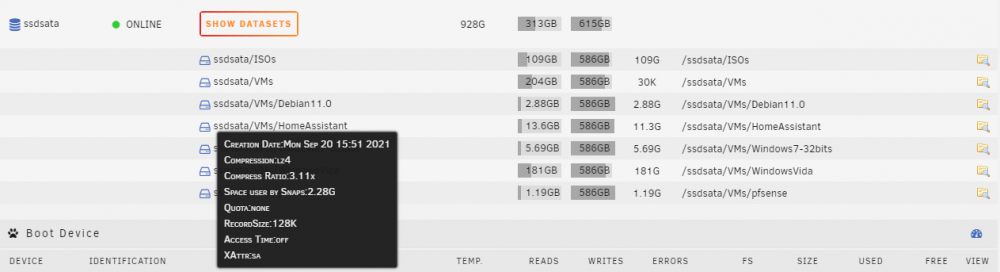
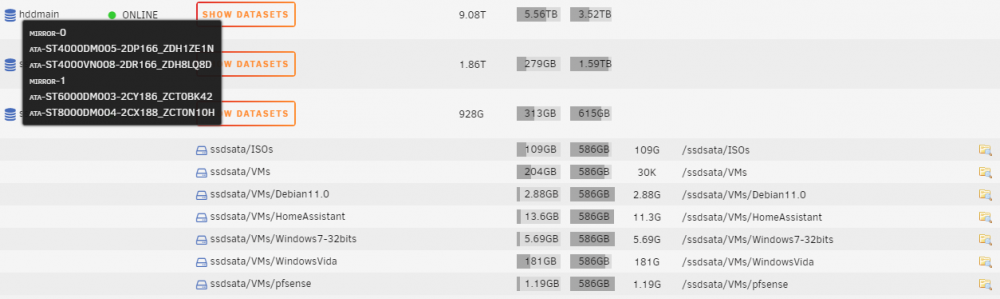
I'l take a look at this. Green ball turns yellow if degraded, red if faulted, blue if Offline, grey otherwise (Unavailable or Removed); the scrubb info is already present in ZFS Companion, i don't have the intention to replicate the information already present. Great Idea!. Got that info, nice & clean (I think), working now on snapshots, just the basic info & date: haven't forgotten you (dtrain):
-
True, but we don't know when is going to be, probably next year, in the meanwhile I'm not planning replace the Unraid interface, just add some visibility. Devices in the pool 👌 Last snapshot date… It's completely possible, but please hang in there for a while. Snapshots in general are a different monster, I'm thinking how to display them, there are some systems (like my own) with 1K snapshots in a single pool, displaying or even list every single one could be difficult.
-
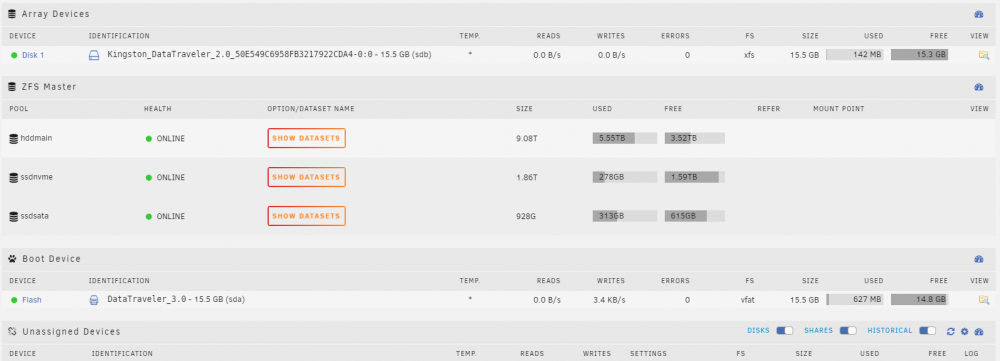
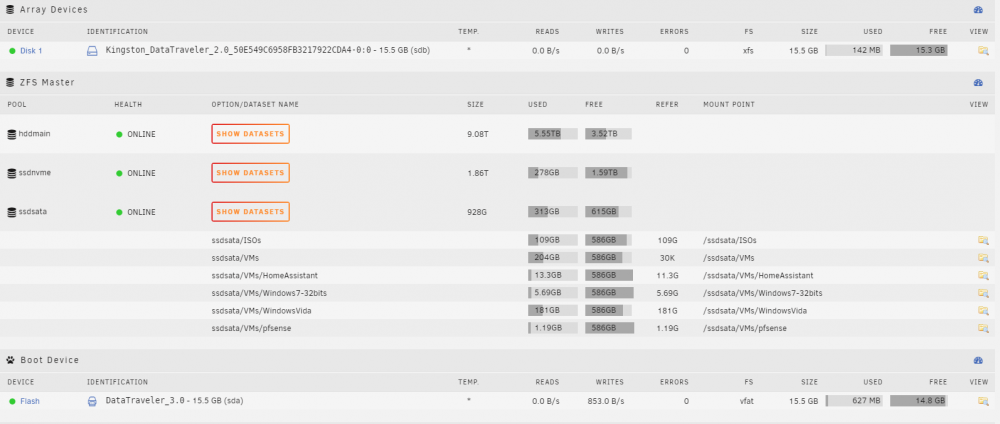
I have been working in a ZFS Plugin for the Unraid Main Tab, considering that I am not an experienced PHP developer, this probably is going to take a while. However, I want to ask you ZFS users, which information do you want to check in the Main tab, considering that as today we don't have any information about the pools. Any comment or feedback appreciated, this is the current look:
-
The discover of the pools is completely automatic, the only parametrization for the exporter is the command line arguments, these controls which properties, specific pools, and other options do you be included or if you want to exclude some datasets; this is an example of the command line: zfs_exporter --collector.dataset-snapshot --properties.dataset-snapshot="logicalused,referenced,used,written" --exclude=^ssdnvme/dockerfiles/ --collector.dataset-snapshot: Include the properties for the snapshots that could be present --properties.dataset-snapshot: (Depends upon previous setting) Include these properties for the snapshots --exclude: Regular expression for which datasets/snapshots/volumes must be excluded. There are some other options that maybe are interesting for you, these control the webgui, log level, etc. you could check all of them in zfs_exporter Github (https://github.com/pdf/zfs_exporter).
-
Hi ich777, of course that I have check your post, it was the first thing I find when I was looking for Prometheus zfs exporter plugin. Well, Create a plugin for zfs_exporter will be amazing for all ZFS Unraid users!, thank you very much!, however it will only apply for versions <= 6.9.2, as I stated in the post, with Unraid 6.10 things should be much easier with zfs_influxdb. Let me know if you need anything from me for the plugin.
-
Hi, first, thank you very much for this amazing plugins, I started to use ZFS for the Cache arrays a week ago, and it has been just great; I want to contribute with a couple of things: In the first post maybe is relevant to talk about "ashift", specially if you are creating a SSD pool, setting to 12 or 13 instead of 9 as is recommended in old or hdds guides is very important; also if you could discuss a bit about recordsize and recommendations by dataset use case, it will be great. I created a guide for users of ZFS Plugin who want to monitor their ZFS pools using Grafana & Prometheus & zfs_exporter, you could check it out At last but not least, as stated in my guide, there are some caveats with the monitoring that could be solver with the 2.1 version; I noticed in Github that you have build that version for Unraid 6.10, do you think that it could be build for 6.9.2, i'm willing to write another tutorial for the zfs_influxdb tool for proper monitoring of the pools.
-
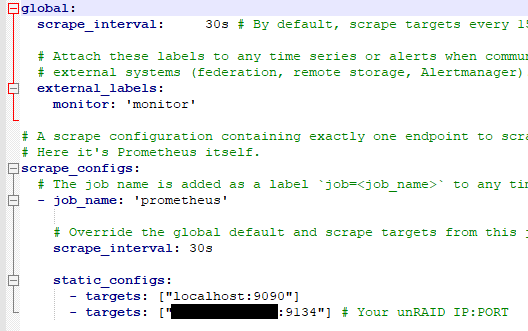
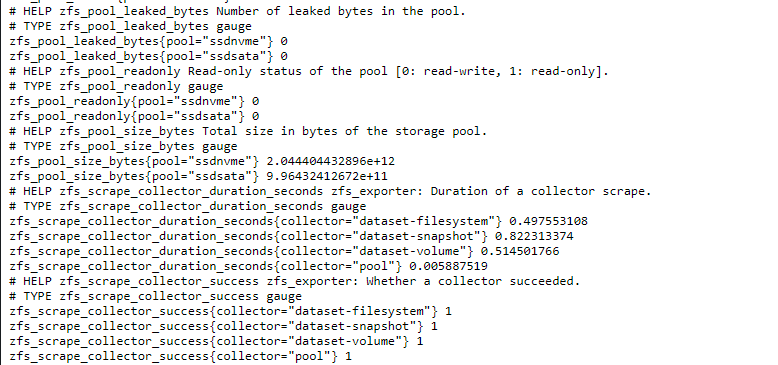
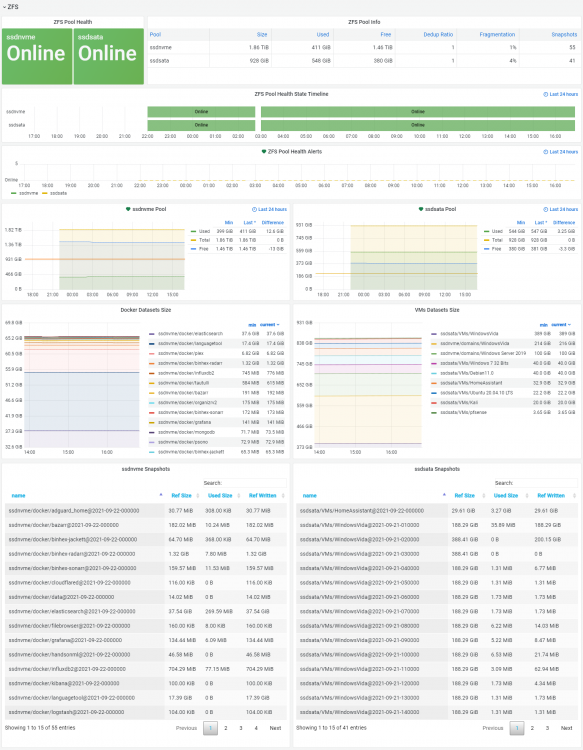
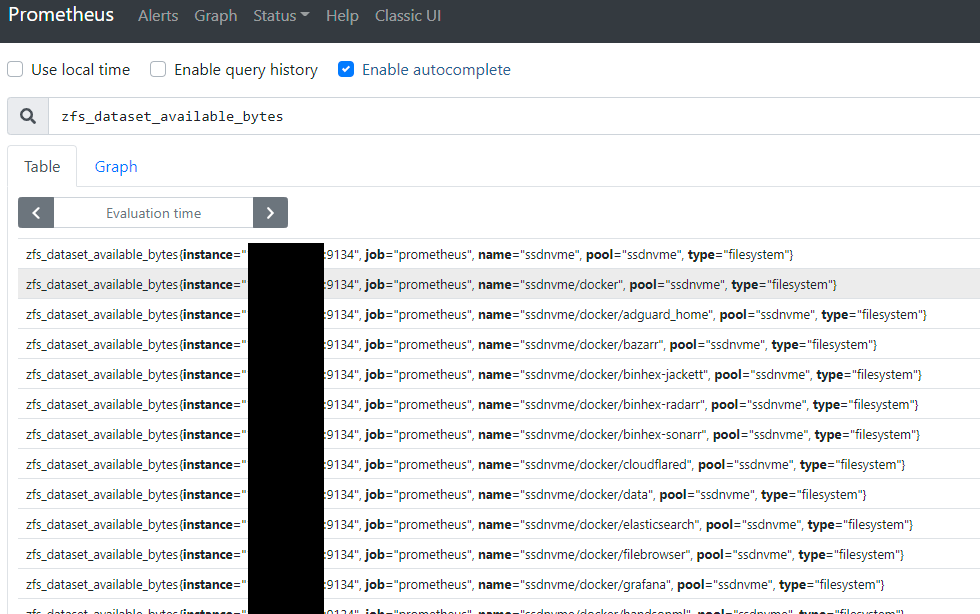
Overview: I started using ZFS a little while ago, but the lack of zfs-related information in the GUI really bothers me, however, my Unraid is mainly monitored from Grafana; so I started to look for monitoring solutions, but… found nothing that work consistently good in Unraid. This is a guide for users of ZFS Plugin who want to monitor their ZFS pools using Grafana & Prometheus & zfs_exporter. The only purpose of this is to some nice dashboard with the general stats of the pools (ARC stats not included, possible with Telegraf if you like). Requirements: Unraid <= 6.9.2 Grafana Basic Knowledge o PromQL Install zfs_exporter There is a limitation on what properties you could monitor with Telegraf on Linux, that means, no health status, zdev or dataset or volume info, snapshots, size of the pools, datasets, etc.; here is where zfs_exporter comes into play, it's a ZFS Prometheus exporter, single executable written in go that plays nice with Unraid. Download from the releases page the Linux x64 version, place it in a directory, preferably in one of your pools : https://github.com/pdf/zfs_exporter zfs_exporter-2.2.1.linux-amd64.tar.gz tar -xf zfs_exporter-2.2.1.linux-amd64.tar.gz -C /ssdnvme/scripts In User Scripts plugins, create a new script named zfs_exporter, the script contents is: #!/bin/bash echo "/ssdnvme/scripts/zfs_exporter --properties.dataset-filesystem="available,logicalused,quota,referenced,used,usedbydataset,written" --collector.dataset-snapshot --properties.dataset-snapshot="logicalused,referenced,used,written" --exclude=^ssdnvme/dockerfiles/" | at NOW -M > /dev/null 2>&1 Configure the scripts to be executed At Startup of Array, and you're done; the location of my Docker Folder is "/ssdnvme/dockerfiles" and it creates a lot of snapshots, you can exclude those paths with the "--exclude" parameter. If everything is ok, you should be able to access "http://YOURUNRAIDIP:9134/metrics" and see something like this If you are unable to access, check if zfs_exporter is running ("ps aux | grep zfs_exporter") Install Prometheus & Configure From the Community Applications install Prometheus Docker, modify "prometheus.yml" to collect metrics from "YOURUNRAIDIP:9134" Restart Prometheus, if everything went ok you should be able to test some expressions Create a Dashboard With Grafana the process is very straightforward, add the Prometheus source, and start work the panels to your preference; example: Final Words I don't expect this configuration to be necessary in the near future for Unraid, however is useful for me. Unraid 6.10 comes with ZFS 2.1 at least, which includes zfs_influxdb (https://openzfs.github.io/openzfs-docs/man/8/zpool_influxdb.8.html), making the process of exporting the metrics much easier. Hope it helps some ZFS users in the Unraid community, let me know if you have any questions or are having any issues getting this up and running.
-
From your logs, you created a RAID1 BTRFS pool, however that doesn't work exactly as you expect, mainly because there are different raid1 modes for BTRFS, check this post and configure as you want for most space, performance or data integrity https://btrfs.wiki.kernel.org/index.php/Using_Btrfs_with_Multiple_Devices
-
Hey, you need to create another config file in SWAG, the following is the content: server { listen 443 ssl; listen [::]:443 ssl; server_name homeassistant.*; include /config/nginx/ssl.conf; client_max_body_size 0; location / { include /config/nginx/proxy.conf; resolver 127.0.0.11 valid=30s; set $upstream_app 192.168.10.2; set $upstream_port 8123; set $upstream_proto http; proxy_pass $upstream_proto://$upstream_app:$upstream_port; proxy_set_header Upgrade $http_upgrade; proxy_set_header Connection "upgrade"; } location /api { include /config/nginx/proxy.conf; resolver 127.0.0.11 valid=30s; set $upstream_app 192.168.10.2; set $upstream_port 8123; set $upstream_proto http; proxy_pass $upstream_proto://$upstream_app:$upstream_port; proxy_set_header Upgrade $http_upgrade; proxy_set_header Connection "upgrade"; } }
-
Well, it depends, if you are using the "Performance" Governor, in my experience, almost all cores will be at 3.8 all the time; that doesn't let so much power for a single core to reach the 4.6 Ghz advertised, most commonly 4.2 or 4.3 if you have both CPU cables connected and thermals under control (I replaced the stock cooler for a Cooler Master Hyper 212 and my case is well ventilated); personally I use the "On Demand" governor, it adds a little of latency, but my workloads are mostly single core, so my CPU goes up to 4.4 sustained (4.6 are just in microseconds, is impossible to "watch", just record) in single core task, with temps around 63-65 c; an all core (24) task goes 4.0 in all cores with temps around 78-81. Of course, you could try to overclock and force a single core in the Bios, but in general it's not recommended, Ryzen 2d Gen doesn't have a lot of space to overclock, default stock settings are a lot more stable and well balanced.
-
Hi, that is an issue with the x470 board BIOS, in my older mobo I had the exact same Processor and board, a x470 Gaming Pro Carbon with 2.E0 Bios; you have to enable the option "AMD Cool & Quiet" ; "PBO" and "Global C-States" must be Enabled; make sure that 'Power supply idle mode' is set to 'Typical Idle Current'; then the ACPI Driver could work nice and let you choose the profile that you prefer. Even if I haven't checked your ram in the QVL list for the MSI Board, as a safe measure, disable DOCP and let the ram at 2133 Mhz, then, when everything is stable, start your way up in the ram speed, as an advice, you should never go beyond 3200; 3600 Mhz is way to high for the Processor and Unraid in general (I could be wrong, but there is not much performance left in the table beyond 3200 with a 3900x). Let me know if everything works ok.
-
Guacamole is a good option, however, you could try using a TCP Proxy - HAProxy will be a perfect solution as well.
-
I have a Ryzen 3900x, recently I have to create a Windows 7 x32 Machine, and it works without problems.
-
Hi, i'm also using portainer, the compatibility with a proper compose file isn't complete so probabily you should use docker compose, It is possible to install docker-compose in unraid so you could just download the yml files and "docker-compose up" your docker.






