


jsmontague
Members
-
Joined
-
Last visited
Everything posted by jsmontague
-
because even with ZFS pools NVME is still faster
-
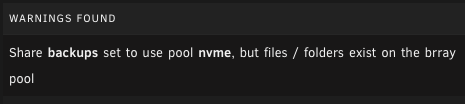
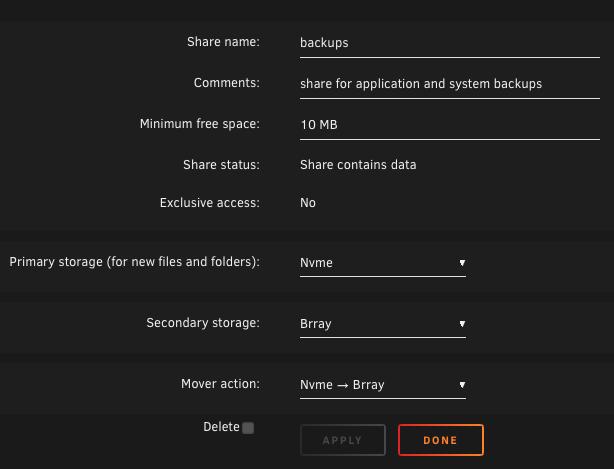
Just like Lumpy_BD I also just converted my server to ZFS pools and finished migrating data back to it. All my shares set to cache primary array secondary are getting a warning in "fix common problems" about files/folders existing on the secondary. Looks like the checks aren't taking into account the secondary folder at all in the scan. alexandria-diagnostics-20250222-0723.zip
-
I've been waiting for the next issue to pop up but we're back to stable since disabling flash backup and connect. Thanks for all the help JorgeB!
-
I have removed it for now. Could that have lead to the SMB issue?
-
I knew I shouldn't have posted Every minute my logs are shows the UpdateFlashBackup update log, tried to use git show and git log in boot to find commits and what is being saved however there was no updates today even with the posts. Noticed that SMB also didn't work (went to go look at syslog to see if I could find what triggered it). Tried to restart SMB and now have permission errors and the flash backup is started again with no changes. alexandria-diagnostics-20231113-1330.zip syslog
-
Rebuilt server has no ongoing errors, and I accidentally left safari browsers open last couple days that did not cause the same bug (was prior using edge).
-
Tried reseating RAM and what ever was on its way out has finally given up the ghost, it no longer will turn on or post. At this point I think it's just new MB/CPU/RAM time
-
Thats what I thought I had originally (a RAM issue), so I swapped my 128GB out for 32GB from my lab box. All of it is enterprise ECC RAM never had a problem with RAM before in any system. Could I really have 2 different sets of RAM with issues or is it possibly CPU/board related?
-
So far so good, but I saw the below in the log. Nov 2 15:59:17 Alexandria kernel: mce: [Hardware Error]: Machine check events logged Nov 2 15:59:17 Alexandria kernel: mce: [Hardware Error]: Machine check events logged mcelog: failed to prefill DIMM database from DMI data Kernel does not support page offline interface mcelog: Cannot read sysfs field /sys/kernel/security/lockdown: No such file or directory Kernel in lockdown. Cannot enable DIMM error location reportingFallback Socket memory error count 163 exceeded threshold: 163 in 24h Location SOCKET:1 CHANNEL:? DIMM:? [] Running trigger `socket-memory-error-trigger' (reporter: sockdb_fallback) Hardware event. This is not a software error. MCE 0 not finished? CPU 8 BANK 7 TSC 1e0037342d89a MISC 152561e86 ADDR 52d7e2940 TIME 1698789886 Tue Oct 31 17:04:46 2023 MCG status: MCi status: Error overflow Corrected error MCi_MISC register valid MCi_ADDR register valid MCA: MEMORY CONTROLLER RD_CHANNEL2_ERR Transaction: Memory read error STATUS cc00290000010092 MCGSTATUS 0 MCGCAP 1000c19 APICID 20 SOCKETID 1 MICROCODE 42e CPUID Vendor Intel Family 6 Model 62 Step 4 Hardware event. This is not a software error. MCE 0 CPU 8 BANK 7 TSC 189d3a0f42916 MISC 30684286 ADDR 4ab0d1940 TIME 1698958757 Thu Nov 2 15:59:17 2023 MCG status: MCi status: Error overflow Corrected error MCi_MISC register valid MCi_ADDR register valid MCA: MEMORY CONTROLLER RD_CHANNEL2_ERR Transaction: Memory read error STATUS cc00040000010092 MCGSTATUS 0 MCGCAP 1000c19 APICID 20 SOCKETID 1 MICROCODE 42e CPUID Vendor Intel Family 6 Model 62 Step 4 Hardware event. This is not a software error. MCE 1 CPU 8 BANK 11 TSC 189d3a0f42916 MISC 90000000000208c ADDR 742c52000 TIME 1698958757 Thu Nov 2 15:59:17 2023 MCG status: MCi status: Corrected error MCi_MISC register valid MCi_ADDR register valid MCA: MEMORY CONTROLLER MS_CHANNEL2_ERR Transaction: Memory scrubbing error MemCtrl: Corrected patrol scrub error STATUS 8c000050000800c2 MCGSTATUS 0 MCGCAP 1000c19 APICID 20 SOCKETID 1 MICROCODE 42e CPUID Vendor Intel Family 6 Model 62 Step 4 Hardware event. This is not a software error. MCE 2 CPU 8 BANK 7 TSC 189d3a0f501de MISC 202ebe86 ADDR 4d4647700 TIME 1698958757 Thu Nov 2 15:59:17 2023 MCG status: MCi status: Error overflow Corrected error MCi_MISC register valid MCi_ADDR register valid MCA: MEMORY CONTROLLER RD_CHANNEL2_ERR Transaction: Memory read error STATUS cc00044000010092 MCGSTATUS 0 MCGCAP 1000c19 APICID 20 SOCKETID 1 MICROCODE 42e CPUID Vendor Intel Family 6 Model 62 Step 4 Hardware event. This is not a software error. MCE 3 CPU 8 BANK 7 TSC 189d3a0f571d2 MISC 2076e086 ADDR 4ab0d5540 TIME 1698958757 Thu Nov 2 15:59:17 2023 MCG status: MCi status: Error overflow Corrected error MCi_MISC register valid MCi_ADDR register valid MCA: MEMORY CONTROLLER RD_CHANNEL2_ERR Transaction: Memory read error STATUS cc00030000010092 MCGSTATUS 0 MCGCAP 1000c19 APICID 20 SOCKETID 1 MICROCODE 42e CPUID Vendor Intel Family 6 Model 62 Step 4 Hardware event. This is not a software error. MCE 4 CPU 8 BANK 7 TSC 189d3a0f5e316 MISC 205a9686 ADDR 4ab0d5d40 TIME 1698958757 Thu Nov 2 15:59:17 2023 MCG status: MCi status: Error overflow Corrected error MCi_MISC register valid MCi_ADDR register valid MCA: MEMORY CONTROLLER RD_CHANNEL2_ERR Transaction: Memory read error STATUS cc0000c000010092 MCGSTATUS 0 MCGCAP 1000c19 APICID 20 SOCKETID 1 MICROCODE 42e CPUID Vendor Intel Family 6 Model 62 Step 4
-
Yup synching is trying to rebuild its database, just found it. Thanks Jorge! Still feels like the system is not performing as it has in the past but can't sort out why so everything little thing has me running down rabbit holes. Appreciate your help!
-
The server started a parity check and is running at 1-5 MBs when it typically does a parity check around 150MBs. I don't see anything in the logs outside of the below. I'm going to cancel the parity and I'll restart the server into safe mode today. Nov 1 22:00:01 Alexandria kernel: mdcmd (39): check NOCORRECT Nov 1 22:00:01 Alexandria kernel: Nov 1 22:00:01 Alexandria kernel: md: recovery thread: check P Q ... alexandria-diagnostics-20231102-0641.zip
-
I did not know that..... Next lockup I'll put it in safe mode to rule out plugins! I confirmed with netstat that I have no open HTTPS session to the box, will report back in couple days if were still up! Thanks Jorge!
-
I have my server boot into WEB mode but leave the connected monitor/keyboard+mouse off. Could it be that web session?
-
I can't boot into safe mode as I need the services to be working, but I did shutdown my browser before I put my laptop to sleep. Is there anything else that could cause that? Is this a bug, never had to close a browser to any system before to keep it from crashing. The server was running hours after those logs so I dismissed them as root cause, will see if I can identify any other system that might have a browser open to unraid.
-
Looking for other ideas to pinpoint my issue, server locked up yesterday evening a little after 5:00pm local time but provided nothing in syslog prior and was not able to use onboard keyboard/mouse or SSH to try and pull DIAG. Had to hard power cycle it to get it back up. alexandria-diagnostics-20231101-0830.zip syslog-192.168.36.150.log
-
My logs are full of nginx memory full errors. Attached new diag. Is this tied to a page being left open on browser of a device that is asleep overnight or something else? Can't believe that's a thing but it's a few of the google results I found when searching for the log messages. Oct 30 20:00:33 Alexandria kernel: clocksource: timekeeping watchdog on CPU6: hpet wd-wd read-back delay of 54266ns Oct 30 20:00:33 Alexandria kernel: clocksource: wd-tsc-wd read-back delay of 106577ns, clock-skew test skipped! Oct 30 20:24:51 Alexandria nginx: 2023/10/30 20:24:51 [crit] 12347#12347: ngx_slab_alloc() failed: no memory Oct 30 20:24:51 Alexandria nginx: 2023/10/30 20:24:51 [error] 12347#12347: shpool alloc failed Oct 30 20:24:51 Alexandria nginx: 2023/10/30 20:24:51 [error] 12347#12347: nchan: Out of shared memory while allocating message of size 27101. Increase nchan_max_reserved_memory. Oct 30 20:24:51 Alexandria nginx: 2023/10/30 20:24:51 [error] 12347#12347: *1306818 nchan: error publishing message (HTTP status code 500), client: unix:, server: , request: "POST /pub/devices?buffer_length=1 HTTP/1.1", host: "localhost" Oct 30 20:24:51 Alexandria nginx: 2023/10/30 20:24:51 [error] 12347#12347: MEMSTORE:00: can't create shared message for channel /devices Oct 30 20:24:52 Alexandria nginx: 2023/10/30 20:24:52 [crit] 12347#12347: ngx_slab_alloc() failed: no memory Oct 30 20:24:52 Alexandria nginx: 2023/10/30 20:24:52 [error] 12347#12347: shpool alloc failed Oct 30 20:24:52 Alexandria nginx: 2023/10/30 20:24:52 [error] 12347#12347: nchan: Out of shared memory while allocating message of size 27101. Increase nchan_max_reserved_memory. Oct 30 20:24:52 Alexandria nginx: 2023/10/30 20:24:52 [error] 12347#12347: *1306826 nchan: error publishing message (HTTP status code 500), client: unix:, server: , request: "POST /pub/devices?buffer_length=1 HTTP/1.1", host: "localhost" Oct 30 20:24:52 Alexandria nginx: 2023/10/30 20:24:52 [error] 12347#12347: MEMSTORE:00: can't create shared message for channel /devices Oct 30 20:24:56 Alexandria nginx: 2023/10/30 20:24:56 [crit] 12347#12347: ngx_slab_alloc() failed: no memory Oct 30 20:24:56 Alexandria nginx: 2023/10/30 20:24:56 [error] 12347#12347: shpool alloc failed Oct 30 20:24:56 Alexandria nginx: 2023/10/30 20:24:56 [error] 12347#12347: nchan: Out of shared memory while allocating message of size 27106. Increase nchan_max_reserved_memory. Oct 30 20:24:56 Alexandria nginx: 2023/10/30 20:24:56 [error] 12347#12347: *1306868 nchan: error publishing message (HTTP status code 500), client: unix:, server: , request: "POST /pub/devices?buffer_length=1 HTTP/1.1", host: "localhost" Oct 30 20:24:56 Alexandria nginx: 2023/10/30 20:24:56 [error] 12347#12347: MEMSTORE:00: can't create shared message for channel /devices Oct 30 20:24:57 Alexandria nginx: 2023/10/30 20:24:57 [crit] 12347#12347: ngx_slab_alloc() failed: no memory Oct 30 20:24:57 Alexandria nginx: 2023/10/30 20:24:57 [error] 12347#12347: shpool alloc failed Oct 30 20:24:57 Alexandria nginx: 2023/10/30 20:24:57 [error] 12347#12347: nchan: Out of shared memory while allocating message of size 27111. Increase nchan_max_reserved_memory. Oct 30 20:24:57 Alexandria nginx: 2023/10/30 20:24:57 [error] 12347#12347: *1306881 nchan: error publishing message (HTTP status code 500), client: unix:, server: , request: "POST /pub/devices?buffer_length=1 HTTP/1.1", host: "localhost" Oct 30 20:24:57 Alexandria nginx: 2023/10/30 20:24:57 [error] 12347#12347: MEMSTORE:00: can't create shared message for channel /devices Oct 30 20:24:58 Alexandria nginx: 2023/10/30 20:24:58 [crit] 12347#12347: ngx_slab_alloc() failed: no memory Oct 30 20:24:58 Alexandria nginx: 2023/10/30 20:24:58 [error] 12347#12347: shpool alloc failed Oct 30 20:24:58 Alexandria nginx: 2023/10/30 20:24:58 [error] 12347#12347: nchan: Out of shared memory while allocating message of size 27111. Increase nchan_max_reserved_memory. Oct 30 20:24:58 Alexandria nginx: 2023/10/30 20:24:58 [error] 12347#12347: *1306889 nchan: error publishing message (HTTP status code 500), client: unix:, server: , request: "POST /pub/devices?buffer_length=1 HTTP/1.1", host: "localhost" Oct 30 20:24:58 Alexandria nginx: 2023/10/30 20:24:58 [error] 12347#12347: MEMSTORE:00: can't create shared message for channel /devices alexandria-diagnostics-20231031-0844.zip
-
Perfect, I'll add recreating the docker image to the list! Appreciate it
-
Could changing RAM resolve that? I haven't re-created the image but since swapping RAM it hasn't come back yet either (still early though it could).
-
Here is some logs I got right before my server locked up that I am not sure root cause on either. Oct 28 21:20:11 Alexandria kernel: BTRFS critical (device loop2): corrupt leaf: root=2 block=13575421952 slot=43, invalid key objectid, have 18446612789731309144 expect to be aligned to 4096 Oct 28 21:20:11 Alexandria kernel: BTRFS info (device loop2): leaf 13575421952 gen 4571109 total ptrs 201 free space 2780 owner 2 Oct 28 21:20:11 Alexandria kernel: #011item 0 key (13517111296 169 0) itemoff 16250 itemsize 33 Oct 28 21:20:11 Alexandria kernel: #011#011extent refs 1 gen 4540846 flags 2 Oct 28 21:20:11 Alexandria kernel: #011#011ref#0: tree block backref root 20620 Oct 28 21:20:11 Alexandria kernel: #011item 1 key (13517127680 169 0) itemoff 16190 itemsize 60
-
I didn't realize disks/controllers didn't support trim for SSDs, I'll dig into that this week thanks Jorge!
-
Thanks Jorge, I'll flip that over to ipvlan today. Not sure if captured in the diags but I still see the below in my syslog output. Oct 29 11:12:51 Alexandria kernel: clocksource: timekeeping watchdog on CPU18: hpet wd-wd read-back delay of 82063ns Oct 29 11:12:51 Alexandria kernel: clocksource: wd-tsc-wd read-back delay of 124876ns, clock-skew test skipped! Oct 29 11:30:49 Alexandria kernel: clocksource: timekeeping watchdog on CPU5: hpet wd-wd read-back delay of 53079ns Oct 29 11:30:49 Alexandria kernel: clocksource: wd-tsc-wd read-back delay of 100990ns, clock-skew test skipped! Oct 30 04:00:23 Alexandria kernel: sd 1:0:8:0: [sdj] tag#2980 UNKNOWN(0x2003) Result: hostbyte=0x00 driverbyte=DRIVER_OK cmd_age=0s Oct 30 04:00:23 Alexandria kernel: sd 1:0:8:0: [sdj] tag#2980 Sense Key : 0x5 [current] Oct 30 04:00:23 Alexandria kernel: sd 1:0:8:0: [sdj] tag#2980 ASC=0x21 ASCQ=0x0 Oct 30 04:00:23 Alexandria kernel: sd 1:0:8:0: [sdj] tag#2980 CDB: opcode=0x42 42 00 00 00 00 00 00 00 18 00 Oct 30 04:00:23 Alexandria kernel: critical target error, dev sdj, sector 467807832 op 0x3:(DISCARD) flags 0x800 phys_seg 1 prio class 2 Oct 30 04:00:23 Alexandria kernel: BTRFS warning (device sdj1): failed to trim 1 device(s), last error -121 Oct 30 04:18:49 Alexandria kernel: sd 1:0:7:0: [sdi] tag#2726 UNKNOWN(0x2003) Result: hostbyte=0x00 driverbyte=DRIVER_OK cmd_age=0s Oct 30 04:18:49 Alexandria kernel: sd 1:0:7:0: [sdi] tag#2726 Sense Key : 0x5 [current] Oct 30 04:18:49 Alexandria kernel: sd 1:0:7:0: [sdi] tag#2726 ASC=0x21 ASCQ=0x0 Oct 30 04:18:49 Alexandria kernel: sd 1:0:7:0: [sdi] tag#2726 CDB: opcode=0x42 42 00 00 00 00 00 00 00 18 00 Oct 30 04:18:49 Alexandria kernel: critical target error, dev sdi, sector 935397439 op 0x3:(DISCARD) flags 0x800 phys_seg 1 prio class 2 Oct 30 04:18:49 Alexandria kernel: BTRFS warning (device sdi1): failed to trim 1 device(s), last error -121 Oct 30 04:18:49 Alexandria root: /etc/libvirt: 920 MiB (964657152 bytes) trimmed on /dev/loop3 Oct 30 04:18:49 Alexandria root: /var/lib/docker: 19.4 GiB (20827594752 bytes) trimmed on /dev/loop2 Oct 30 04:18:49 Alexandria root: /mnt/nvme: 2.2 TiB (2396491730944 bytes) trimmed on /dev/nvme0n1p1
-
For last week I've been trying to track down a hardware issue. From logs I've been pointed all over the place and haven't gotten any closer, hopefully can get some direction from the group here. I attached diagnostics from earlier and again from today. This morning I decided to swap RAM as I had a lab box that has had no issues with 32GB of RAM that I could install. Afterwards I now have different errors and they still point potentially to RAM issue. alexandria-diagnostics-20231029-1423.zip alexandria-diagnostics-20231024-0631.zip
-
Finally got around to upgrading my backup server to 6.12.2 from 6.11.x version. The dashboard was working fine for days after upgrade and works fine after reboot for a period of time until it doesn't. The status for all plugins says "up-to-date".
-
I would wager you are right. Will keep an eye on the support channel for the next version with the fix but for now 2.10 allowed me to at least run through all the disks which is good enough for now. Thanks for the continued effort, really appreciate this tool!
-
Since they benchmark individually fine each time with no issue or speed gap detection error makes me feel like its something else going on, but appreciate the help. I have a server full of new to me disks I really needed to check outside of a pre-clear for issues so being able to run them all makes me feel better!


